Discover a world of clarity with our visualization chart templates tailored for Keynote. These tools are essential for designers, analysts, and speakers aiming to turn raw numbers into compelling narratives. From scatter plots to heat maps, our collection covers diverse formats that suit any presentation style, ensuring your message lands with precision.
Built for the Apple ecosystem, these templates leverage Keynote`s smooth animations and vector graphics for seamless editing. Professionals in tech, finance, and research appreciate how they simplify complex datasets, while educators find them invaluable for interactive lessons. The result? Slides that engage, inform, and persuade without sacrificing elegance.
Whether you`re preparing a startup pitch or a conference talk, our visualization charts provide the foundation for standout content. With intuitive drag-and-drop features, customization takes minutes, not hours. Browse our selection now and unlock the potential of your ideas through superior visual design.


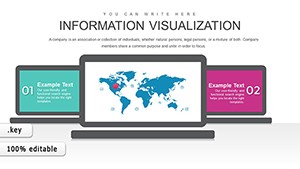
Visualization charts go beyond basic graphs by incorporating layers of meaning, such as trend lines or interactive elements, ideal for exploring multifaceted data. In Keynote, they shine for their fluid transitions, making abstract concepts tangible. Businesses use them for dashboard overviews, revealing KPIs at a glance, while scientists plot experimental results to spot anomalies effortlessly.
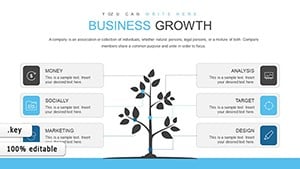
Our templates surpass generic options with bespoke layouts that adapt to your theme. Standard Keynote charts can appear flat; ours add depth through shading and icons, increasing comprehension by highlighting patterns others miss. This edge is crucial in high-stakes environments where every detail influences outcomes.
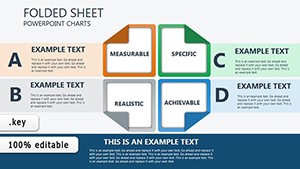
Embrace best practices like consistent scaling and minimalistic labels to keep focus on insights. For creativity, overlay multiple chart types - a line graph within a radial design - to weave stories that captivate.
Keynote`s magic lies in its build effects; pair them with our templates for reveals that sync with your speech. A practical example: In a sales forecast, animate data points emerging from zero, building excitement as projections unfold. This technique fosters deeper connections, turning passive viewers into active participants.
Compared to rivals, our designs prioritize accessibility with high-contrast modes and alt-text readiness, ensuring inclusivity. Dive deeper: Use magic move transitions between slides for seamless data evolution, a feature that elevates narratives effortlessly.
Curious to try? Grab a visualization template now and refine your approach.
These strategies ensure your visuals not only inform but inspire confidence and action.
Imagine a marketing director using our treemap template to dissect budget allocations: Nested rectangles reveal ROI disparities, prompting strategic shifts that boosted returns by 20%. Or a researcher animating a network diagram to trace viral spread patterns, clarifying findings for grant proposals.
In education, interactive choropleth maps help students grasp geographic variances, fostering curiosity. Our UVP? Unlimited scalability and theme harmony, so your charts feel native to any deck.
Empower your narratives with visualization mastery. Explore and download Keynote charts today to craft presentations that truly resonate.
Copyright © 2009-2026 ImagineLayout All rights reserved.