Table Keynote Charts

Tables in presentations often hold the key to understanding patterns and relationships in data. Our table Keynote charts templates elevate standard grids into engaging visuals, ideal for reports, comparisons, and detailed analyses. Designed for professionals who deal with metrics, these templates ensure information is presented logically and attractively.

Think of transforming a spreadsheet into a sleek table with alternating rows for better readability, or adding icons for quick scans. Rooted in data organization best practices, they help users avoid dense, unappealing slides.

Aimed at analysts, educators, and managers, the benefits include sortable columns in interactive modes and seamless Keynote integration for edits. Compatibility with PowerPoint and Google Slides adds versatility for shared work.

From budget breakdowns to performance trackers, these templates cover diverse needs, providing value through clarity and efficiency. Start exploring our range and pick the tables that will organize your next presentation effectively.


View by: Last Added | Most Popular
  • like 4
    (385)
    Air Delivery Logistics Keynote Charts Template
    ID: #KC00959
    $18.00
  • like 2
    (409)
    Successful Start in Business: Elevate Your Keynote Presentations
    ID: #KC00930
    $24.00
  • like 3
    (297)
    Target Vision Cycle Keynote Charts: Chart Your Bold Future
    ID: #KC00912
    $18.00
  • like 3
    (1031)
    Infographic Mastery: Venn Unions and Intersections in Keynote
    ID: #KC00810
    $18.00
  • like 4
    (23)
    Collection Periods Cycle Keynote Charts: Simplifying Financial Flows
    ID: #KC00760
    $22.00
  • like 4
    (985)
    Influence Meaning Keynote Charts: Decode Relationships and Insights Effortlessly
    ID: #KC00270
    $18.00
  • like 4
    (282)
    Aspiration Cycle Charts for Keynote: Fuel Your Presentation's Momentum
    ID: #KC00224
    $20.00
  • like 4
    (40)
    Engaging Analysis Puzzles Keynote Charts
    ID: #KC00204
    $23.00
  • like 3
    (960)
    Power of Divided Ball Keynote Charts: Spherical Insights Unleashed
    ID: #KC00149
    $25.00
  • like 2
    (526)
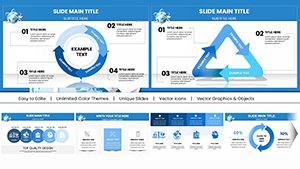
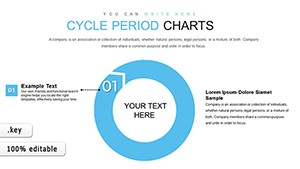
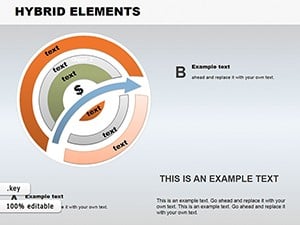
    Hybrid Elements Keynote Charts: Fusion of Data and Design Mastery
    ID: #KC00147
    $10.00
  • like 3
    (49)
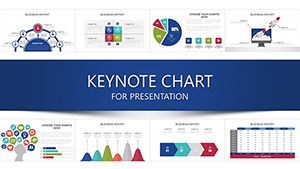
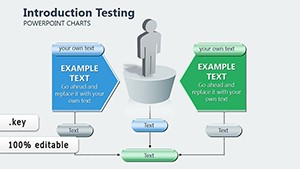
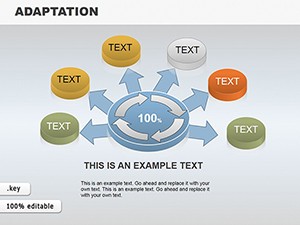
    Adaptation Keynote Charts: 3D Cycle Templates for Project Evolution
    ID: #KC00138
    $14.00
  • like 4
    (161)
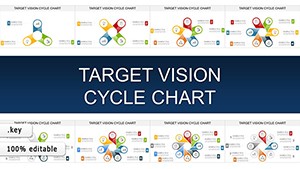
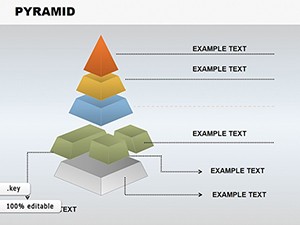
    3D Pyramid Keynote Charts: Build Layers of Insight
    ID: #KC00130
    $20.00
  • like 3
    (124)
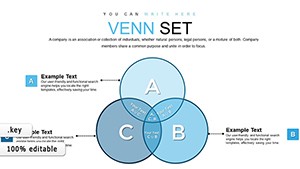
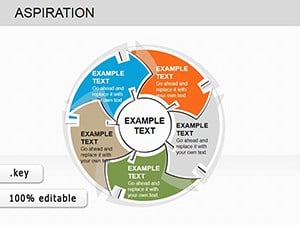
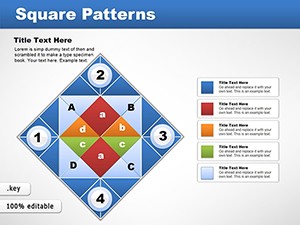
    Square Patterns Keynote Charts Template: Creative and Professional Designs
    ID: #KC00043
    $18.00
  • like 4
    (688)
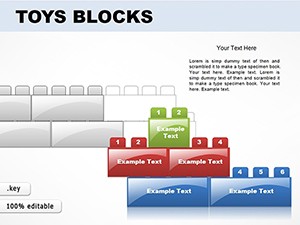
    Toy Blocks Keynote Template: Playful & Professional
    ID: #KC00037
    $25.00


Enhancing Data Clarity with Table Charts

Tables are essential for presenting multifaceted data, and our Keynote templates make them more than just rows and columns. They incorporate design elements like borders, shading, and alignments to guide the eye, ensuring viewers grasp insights quickly. This method aligns with cognitive principles that favor organized information for better retention.

For those handling large datasets, these templates prevent overload by allowing collapsible sections or highlighted summaries.

Core Benefits for Data-Driven Users

  • Readability Improvements: Use of whitespace and fonts to make text pop.
  • Interactivity Potential: Add hyperlinks or filters for deeper exploration.
  • Customization Depth: Adjust cell sizes and merge for complex layouts.
  • Cross-Tool Support: Works well in PowerPoint or Google Slides environments.

Feedback from users indicates that such tables streamline review processes, cutting down on clarification questions.

Use Cases for Table Templates in Practice

In analytical roles, tables excel at side-by-side comparisons, like product feature matrices. Educators might use them for timelines of events, making history lessons vivid. Managers can track employee performance with scorecards, facilitating fair evaluations.

An example comes from a consulting firm that employed our pricing table template in proposals. By clearly delineating options, they increased client uptake by presenting value transparently.

Varied Applications

  1. Financial Reporting: Balance sheets with categorized entries.
  2. Research Summaries: Data compilation from studies.
  3. Project Overviews: Task assignments and statuses.

These scenarios highlight tables' versatility in conveying structured information effectively.

Best Practices for Table Integration

Begin by defining your data's purpose, then choose a template that matches - simple for overviews, detailed for in-depth. Populate with accurate figures, and use conditional formatting to emphasize trends, like color-coding variances.

A practical tip is to limit rows to what's essential, avoiding scroll-heavy slides that dilute focus.

Advanced Editing Techniques

  • Embed formulas for automatic calculations.
  • Incorporate icons for visual cues.
  • Align with slide themes for uniformity.

These steps ensure your tables contribute meaningfully to the presentation's goals.

Differentiating from Basic Tables

Standard Keynote tables lack the polished extras our templates provide, such as themed borders or integrated charts within cells. This enhancement makes data more engaging compared to plain grids.

In educational contexts, illustrated tables have proven to boost comprehension, as seen in classroom settings where students retain more from visual aids.

Standout Value

The true advantage is in their ability to transform raw data into actionable intelligence, with designs that evolve alongside user feedback.

Organize your data better - select and download a table template tailored to your needs right away.

FAQ

How can tables improve presentation flow?

By grouping related data, they create logical breaks, helping audiences follow along without confusion.

Are these templates suitable for large datasets?

Yes, with options for pagination or summaries to handle extensive information gracefully.

Can I add charts inside tables?

Certainly, embed mini-graphs in cells for hybrid visuals that enrich analysis.

What accessibility features are included?

High-contrast text and screen-reader friendly structures to ensure inclusivity.

How do I update data in these tables?

Simply edit cells directly in Keynote, with changes reflecting instantly.

Do they support multilingual content?

Absolutely, with flexible font options for various languages.

(Word count: 862)