Forge ahead with strategic PowerPoint charts that illuminate paths to success. Curated for tacticians and visionaries, this assortment delivers versatile graphics for everything from SWOT breakdowns to KPI dashboards, ensuring your strategies resonate deeply.
These charts empower clear articulation of objectives, turning abstract plans into concrete visuals. Whether for annual reviews or ad-hoc analyses, they adapt to your rhythm.
Geared for ambitious professionals, explore these to infuse your presentations with strategic savvy and start shaping outcomes today.
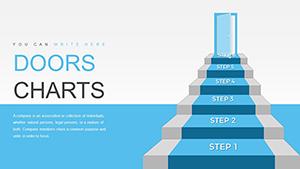
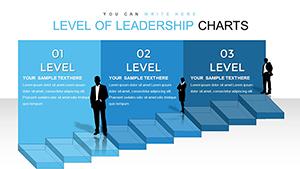
Leadership PowerPoint Template: Climb to Success with Engaging Visuals
ID: #PC00769
$16.00
(337)
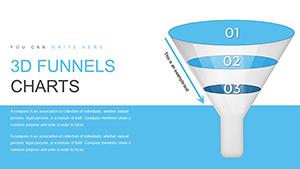
Branching Out Service PowerPoint Charts Template: Expand Your Architectural Horizons
ID: #PC00757
$20.00
(956)
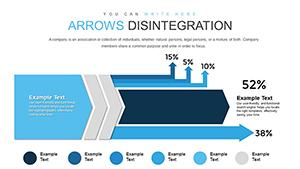
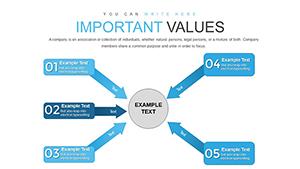
Action PowerPoint Charts Template with Centralized Arrows
ID: #PC00755
$16.00
(615)
6-Sigma Analysis PowerPoint Charts: Precision in Every Presentation
ID: #PC00747
$14.00
(426)
SEO Infographic PowerPoint Charts Template
ID: #PC00735
$15.00
(220)
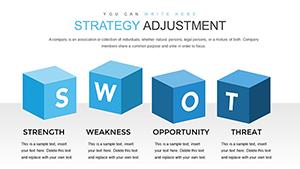
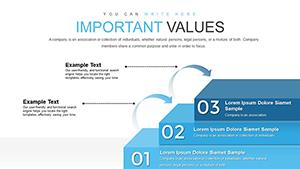
Business Strategy PowerPoint Charts Template: Craft Winning Strategies Visually
ID: #PC00698
$18.00
(803)
Sliced Pie PowerPoint Charts - Instant Download | ImagineLayout
ID: #PC00677
$15.00
(784)
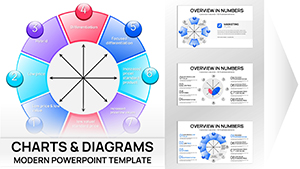
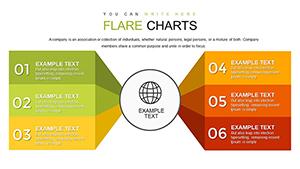
Petal Flower PowerPoint Charts Template: Blossom Your Ideas into Visual Masterpieces
ID: #PC00674
$15.00
Elevating Strategy Through PowerPoint Charts
Strategic PowerPoint charts are your allies in complexity, featuring multi-axis designs for holistic views - like combining PESTLE factors with performance metrics. They suit board-level overviews or departmental deep dives.
Analysts refine forecasts, leaders rally teams. Built-in templates accelerate from concept to canvas.
Broad Applications
HR: Talent pipeline funnels.
Operations: Process efficiency radars.
Sales: Territory conquest maps.
A consulting firm`s client roadmap: layered charts fuse timelines with milestone bubbles, guiding from assessment to achievement.