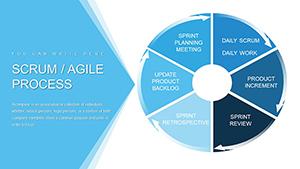
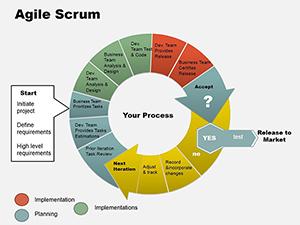
Agile teams thrive on clarity, and our Scrum PowerPoint charts deliver just that. Curated for scrum masters, product owners, and developers, these templates transform raw data into insightful visuals that drive decisions and foster collaboration.
From burndown trackers to velocity gauges, each chart is pre-formatted for easy integration into your slides, featuring clean lines, color-coded segments, and animation-ready builds. They`re built to handle real-world scrum dynamics, making complex iterations feel intuitive.
Suited for software houses, marketing squads, and any iterative project group, these tools cut prep time and amplify meeting productivity. Turn numbers into narratives that motivate your team forward.
Dive into our Scrum charts collection and elevate your agile game.
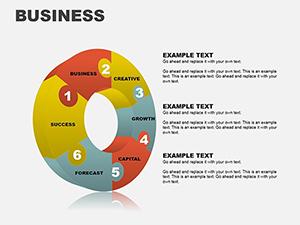
3D Business Puzzle Charts for PowerPoint: Unlock Data Magic
ID: #PC00058
$24.99
(406)
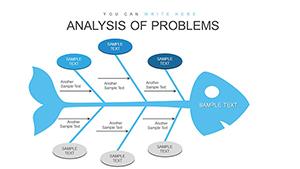
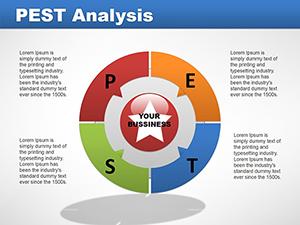
PEST Analysis PowerPoint Charts Template
ID: #PC00041
$23.00
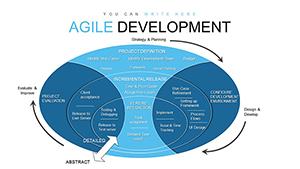
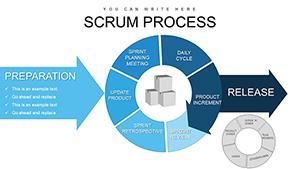
Harnessing Charts in Scrum Presentations
Scrum demands transparency, and nothing communicates progress like a well-crafted chart. Our PowerPoint templates outshine defaults with interactive elements, such as hover effects for details and scalable axes for varying datasets. This allows for on-the-fly adjustments during stand-ups or retrospectives.
In software development, use pie charts for task allocation; in marketing, bar graphs for campaign velocity. Education teams adapt them for project timelines, ensuring everyone stays aligned.
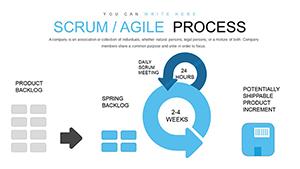
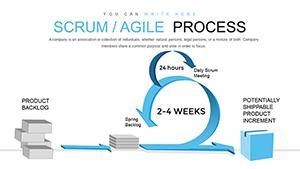
Key Use Cases
Daily Stand-Ups: Quick velocity charts to review sprint health.
Sprint Reviews: Cumulative flow diagrams for stakeholder updates.
Retrospectives: Radar charts to plot team satisfaction metrics.
Planning Sessions: Gantt hybrids for backlog prioritization.
Unlike basic Excel imports, these are native PowerPoint objects, preserving quality and editability across versions.
Pro Tips for Chart Excellence
Select chart types based on data story - lines for trends, areas for overlaps. Apply scrum color conventions (green for done, red for blocked) for instant recognition. Animate reveals sequentially to build suspense and comprehension.
Success Through Visual Scrum
A dev team slashed reporting time by 50% using our burndown template, focusing more on delivery. A remote agency visualized cross-timezone sprints, improving sync and output.
These stories highlight how charts turn scrum into a visual language everyone speaks.
Advanced Chart Hacks
Link charts to live data sources for real-time updates.
Overlay annotations for contextual notes.
Export as images for report embeds.
Download now and chart your path to efficiency.
Frequently Asked Questions
Delve further into agile visualization with these robust resources, totaling around 1,100 words of guidance.