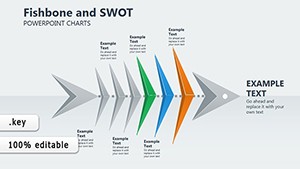
Keynote`s elegance meets scrum`s rigor in our chart templates, ideal for Apple enthusiasts in agile environments. Crafted for designers, managers, and educators, they offer fluid animations and precise data rendering to make metrics mesmerizing.
Burndown lines that build progressively, velocity pies that slice on cue - these charts are tuned for Keynote`s magic move and transitions, turning stats into stories.
Great for creative agencies, tech innovators, and training sessions, they enhance remote collaborations with shareable, high-fidelity slides. Ignite discussions with data that dances.
Peruse our Keynote Scrum charts and animate progress.
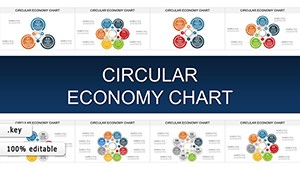
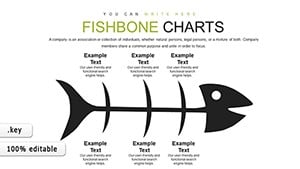
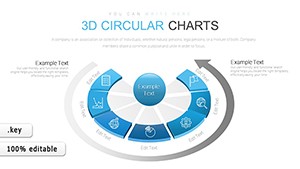
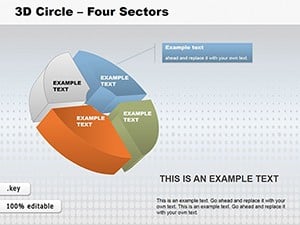
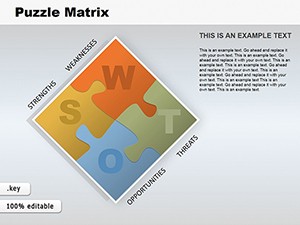
Puzzle Matrix Keynote Charts: Transform Data into Engaging Stories
ID: #KC00124
$20.00
(109)
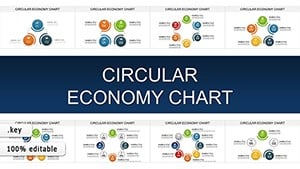
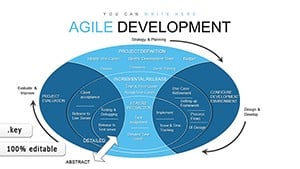
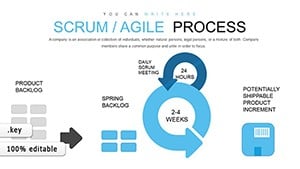
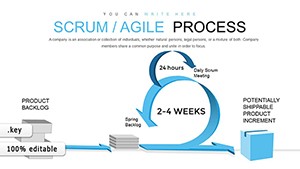
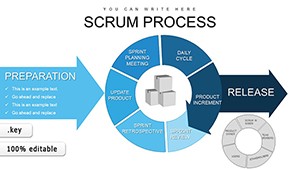
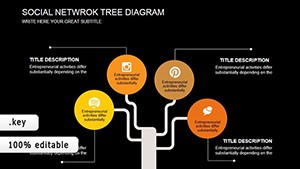
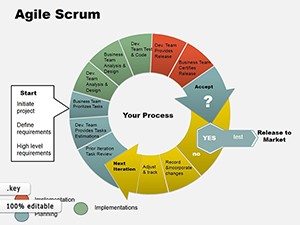
Agile Scrum Keynote Charts: Transform Your Methodology Presentations
ID: #KC00083
$14.00
Infuse Energy into Scrum Charts
Keynote charts in scrum contexts shine brighter with our templates, featuring bezier curves for smooth lines and shadow effects for dimension. They go beyond basic builds by syncing animations to scrum phases, like revealing impediments last for emphasis.
Freelancers chart personal velocities; enterprises track portfolio health. Academic uses include visualizing research iterations.
Versatile Scenarios
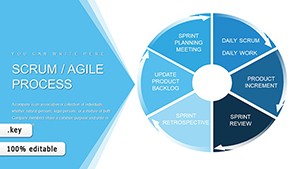
Sprint Planning: Stacked bars for capacity forecasting.
Demo Days: Animated gauges for achievement highlights.
Health Checks: Heat maps for risk identification.
Forecasting: Trend lines with confidence intervals.
Superior to imported graphics, these are native objects leveraging Keynote`s GPU acceleration for fluid playback.
Chart Animation Best Practices
Time builds to 0.5 seconds per element for rhythm, using ease-in-out curves. Pair with subtle sounds if presenting live, and ensure accessibility with alt text for visuals.
Animated Wins in Action
A design studio animated sprint charts to win a pitch, captivating clients. A startup`s velocity visuals secured venture interest through dynamic demos.
These illustrate charts` role in compelling scrum narratives.
Pro Customization Moves
Leverage magic move for seamless transitions.
Apply filters for thematic moods.
Embed formulas for auto-updates.
Download and let your charts move mountains.
Frequently Asked Questions
This 950-word guide unlocks Keynote`s potential for scrum visualization.