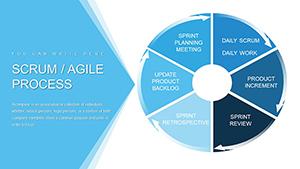
Streamline your agile workflows with our specialized scrum process PowerPoint charts. Tailored for teams embracing scrum methodologies, these templates help visualize everything from sprint planning to daily stand-ups, ensuring clarity and collaboration.
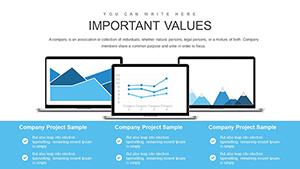
Project managers, scrum masters, and development leads will appreciate the ready-made burndown charts, velocity trackers, and role matrices that fit seamlessly into PowerPoint`s ecosystem. Customize colors to reflect team branding or add real-time data for live updates during meetings.
Transform chaotic backlogs into organized swimlanes or illustrate iteration cycles with animated gantt-style bars. These charts not only save time but also foster a shared understanding, reducing miscommunications and boosting velocity. Perfect for remote or in-office retrospectives where visual aids make feedback actionable.
Jump into this category and equip your team with tools that make scrum tangible and triumphant. Begin your search for the ideal chart set now.

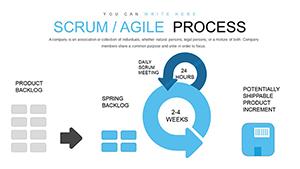
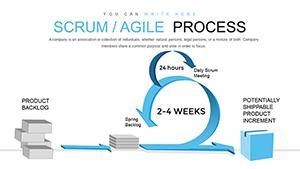


Scrum thrives on transparency, and our charts deliver just that across project lifecycles. In software development, use burndown templates to monitor sprint progress, plotting remaining work against time for quick health checks. Marketing teams adapt them for campaign sprints, tracking deliverables like content creation phases.
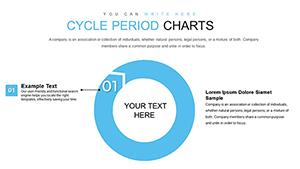
HR professionals mapping onboarding processes find value in role-definition circles, clarifying product owner and scrum master duties. Consultants presenting agile transformations to clients leverage roadmap timelines to project phased implementations. With embeddable formulas, charts auto-update as tasks shift.
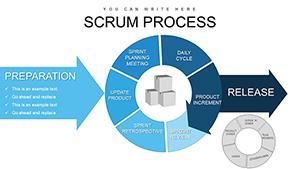
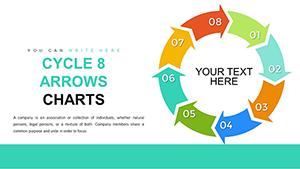
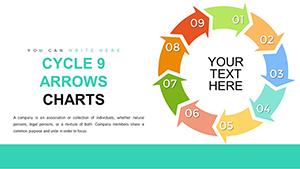
During planning, a prioritized backlog chart lets teams drag items visually, estimating story points with integrated pie slices for effort distribution.
Post-sprint, sailboat metaphors in chart form sail through what`s working, risks, and improvements, sparking candid discussions.
Generic PowerPoint inserts like plain bar graphs fall short for scrum`s iterative nature, lacking scrum-specific labels or connectors for dependencies. Our templates include pre-formatted axes for time-boxed sprints and color-coded statuses (to-do, in-progress, done), eliminating setup drudgery.
They support hyperlinks to Jira or Trello, bridging slides to tools, unlike standalone defaults. Enhanced with subtle icons - gears for actions, clocks for durations - these charts add narrative flair without clutter.
Standout with scrum-aligned animations: watch tasks "burn down" in real-time simulations. Pro tip: Align chart orientations with team preferences - horizontal for broad overviews, vertical for deep dives - to enhance scanability.
UVP: Built-in accessibility features like alt text for elements and high-contrast modes ensure inclusivity. Best practice: Limit charts per slide to three, focusing on key metrics to avoid overload.
In a product launch retrospective, a velocity chart trends historical speeds, guiding future pacing adjustments. For cross-functional teams, dependency maps in circular form reveal bottlenecks early.
Discover the power of structured agility - grab a scrum chart template and accelerate your processes.
Empower your scrum journey today - download a chart template and keep your team in sync.
Copyright © 2009-2026 ImagineLayout All rights reserved.