Pie process PowerPoint Charts
Pie charts show proportions perfectly while process charts guide audiences through steps smoothly.
Our collection combines both with more than 100 dedicated pie and process chart PowerPoint templates.
Every design is fully editable features modern colors and includes animation options ideal for market share reviews or workflow explanations.
Great for strategy meetings training or progress reports.
Start with free designs or choose premium updates.
-
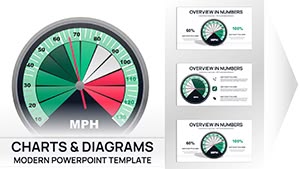
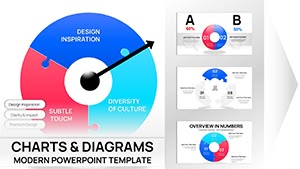
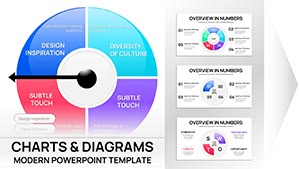
Professional Gauge Charts PowerPoint Template
ID: #PC01099
-

Cycle Periods PowerPoint Template for Time-Based Charts
ID: #PC01096
-
Pie Charts PowerPoint Template - 26 Editable Slides
ID: #PC01094
-
Bowman's Strategy Clock Charts Template for PowerPoint - 40 editable slides
ID: #PC01088
-
Cycle Periods Incoming PowerPoint Charts Template - 44 Slides
ID: #PC01087
-
Process Puzzle Pie PowerPoint Charts Template
ID: #PC01074
-

Dynamic Puzzle Pie Charts PowerPoint Template
ID: #PC01073
-
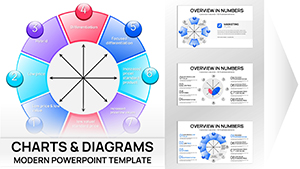
Professional Pie Charts PowerPoint Template
ID: #PC01067
-
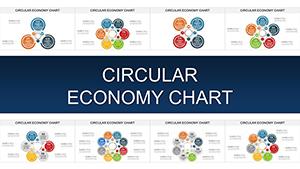
Circular Economy PowerPoint Charts - Infographic Template
ID: #PC00908
-
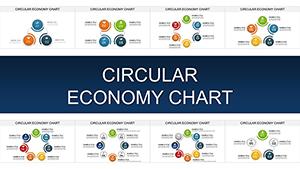
Circular Economy Charts: PowerPoint Tools for Sustainable Architecture
ID: #PC00904
-
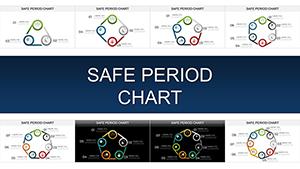
Safe Period Charts: Your Ultimate PowerPoint Guide to Cycle Awareness
ID: #PC00903
-
Project Cycle Steps PowerPoint Charts: Mastering Architecture Management
ID: #PC00902
-
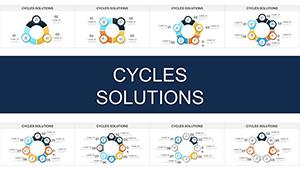
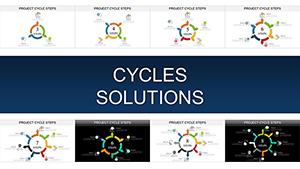
Cycles Solutions Infographic: PowerPoint Charts for Architectural Innovation
ID: #PC00901
-
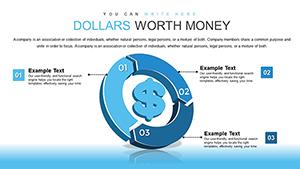
Currency Converter PowerPoint Charts Template - Editable PPT Slides
ID: #PC00835
-
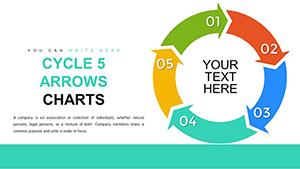
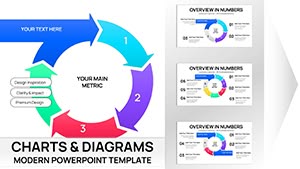
5-Step Cycle Arrows PowerPoint Charts Template: Visualize Continuous Flows Effortlessly
ID: #PC00779
-
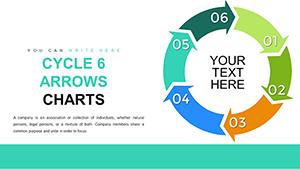
6-Step Cycle Arrows PowerPoint Charts Template: Craft Dynamic Narratives with Ease
ID: #PC00778
-
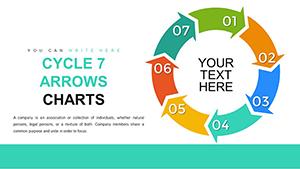
7-Step Cycle Arrows PowerPoint Charts Template: Navigate Success with Precision
ID: #PC00777
-
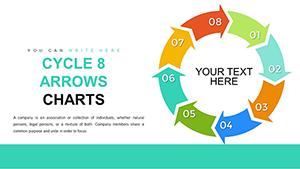
Cycle 8 Arrows PowerPoint Charts Template: Revolutionize Your Visual Storytelling
ID: #PC00776
-
9-Step Cycle Arrows PowerPoint Charts: Empower Your Narratives
ID: #PC00775
-

Cycle 10 Arrows PowerPoint Template: Master Complex Processes
ID: #PC00774
-

11-Step Cycle Arrows PowerPoint: Detailed Process Mastery
ID: #PC00773
-

3-Set Venn PowerPoint Template for Clear Comparisons
ID: #PC00772
-
Data Comparison Chart PowerPoint Template - Fully Editable & Instant Download
ID: #PC00760
-

World Economic Situation PowerPoint Charts: Presentation Template
ID: #PC00591
Strengths of Professional Pie and Process Charts
Basic versions lack style and impact. Our templates bring visual appeal smart segmentation and smooth flow that engage viewers.
Popular Applications
Market Share Analysis
Display segments percentages and leaders clearly.
Workflow Mapping
Outline steps phases or timelines step by step.
Resource Allocation
Show budget distribution or team workload.
Product Lifecycle
Illustrate stages from concept to launch.
Standout Features
- Exploding pie segments for emphasis
- Circular and linear process options
- Color-coded sections
- Animated builds and transitions
- Percentage labels included
Expert Tips
Limit pie slices to 6 maximum. Use process arrows consistently.
Highlight key segments with color or explosion. Animate slices or steps sequentially. Keep labels readable.
Want stronger proportion and process visuals? Browse our pie and process chart templates and download today.
Frequently Asked Questions
Are pie and process chart templates free?
Yes. Free options exist alongside premium advanced designs.
Can I explode pie slices for emphasis?
Yes. Most pie templates include easy explosion controls.
Do process charts support multiple paths?
Many include branching options for complex workflows.
Are percentage labels automatic?
Yes. Labels update automatically when data changes.