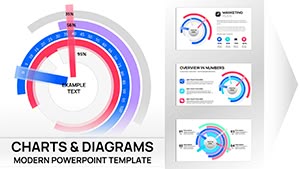
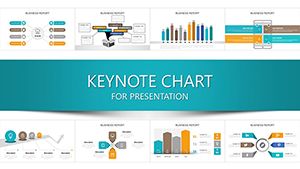
Dive into our performance chart Keynote templates, perfect for Mac enthusiasts crafting data-rich presentations. These Apple Keynote slides boast elegant charts from doughnuts to polar areas, tailored for executive dashboards or research overviews.
Designers and strategists love the fluid animations that reveal insights progressively, supporting imports from Numbers for seamless workflows. Brand-aligned themes keep your visuals cohesive.
Track everything from app speeds to market shares with precision. High-DPI ready for Retina displays, they deliver crisp details. Explore the lineup and chart your achievements today.
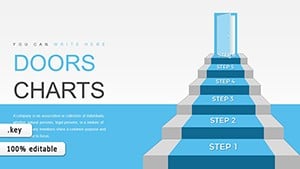
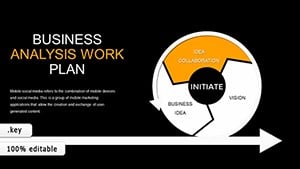
Step and Cycle Infographic Keynote Template: Map Processes with Elegance
ID: #KC00493
$22.00
(946)
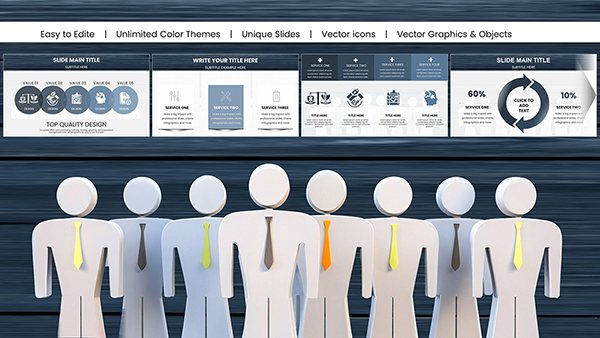
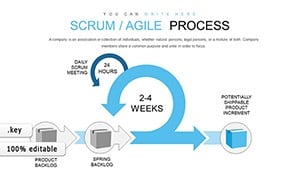
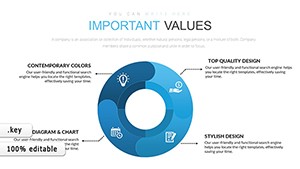
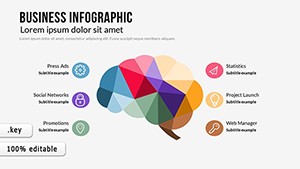
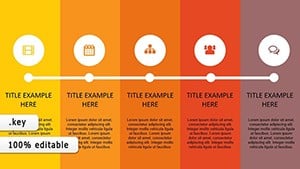
Business Infographic Keynote Charts: Craft Compelling Narratives with Ease
ID: #KC00479
$21.00
(874)
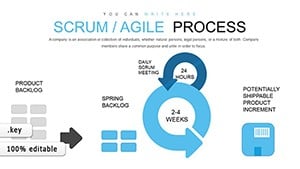
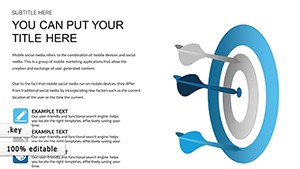
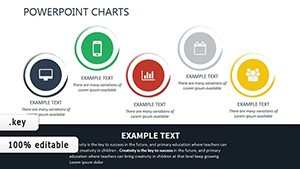
Dynamic Model Animation Charts in Keynote
ID: #KC00460
$18.00
(1129)
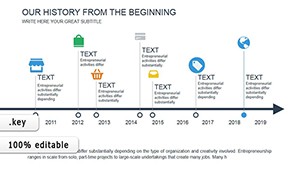
Bring History to Life: History Timeline Keynote Charts Template
ID: #KC00453
$12.00
(486)
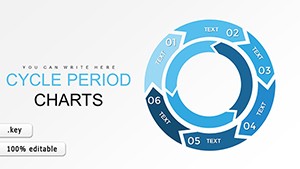
Market Development Charts: Animate Growth Strategies
ID: #KC00449
$18.00
(634)
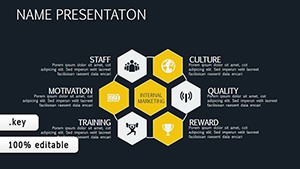
Decision Support System Keynote Charts Template
ID: #KC00428
$16.00
(1167)
Customer Loyalty Keynote Charts: Forge Unbreakable Bonds with Data
ID: #KC00426
$20.00
Versatile Use Cases for Performance Keynote Charts
Product managers demo feature adoption with area charts, while analysts dissect quarterly KPIs. Event planners visualize attendance trends for future planning.
Environmental groups chart sustainability metrics, and musicians track tour stats. Non-profits measure impact with radial gauges.
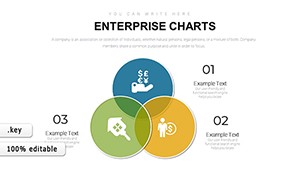
Strategic Planning: Bubble charts for multi-variable analysis.
Sales Forecasting: Forecast lines with confidence intervals.
Personal Development: Radar for skill assessments.
Endless possibilities for performance portrayal.
Exceeding Standard Keynote Charts
Keynote basics lack variety; ours provide 70+ customizable types with gesture-based edits. Auto-legend generation and data labels save hours of tweaking.
Scriptable actions for custom behaviors, like drill-downs. Haptic feedback cues during builds for live tweaks.
Pro Advice for Chart Creation
Match chart complexity to audience - simple for execs, detailed for experts. Use whitespace generously for focus. Cite sources subtly in footers.
Align with 2025 AI analytics trends for forward-thinking appeal. Rehearse builds for timing perfection.
Ingenious Chart Innovations
Layer with shapes for hybrid visuals or export to Motion for animated exports. A tech startup charted user growth, securing funding through vivid projections.
Integrate with widgets for dashboard-like slides, enhancing interactivity.
Launch Your Data Story
View additional chart resources and begin visualizing victory.
Frequently Asked Questions
In 1,000 words of expert guidance, harness these charts for unparalleled performance presentations.