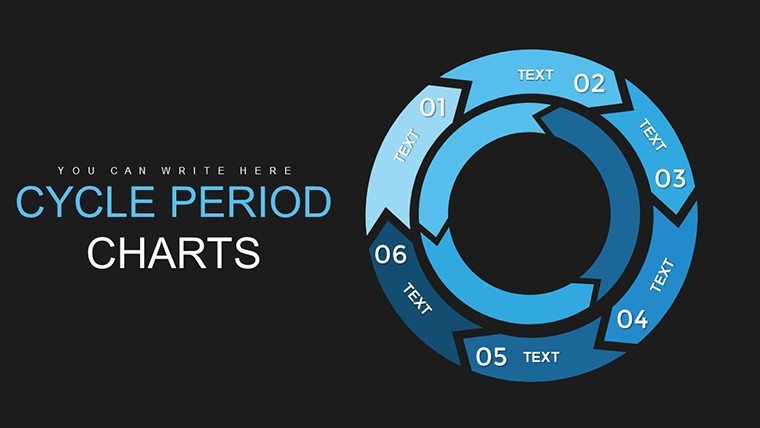
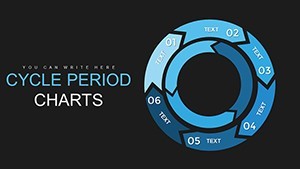
Dynamic Cycle Keynote Charts Template: Versatile Visuals for Impact


Type: Keynote Charts template
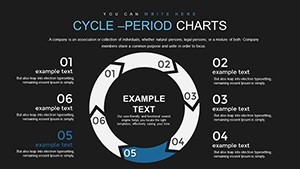
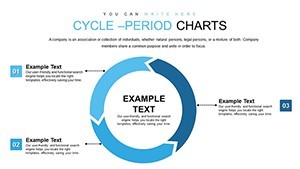
Category: Cycle
Sources Available: .key
Product ID: KC00759
Template incl.: 20 editable slides
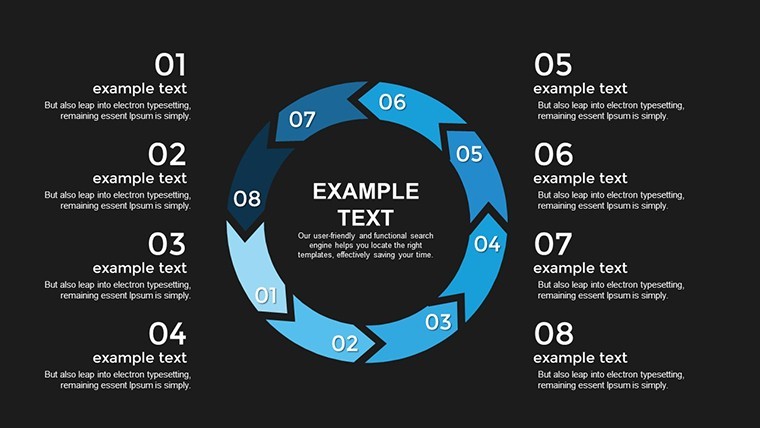
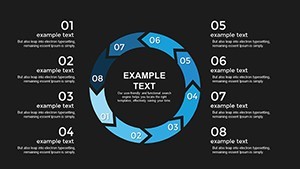
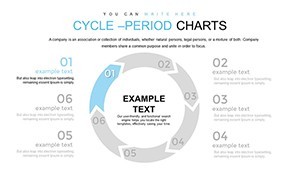
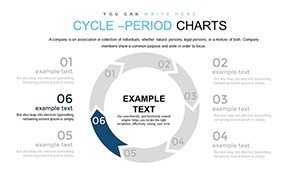
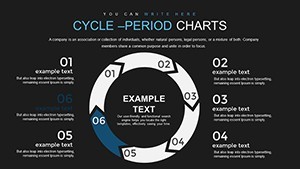
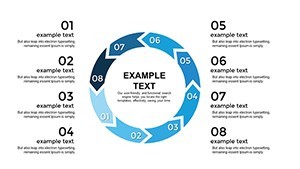
When presentations demand dynamism, our Cycle Keynote Charts Template steps up with 20 editable slides that blend sleek design and functional charts. Aimed at marketers, educators, and project managers, this $18 gem turns abstract cycles into tangible insights. From pie charts slicing market shares to flowcharts mapping project phases, it's your shortcut to professional polish. In a world where attention spans are short, these visuals keep eyes glued, inspired by UX principles from Nielsen Norman Group studies showing 25% higher retention with well-designed cycles.
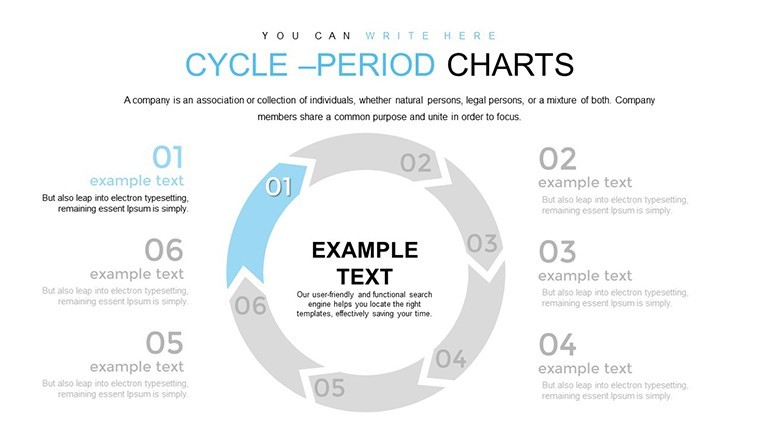
The template's vibrant yet balanced palette ensures readability, while smooth transitions maintain flow. Compatible with Keynote's ecosystem, it's ready for immediate use in diverse settings.
Essential Features That Set the Pace
Built for adaptability, each slide incorporates modern elements like responsive layouts that adjust to content volume. Per design experts at Adobe, such flexibility prevents common pitfalls like overcrowded visuals.
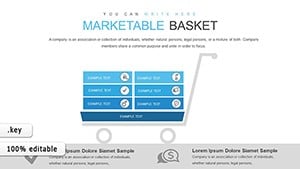
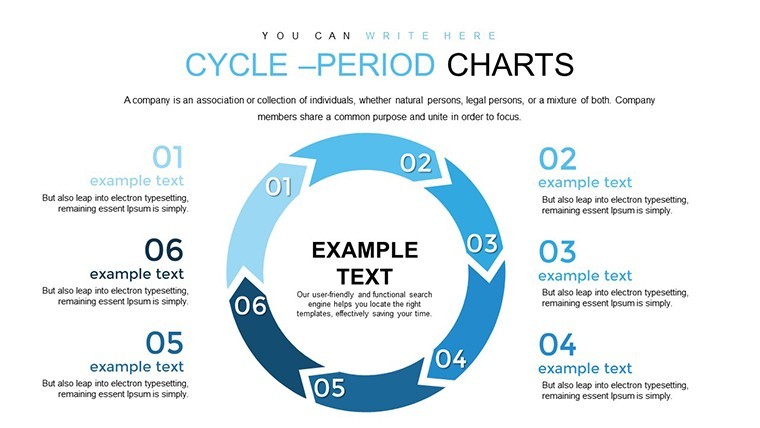
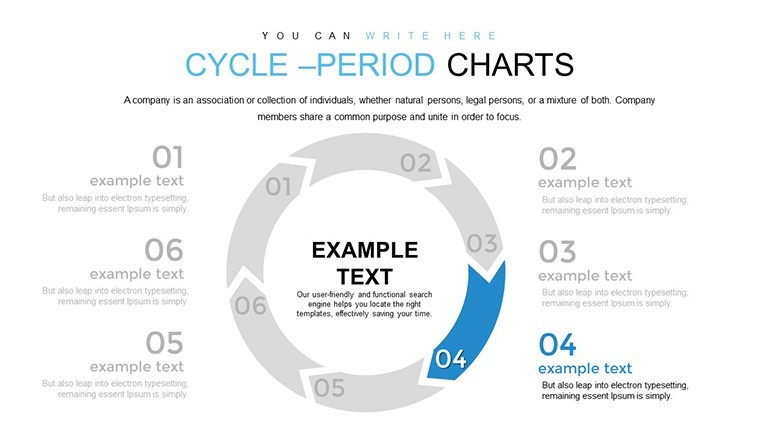
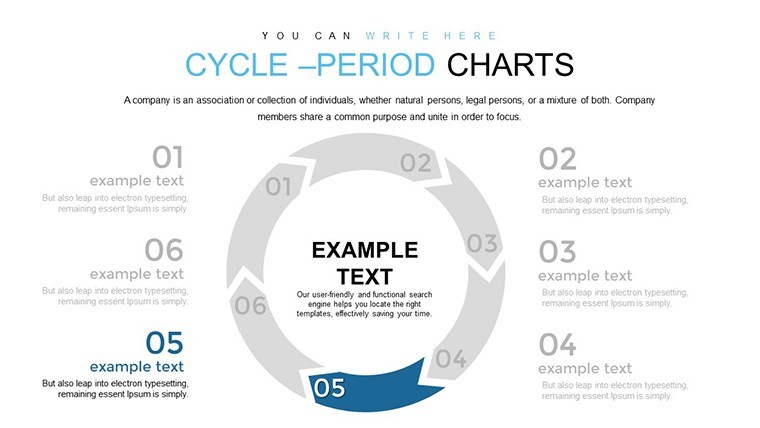
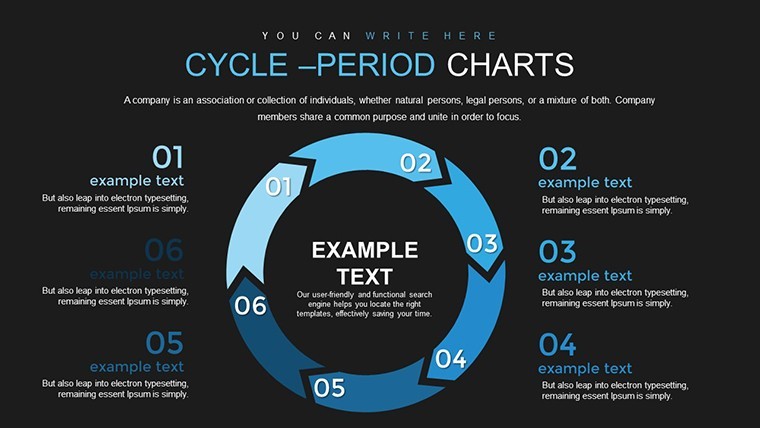
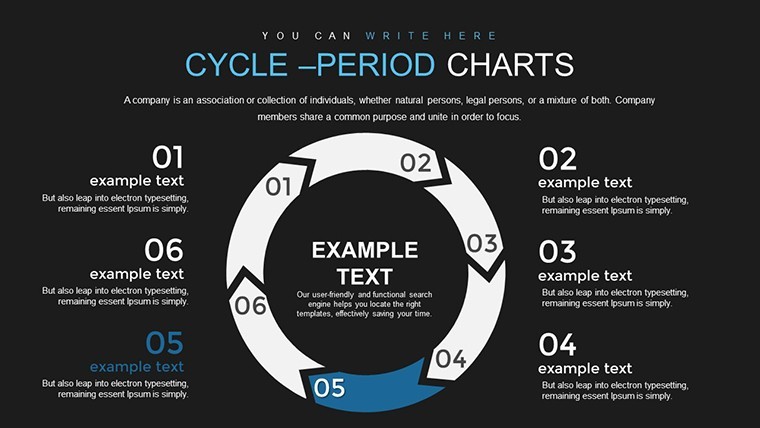
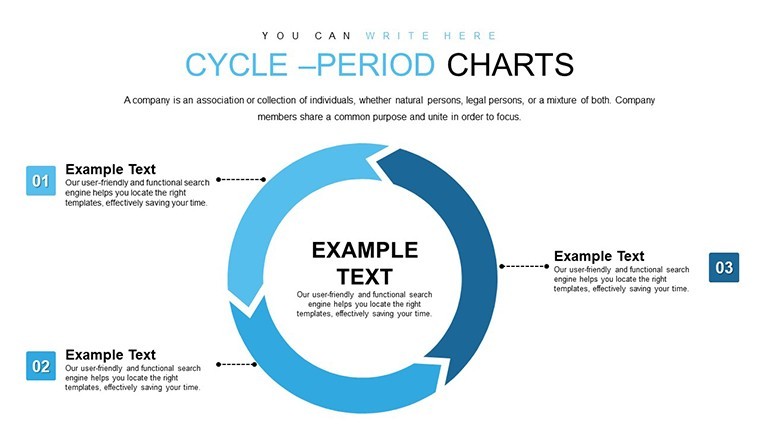
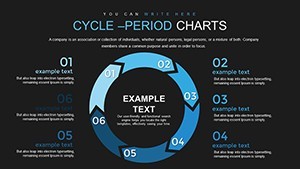
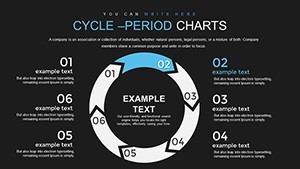
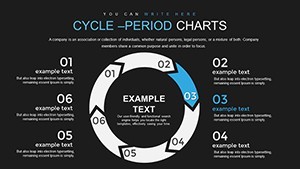
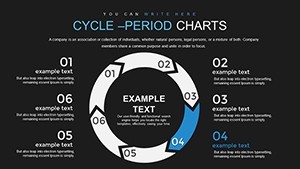
- Pie and Cycle Diagrams: Ideal for proportional data, like budget allocations in annual reviews.
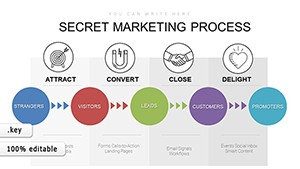
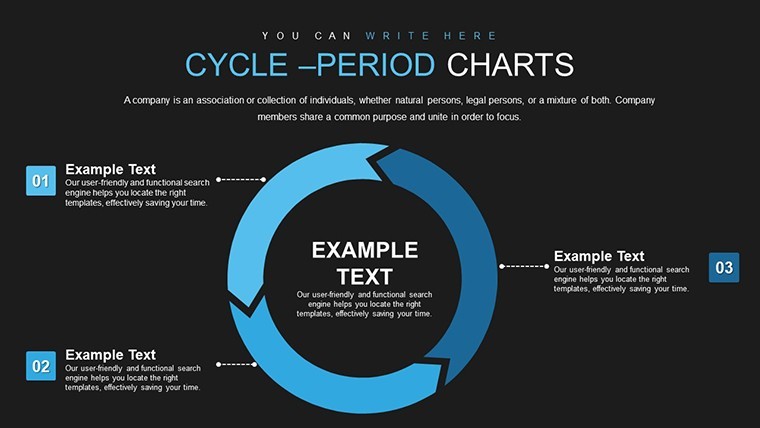
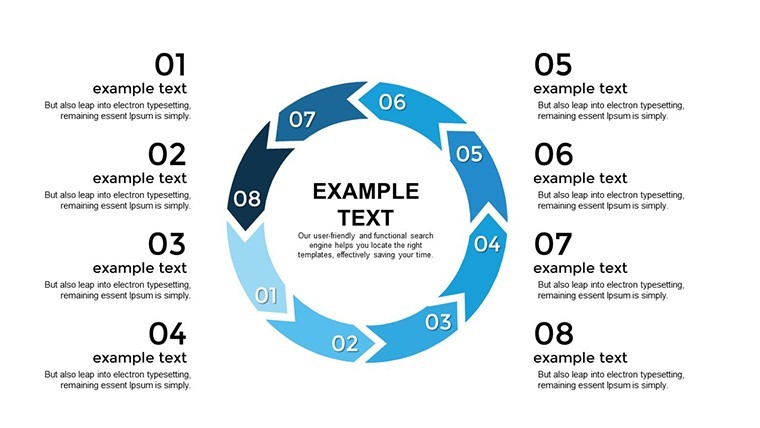
- Flowchart Integrations: Sequence steps in processes, such as product development lifecycles.
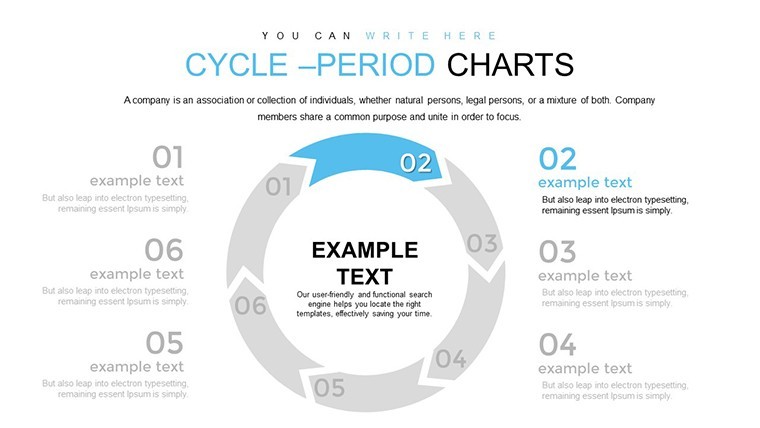
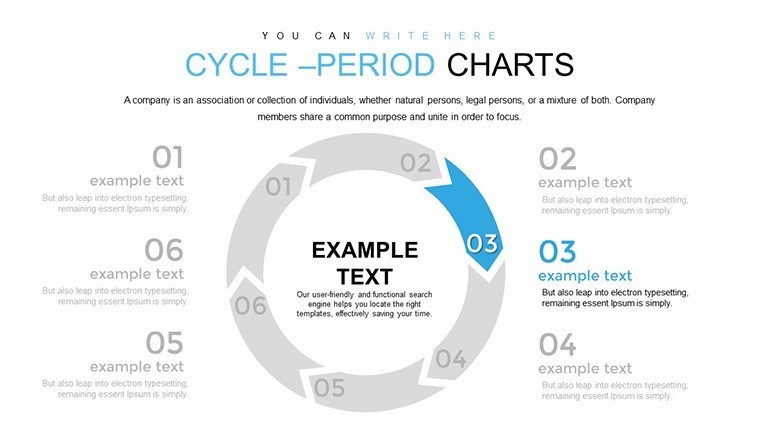
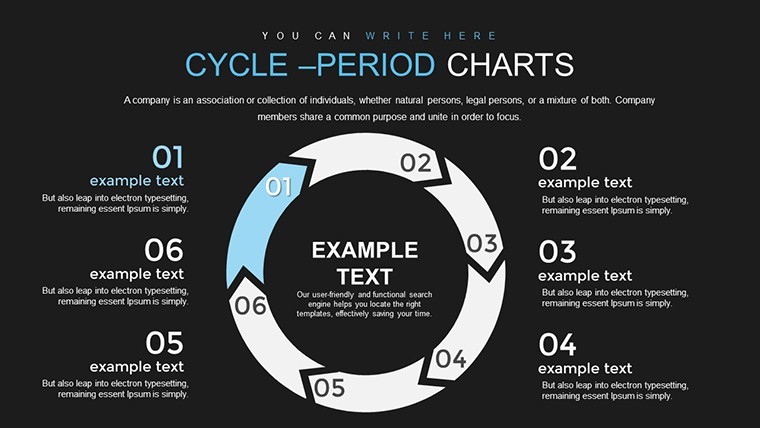
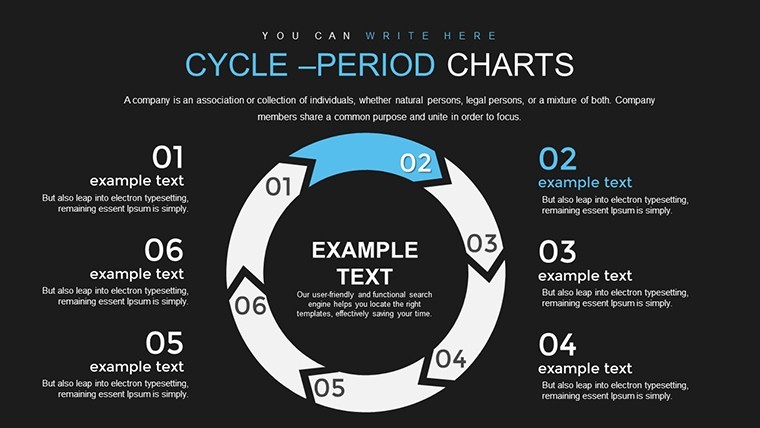
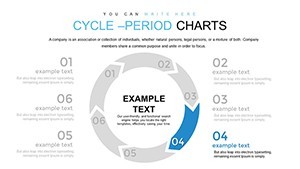
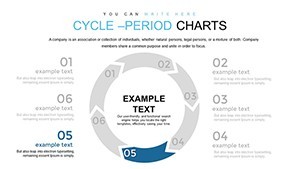
- Color-Coded Transitions: Enhance narrative build-up, revealing cycles stage by stage.
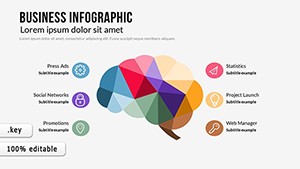
- Icon Library: 40+ thematic icons for quick embellishments, from timelines to metrics.
- Resolution Independence: Vector graphics for crisp displays on any screen size.
Case in point: A marketing team at a tech startup used similar templates to pitch investors, securing funding by clearly cycling through growth projections, as detailed in a Forbes startup feature.
Tailored Applications Across Professions
For project managers, visualize agile sprints in cycles, aligning with PMBOK guidelines for iterative planning. Customize to show dependencies, reducing project delays through better team alignment.
Educators can demystify concepts like historical events or scientific processes, using the charts to cycle through eras or reactions, fostering interactive classroom discussions.
Marketers thrive with it for campaign overviews, flowing from strategy to execution and analysis. Integrate social media metrics to demonstrate ROI cycles effectively.
Efficient Usage Workflow
- Select and duplicate a core cycle slide.
- Input data via smart placeholders; auto-adjust layouts.
- Apply custom colors and fonts for brand consistency.
- Add builds and transitions for engaging delivery.
- Test on multiple devices before finalizing.
Pro advice: Use Keynote's magic move for seamless cycle evolutions, adding a wow factor without extra effort.
Edge Over Generic Alternatives
This template surpasses built-in options with pre-optimized cycles for complex data, saving design hours and ensuring pro-level output.
Transform Slides Into Stories
Don't just present - persuade. Download this cycle powerhouse and cycle through success.
Frequently Asked Questions
- How versatile are the chart types?
- Includes pies, flows, and cycles, adaptable to any data set.
- Compatible with iPad Keynote?
- Yes, fully functional on mobile versions.
- Can I collaborate in real-time?
- Leverage iCloud for team edits.
- What if my data changes frequently?
- Easy updates keep slides current.
- Are there color-blind friendly options?
- Yes, adjustable palettes for accessibility.