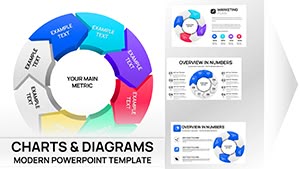
Immerse yourself in Keynote chart templates that blend artistry with analytics, making data dance across your slides. Tailored for everything from financial overviews to performance trackers, these designs demystify numbers with style.
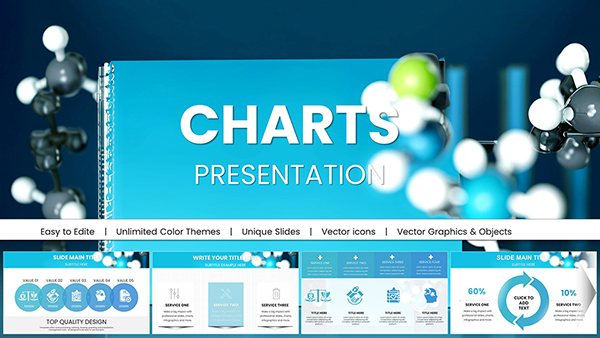
Perfect for data enthusiasts, presenters, and decision-makers, they offer plug-and-play convenience with room for flair. Input stats, tweak aesthetics, and deliver messages that stick.
Our category showcases charts optimized for Keynote`s ecosystem - think fluid animations and device-agnostic rendering. From startup metrics to academic findings, find the visual voice for your data. Launch into creation mode now.
Superiority lies in native integration: charts scale flawlessly with Keynote themes, evading the pixelation of imported graphics. Basic charts feel flat; these pulse with potential.
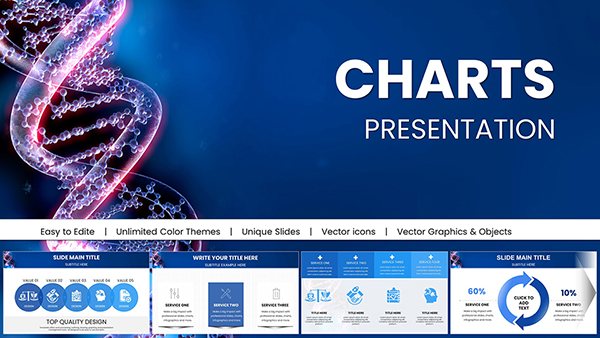
CEOs spotlight KPIs with gauge charts. Scientists plot experiments via box plots. Influencers chart audience growth with spark lines.
Efficiency boost: Instant data binding cuts manual plotting.
Pro Strategies for Chart Impact
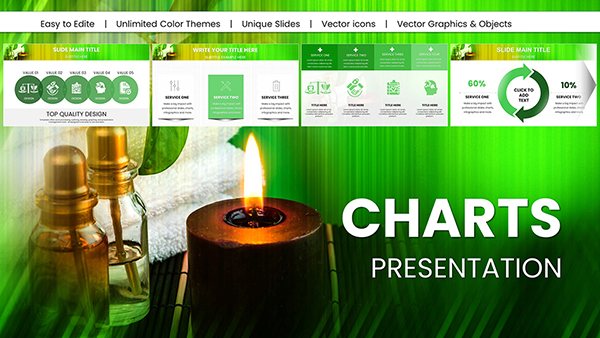
Curate palettes for emotion - warm tones for positives, cools for cautions. Cap series at seven for memory limits. Animate slices to unfold insights gradually.
Genius move: Embed formulas for live calculations during edits. Ensure WCAG compliance with descriptive titles.
Quick Setup Steps
Paste data from Numbers.
Style via format sidebar.
Add build effects.
Rehearse timing.
Visualize victory - grab a chart and chart your course.
Stories of Chart Success
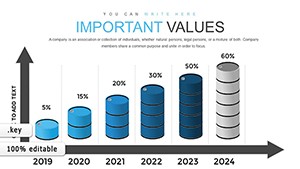
A venture pitch with our sunburst chart illuminated revenue layers, clinching deals. A teacher`s column chart gamified math, sparking interest.
Export-ready for keynotes or key visuals in docs.
Chart Spectrum
Chart
Focus
Edge
Gauge
Metrics
Dial Precision
Treemap
Hierarchies
Space Efficiency
Heatmap
Patterns
Color Coding
Diverse toolkit for any data tale.
Capture essence - download instantly.
Frequently Asked Questions
Charting Advanced Paths
Fuse charts with shapes for hybrid infographics. Use shadows sparingly for dimension. Aim for `aha` moments through contrast.
Collaborate via shared links; iterate with comments.
Keynote chart templates illuminate data`s drama. Shine on.