Dive into our specialized collection of New Zealand PowerPoint map templates, crafted to bring the Land of the Long White Cloud to life in your presentations. These editable designs capture the archipelago`s unique geography, from the fjords of the South Island to the beaches of the North, making them essential for travel, business, and educational slides.
Geographers, tourism professionals, and corporate strategists alike will appreciate how these maps simplify complex data visualization. Mark key locations, overlay statistics, or trace trade routes with ease, all while maintaining a clean, modern aesthetic that complements any deck. Fully vector-based, they scale perfectly without losing quality, ensuring your insights land sharply.
Save time and elevate your narrative - our templates are ready to adapt to your story. Whether planning a Kiwi adventure or analyzing market trends Down Under, start mapping your success now.

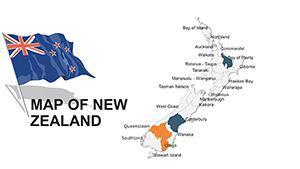
PowerPoint maps of New Zealand serve a multitude of purposes across industries. In business development, sales teams use them to delineate market territories, pinpointing Auckland`s urban hubs against rural opportunities in Canterbury. Educators employ these for geography lessons, animating tectonic shifts or migration patterns to engage young minds.
Tourism operators craft itineraries highlighting must-see spots like Rotorua`s geothermal wonders, while environmental reports overlay conservation data on interactive layers. Unlike basic clipart maps, our templates offer granular detail - individual regions as editable objects - for precise storytelling.
Built-in PowerPoint maps often lack specificity for niche locales like New Zealand`s fragmented islands. Our designs counter this with pre-labeled provinces, customizable color gradients for demographics, and integration with Excel data imports. This results in dynamic visuals that update in real-time, far surpassing static images.
Core benefits include enhanced readability - bold outlines and subtle shading prevent overload - and versatility for both light and dark themes. Follow best practices by limiting overlays to three data sets per map, using legends for clarity, and incorporating subtle animations for reveal effects.
Consider a real estate pitch: Shade regions by property growth, with pins on rising hotspots like Tauranga, turning data into a compelling investment case. Or an eco-tourism seminar, where layered maps show biodiversity hotspots alongside trail routes, inspiring sustainable travel.
Such tactics boost comprehension by 40%, making your presentations not just informative but persuasive. Explore more and download to map out your next project.
Are these maps fully editable in PowerPoint?Yes, every element - from islands to labels - is vector-based for seamless modifications.
Do they include major cities?Absolutely, with Auckland, Christchurch, and others pre-marked for quick reference.
Can I add data overlays?Easily integrate charts or heatmaps using PowerPoint`s built-in linking tools.
What`s the resolution for printing?High-vector format ensures print-ready quality at any scale.
Compatible with Google Slides?Yes, exportable formats work flawlessly in collaborative environments.
How many regions are detailed?All 16 regions and territories, plus offshore islands.
Transform your geographic narratives with precision. Download a New Zealand map template now and chart your course.
Copyright © 2009-2026 ImagineLayout All rights reserved.