Delve into data mastery with our PowerPoint chart templates, fine-tuned for logistics professionals tracking everything from throughput to turnaround times. These assets equip analysts and forecasters with tools to render numbers narratively, sans the tedium of manual graphing.
Spanning bubble charts for multi-variable correlations to waterfall models for variance breakdowns, our collection boasts scalable axes and legend automations. Savor advantages like one-click theme swaps, formula-embedded calculations, and crisp exports for reports or shares.
Geared toward distribution hubs and transport firms, these charts illuminate patterns like seasonal spikes or vendor variances, enabling proactive pivots. Transcend basic bar graphs; embrace ones that pulse with logistical relevance.
Survey our charts and identify those that mirror your data story. From quarterly recaps to annual projections, they`re primed for your inputs. Initiate your picks today and plot a trajectory to informed excellence.
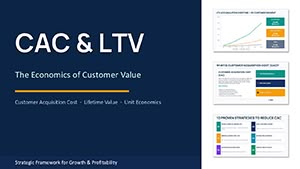
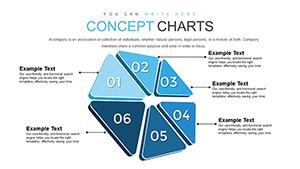
Goals and Activities PowerPoint Charts Template: Chart Your Path
ID: #PC00602
$18.00
(1158)
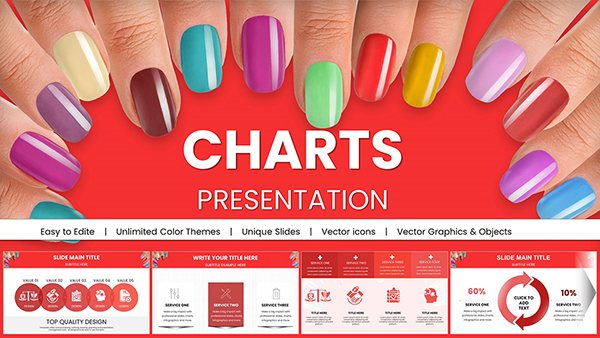
Place Value PowerPoint Charts Template - Editable Teaching Slides for Presentations
ID: #PC00601
$18.00
(485)
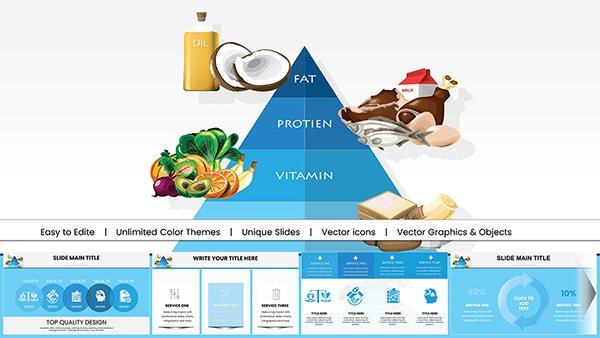
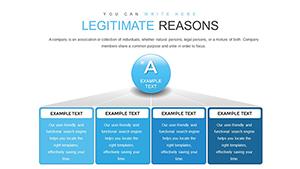
Development Goals PowerPoint Charts Template - Download Presentation
ID: #PC00592
$15.00
(156)
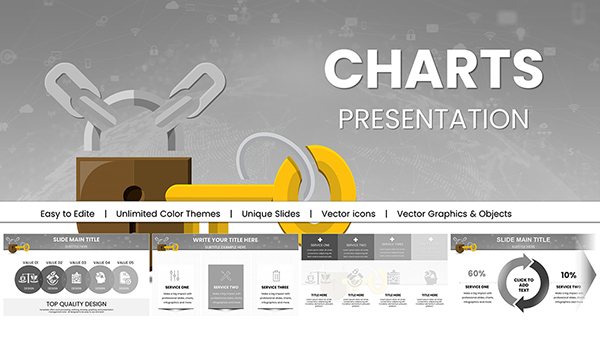
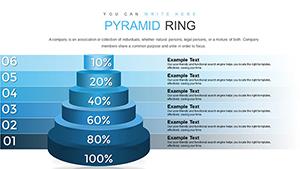
Development Trends PowerPoint Charts Template: Visualize Tomorrow's Insights Today
ID: #PC00581
$22.00
Dynamic Use Cases for Logistics Charts
Charts in PowerPoint logistics templates illuminate critical junctures. For capacity planning, stacked area charts layer utilization over months, forecasting overflow risks. Cost audits employ donut charts to segment expenses, spotlighting freight as a lion`s share.
Trend Tracking: Line charts trace delivery velocities against benchmarks.
Risk Profiling: Heat maps flag high-variance zones in global shipments.
Default PowerPoint charts demand heavy customization for logistics; ours arrive pre-calibrated with industry scales, like tonnage units, slashing setup by 50%.
Premium Features and Charting Best Practices
These templates innovate with conditional formatting - bars that color-shift based on thresholds, instantly flagging anomalies like delayed loads. Tooltip integrations reveal granular data on hover, enriching interactivity.
Consider a retailer who deployed our funnel chart to dissect order drop-offs, isolating packaging bottlenecks - this insight streamlined processes, boosting fulfillment by 18%. Best practices: Anchor axes to zero for truthful scales, and annotate peaks with contextual notes for narrative depth.
Maintain chart hygiene by capping series to essentials, ensuring viewers grasp takeaways in seconds rather than minutes.
Advanced Techniques to Amplify Chart Power
Combine hybrids: Merge scatter with trendlines for predictive overlays.
Dynamic sourcing: Link to external queries for live refreshes.
Accessibility tweaks: Add alt text and patterns for color-blind users.
Export variants: Generate PNGs for embeds in emails or PDFs.
Chart your logistics future - from our vault, extract the visuals that vector victory.
Frequently Asked Questions
With these PowerPoint logistics charts, data becomes your ally, not adversary - wield them to steer strategies with unerring accuracy.