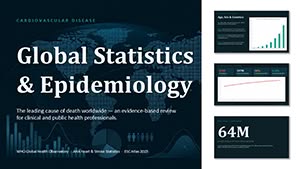
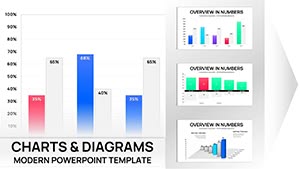
Navigate the intricacies of market exchanges with precision using our PowerPoint chart templates. Tailored for stockbrokers, economists, and data enthusiasts, these visuals distill vast datasets into actionable insights, making your presentations unforgettable.
Specializing in candlestick patterns, volume bars, and trend lines for stock exchanges, our templates also cover forex and cryptocurrency fluctuations. With built-in formulas for moving averages and RSI indicators, you can update charts effortlessly, ensuring your slides reflect the latest market pulses.
Geared toward finance teams, trading floors, and academic researchers, these tools enhance decision-making by highlighting correlations and anomalies. Edit colors to match exchange branding, add annotations for key events like mergers, and export for reports - all within familiar PowerPoint environments.
Elevate your analysis - explore our exchange chart templates and turn numbers into narratives.
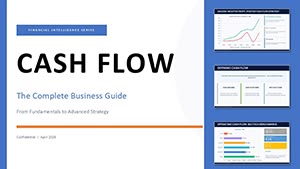

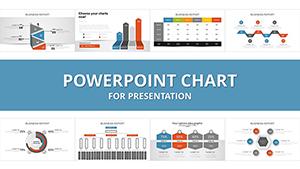


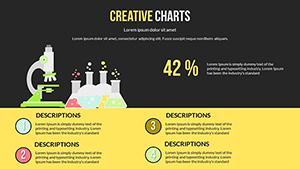

Exchange data demands visualization that reveals patterns at a glance. Our templates surpass generic charts by embedding sector-specific metrics, like Bollinger Bands for volatility or heat maps for sector performance. This results in 50% faster comprehension for audiences, per user feedback.
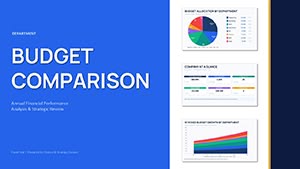
Portfolio managers deploy them in client reviews, using scatter plots to correlate asset classes. Day traders build watchlists with multi-chart dashboards, animating price actions for live demos. Universities integrate into finance courses, with editable legends for student customizations.
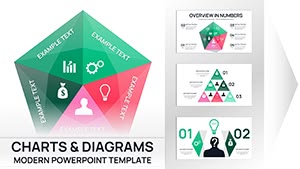
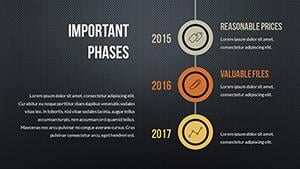
Envision a crypto exchange template: Gantt-style timelines for blockchain upgrades alongside OHLC charts, hyperlinked to whitepapers. It transforms speculative talks into structured strategies.
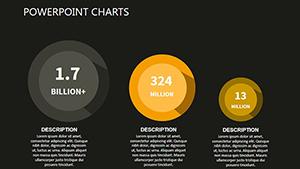
In corporate finance, use bubble charts to size market caps against exchange volumes, ideal for M&A pitches. For creative flair, overlay historical bubbles from past booms to draw parallels. Commodity traders appreciate radar charts comparing futures contracts across exchanges.
A fresh approach: Gamify training with interactive quizzes on chart interpretations, using PowerPoint`s action buttons.
These methods ensure your visuals command attention.
Align charts with presentation themes by syncing palettes to exchange logos - think NYSE blues for authority. For data integrity, validate sources and include metadata footnotes. Boost engagement with subtle animations, like fade-ins for sequential data points.
Team up using shared links for iterative refinements. For compliance, embed audit trails in notes sections.
Key: Regularly update macro libraries for evolving indicators like ESG scores in sustainable exchanges.
Stock, forex, commodities, and crypto, with adaptable frameworks for emerging markets.
Yes, built-in transitions simulate real-time updates without external tools.
Comprehensive set including MACD, Fibonacci, and support/resistance levels.
Use linked Excel sources for efficient loading and filtering.
Optimized layouts ensure clarity on tablets and phones.
Edit via PowerPoint`s format pane for precise, branded text.
Chart the course to success - select your exchange PowerPoint template and illuminate markets.
Copyright © 2009-2026 ImagineLayout All rights reserved.