Bring geography and data to the forefront of your PowerPoint presentations with our continent maps templates. These versatile designs cover the globe`s major landmasses, from the vast expanses of Asia to the diverse terrains of Africa, enabling you to illustrate everything from climate patterns to international trade.
Tailored for business leaders plotting expansion strategies, teachers delivering engaging geography units, and journalists mapping current events, these templates provide a foundation for compelling narratives. With editable vectors, you can tweak boundaries, add annotations, or integrate multimedia elements without hassle.
Move beyond static images - our maps are built for interactivity, supporting hyperlinks and transitions that make your deck come alive. Dive into our library and select templates that align with your vision, ensuring every presentation leaves a lasting impression.

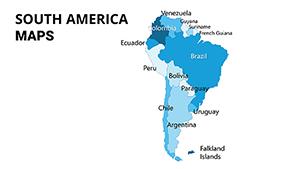
Continent maps aren`t just visuals; they`re essential for contextualizing information in a interconnected world. Our PowerPoint templates empower users to layer stories onto geographic canvases, making abstract data relatable and memorable. Whether highlighting economic hubs in Europe or biodiversity hotspots in South America, these slides facilitate deeper audience connections.
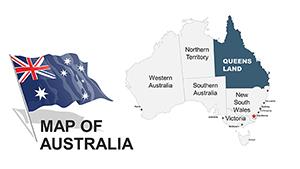
Professionals in consulting firms use them to forecast market trends, while environmental activists map conservation efforts across Oceania. The result? Presentations that inform, persuade, and inspire action.
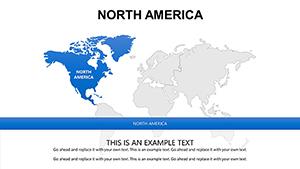
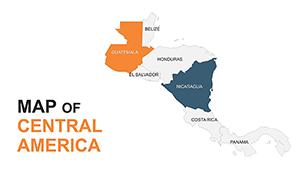
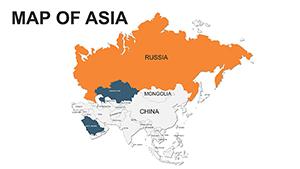
In corporate settings, sales teams leverage North America continent maps to showcase regional performance metrics, turning numbers into visual journeys. Educators, on the other hand, create interactive quizzes by hiding country names on Asia maps, promoting active learning.
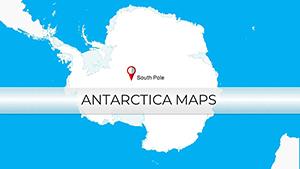
Compared to built-in PowerPoint shapes, which demand time-consuming alignments, our templates arrive pre-formatted, allowing focus on content over design. Travel bloggers enhance blogs-turned-presentations with Antarctica maps detailing expedition routes, captivating followers with vivid details.
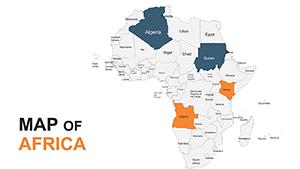
Non-profits track project impacts across Africa, using color-coded segments to demonstrate progress. Media outlets visualize election results on Europe maps, with animated updates for live demos. To maximize impact, incorporate tooltips for extra data and ensure accessibility with high-contrast modes.
Our designs support these by including placeholder text boxes and icon libraries, streamlining your workflow.
Standard PowerPoint maps often appear dated and lack nuance, like uniform shading that ignores topographical variations. Our versions offer layered details - rivers, mountains, urban centers - customizable to your needs. Feedback from users highlights 50% less editing time and more engaging sessions.
This approach guarantees professional outcomes every time.
Don`t settle for ordinary - explore our continent maps and download the ones that spark ideas. Transform your PowerPoint into a window on the world today.
Copyright © 2009-2026 ImagineLayout All rights reserved.