Assemble your vision with constructor Keynote charts templates, tailored for the building industry to chart progress, budgets, and blueprints. These dynamic visuals turn numbers into narratives, leveraging Keynote`s prowess for seamless construction storytelling.
Suited for architects, contractors, and project managers, they promise accuracy and allure. Advantages: Scalable vectors for site-to-boardroom scalability, intuitive drag edits, and thematic icons like hard hats and girders that ground data in reality. Elevate reports from rote to riveting.
Discover all constructor charts in our category and lay the foundation for standout slides.
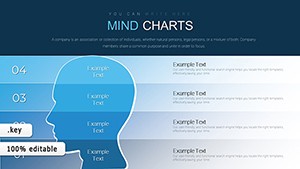
32 Mind Maps in Keynote - Fully Editable | ImagineLayout
ID: #KC00657
$20.00
(691)
Importance of Choice Keynote Charts Template: Visualize Decisions Dynamically
ID: #KC00600
$20.00
(842)
Factors Affecting Recovery Keynote Charts: Analyze and Strategize
ID: #KC00566
$21.00
(518)
Factors of Personality Development Keynote Charts: Inspire Personal Growth
ID: #KC00558
$15.00
(1200)
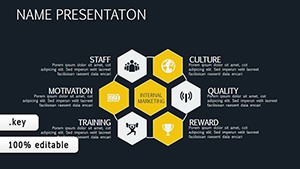
Social Network Marketing Keynote Charts Template
ID: #KC00551
$18.00
(643)
Alternative Solutions Keynote Charts Template: Innovate Your Decision Processes
ID: #KC00531
$23.00
(643)
Animated Keynote Charts: Dynamic Presentations
ID: #KC00504
$20.00
(1155)
Animated Interactive Keynote Charts: Unlock Dynamic Data Storytelling
ID: #KC00477
$16.00
(486)
Market Development Charts: Animate Growth Strategies
ID: #KC00449
$18.00
(1167)
Customer Loyalty Keynote Charts: Forge Unbreakable Bonds with Data
ID: #KC00426
$20.00
(418)
User Experience Keynote Charts: Bridging the Digital Divide
ID: #KC00404
$12.00
(710)
Human Factors Psychology Keynote Charts Template
ID: #KC00389
$16.00
(108)
Best Choice Download Keynote Charts: Curate Ideas That Click
ID: #KC00379
$16.00
(912)
Social Relationships Keynote Charts: Mapping Human Dynamics
ID: #KC00377
$15.00
(926)
Estimation Edge: Versatile Keynote Venn Charts
ID: #KC00366
$14.00
(276)
Social Networks Tables Keynote: Weaving Connections into Compelling Visuals
ID: #KC00347
$14.00
Harnessing Constructor Keynote Charts for Project Success
Construction demands detail, and our Keynote charts templates deliver with precision-engineered layouts - Gantt bars mimicking timelines, pie charts as material breakdowns. They eclipse plain charts by embedding industry lingo and safety motifs, fostering trust at first glance.
Envision a cost overrun chart with phased alerts; teams pivot faster. Pros laud the efficiency, slashing chart creation from days to minutes. Practice: Align axes to real scales for authentic projections.
Use Cases in Construction Workflows
Site Progress Tracking: Bar graphs for milestone hits with photo overlays.
Budget Allocations: Donut visuals dissecting labor vs. supplies.
Risk Assessments: Heat maps flagging delays via color gradients.
Foundation first: Select chart types matching data - lines for trends, scatters for correlations. Animate builds for sequential reveals. A builder`s blueprint template visualized phased pours, averting overruns through stakeholder clarity.
Versatile for mobile reviews on job sites.
Ready to blueprint brilliance? Explore and erect your ideal chart set.
Constructor Charts: Built Strong vs. Fragile Defaults
Quality
Our Charts
Standard
Detail Level
Industry-Specific
Generic
Adaptability
Vector-Scalable
Pixel-Limited
Clarity
Icon-Enhanced
Text-Only
Sturdy designs withstand scrutiny.
Frequently Asked Questions
Extend to sustainability metrics: Carbon footprint radars or energy efficiency lines. Managers use them for bid proposals, graphing ROI curves that seal contracts.
Tip: Overlay weather icons on timelines for holistic views. In a high-rise project, this foresight dodged delays, saving thousands.
Pro Tips for Chart Mastery
Validate data sources pre-insertion for accuracy.
Annotate peaks with callouts for narrative punch.
Version control via duplicates for scenario what-ifs.
Accessibility: Contrast checks for color-blind teams.
Raves abound: "Charts that build trust - literally!" Affirming their foundational role.
Lay your data`s groundwork: Download and construct clarity now.