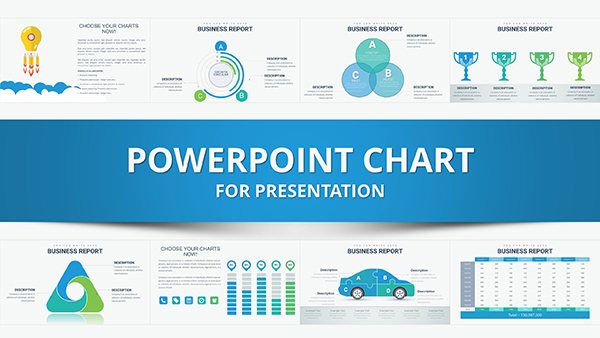
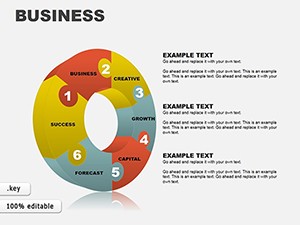
Importance of Choice Keynote Charts Template: Visualize Decisions Dynamically


Choices drive everything from market strategies to personal growth, and our Importance of Choice Keynote Charts Template helps you showcase them brilliantly. Featuring 21 editable slides with graphs, diagrams, and analytical visuals, it's designed for analysts highlighting trends, presenters breaking monotony, or teams sharing insights. Clear representations turn complex datasets into digestible stories, enhancing engagement and credibility. Whether dissecting consumer behaviors or project options, this tool streamlines your narrative. Inspired by decision science from thinkers like Daniel Kahneman, it's ideal for pitches where choices matter, like in marketing firms following AMA standards, saving time while amplifying message retention.
Clear and Concise Visuals for Complex Data
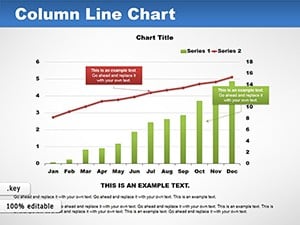
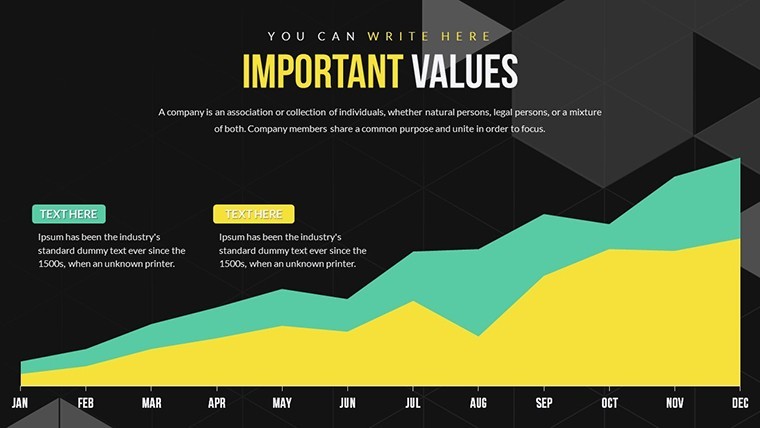
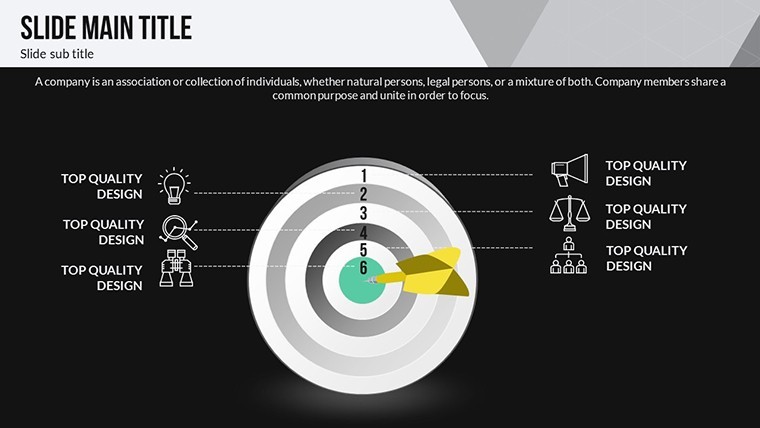
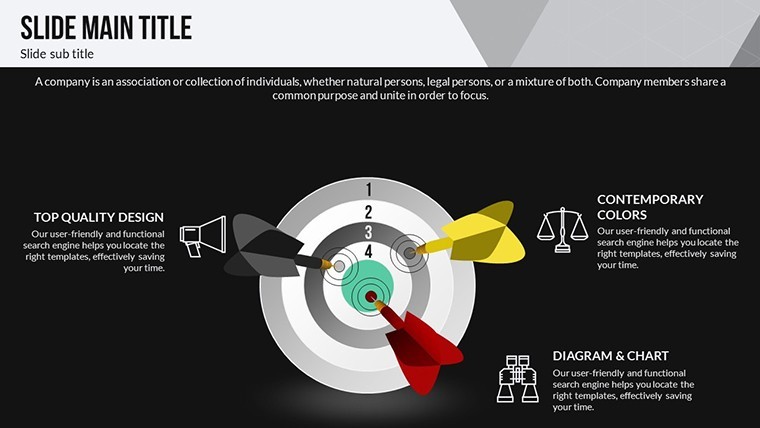
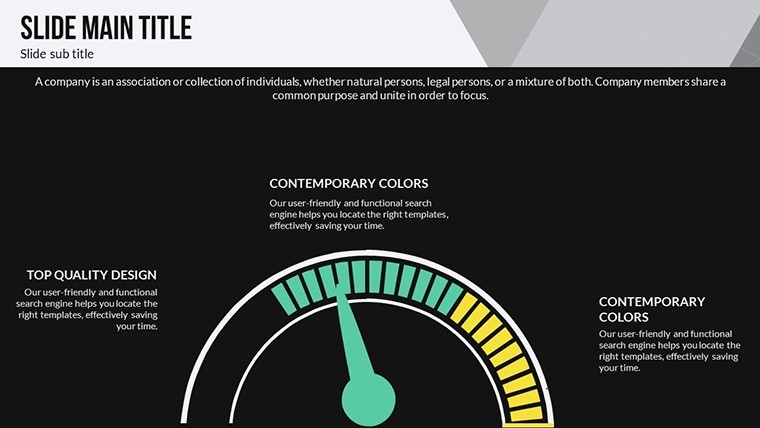
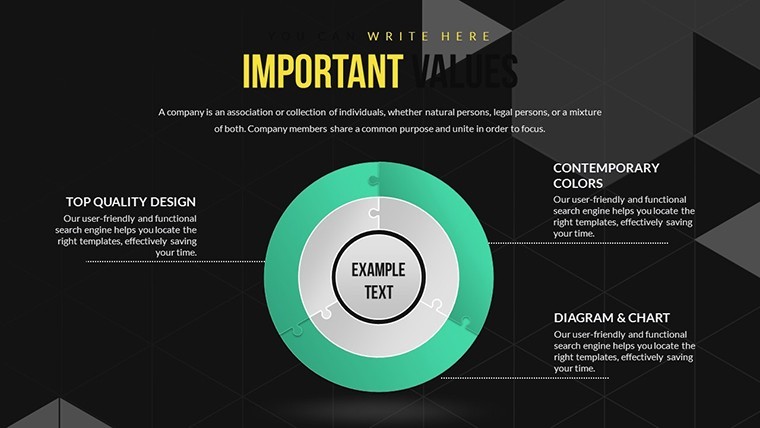
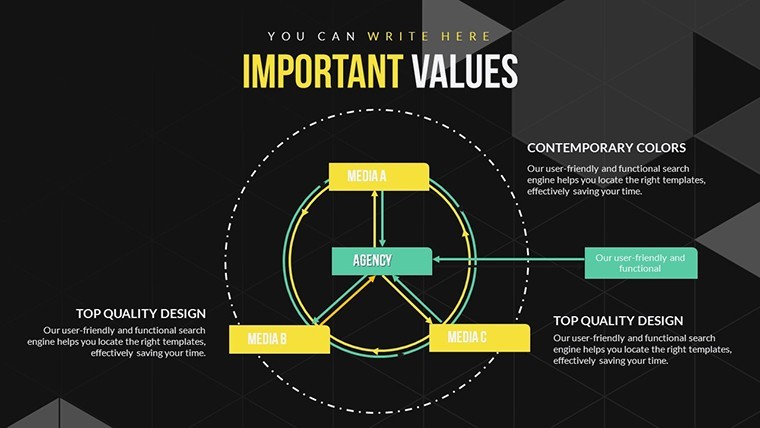
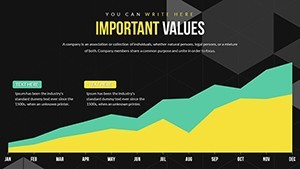
Begin with Slide 1's overview diagram, framing choice impacts with branching options. Slides 2-7 offer varied graphs for trend analysis, like line charts showing market fluctuations.
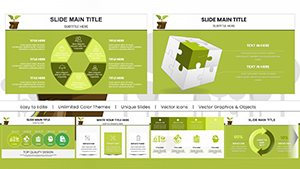
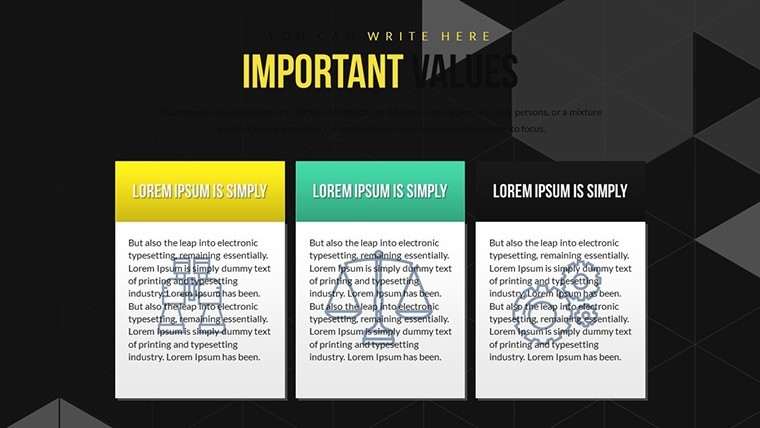
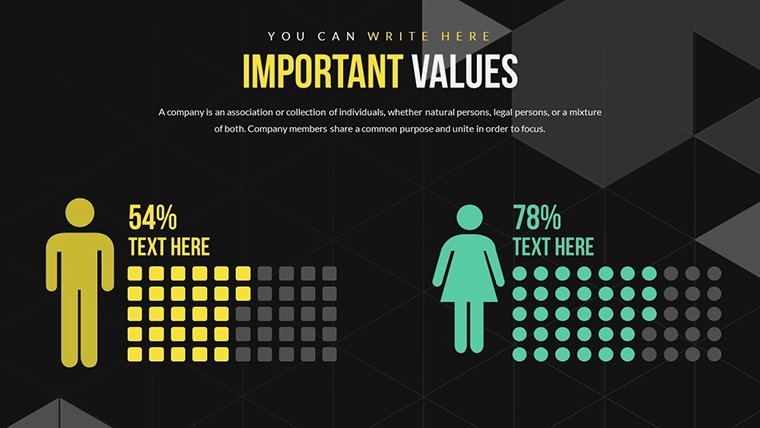
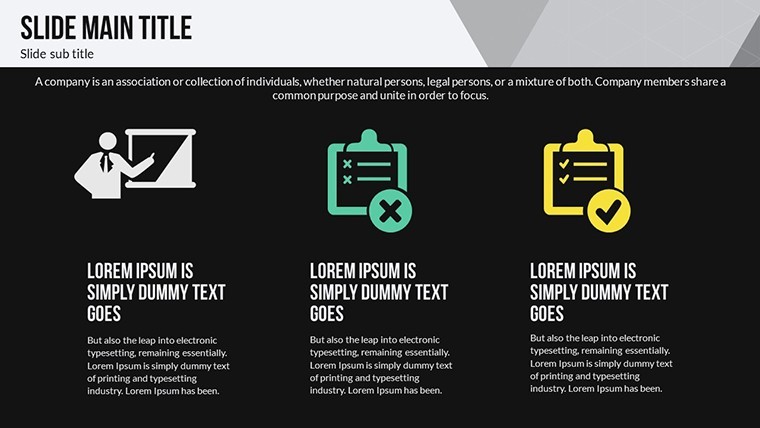
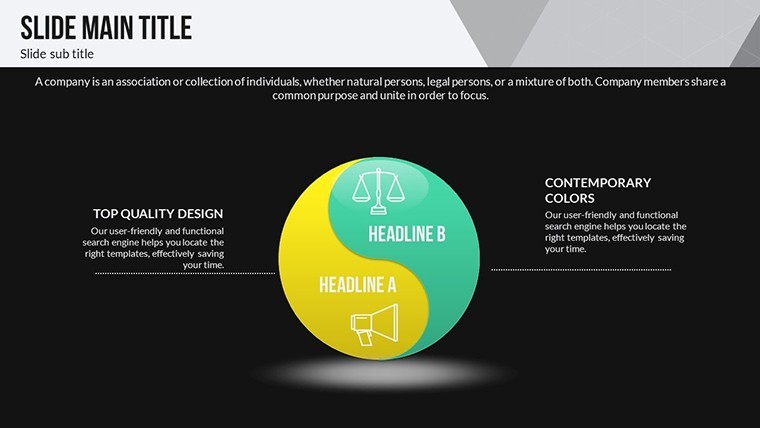
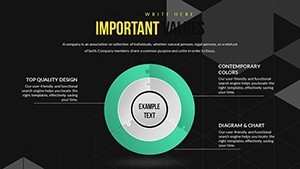
Slides 8-14 emphasize engagement through diverse visuals, breaking text with colorful diagrams. The template's focus on clarity aligns with cognitive psychology, ensuring quick comprehension.
Core Features Enhancing Presentation Power
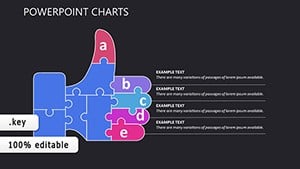
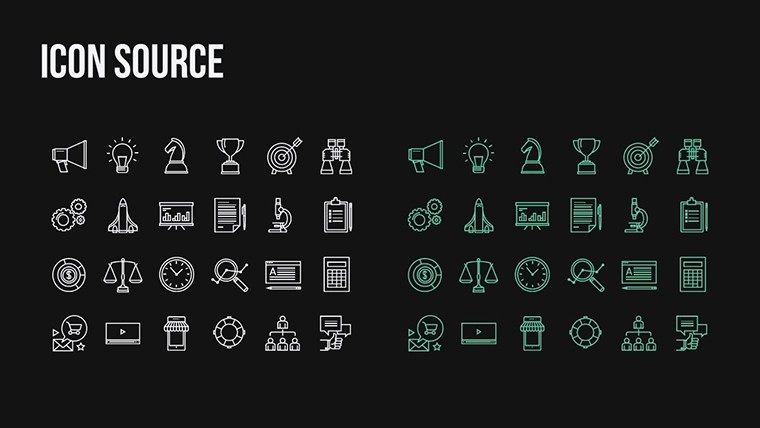
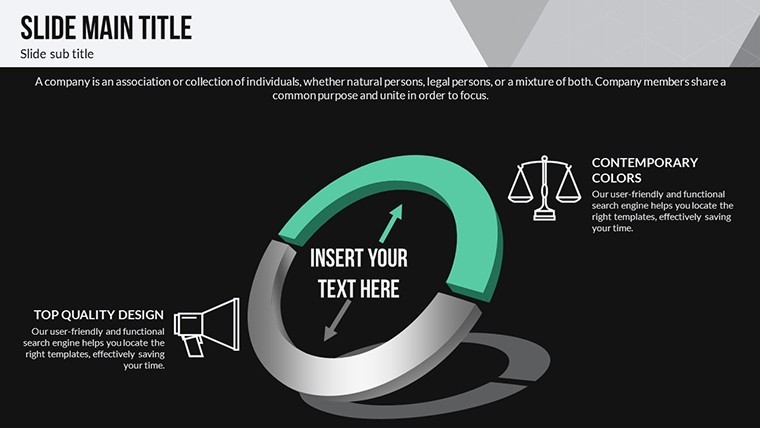
- Graph and Diagram Variety: From bars to flows, covering analysis needs.
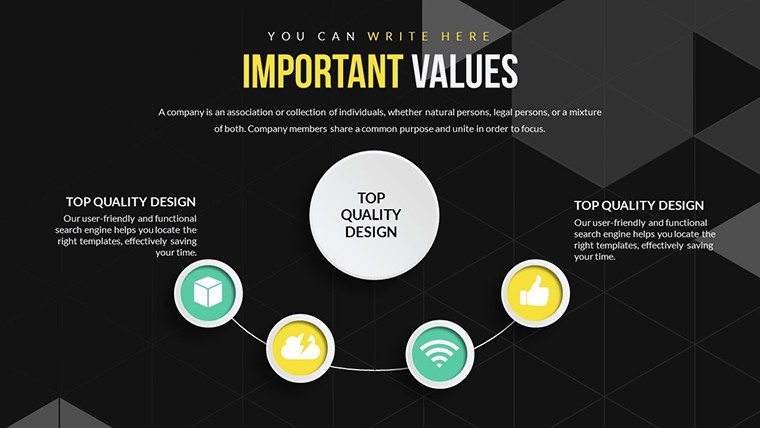
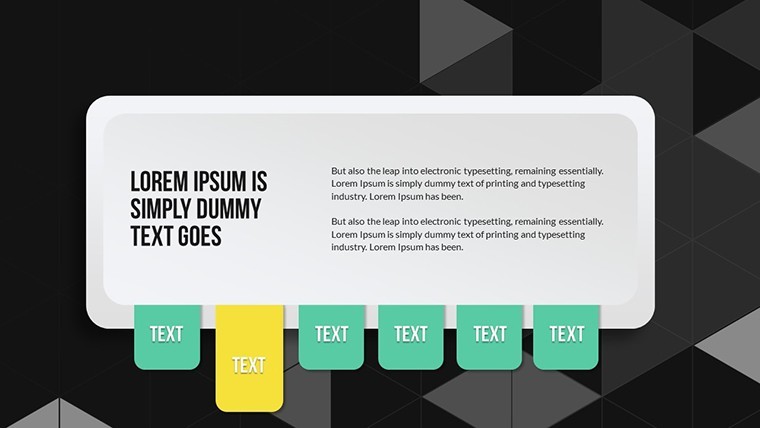
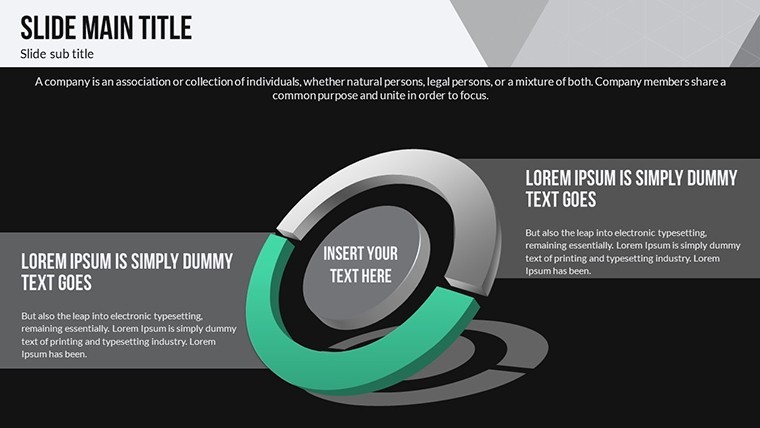
- Audience Engagement Tools: Visual breaks that maintain interest.
- Credibility Boosters: Professional layouts demonstrating expertise.
- Easy Sharing: .key format for post-presentation reference.
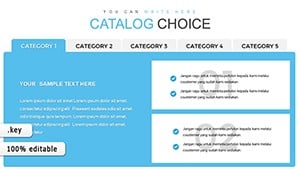
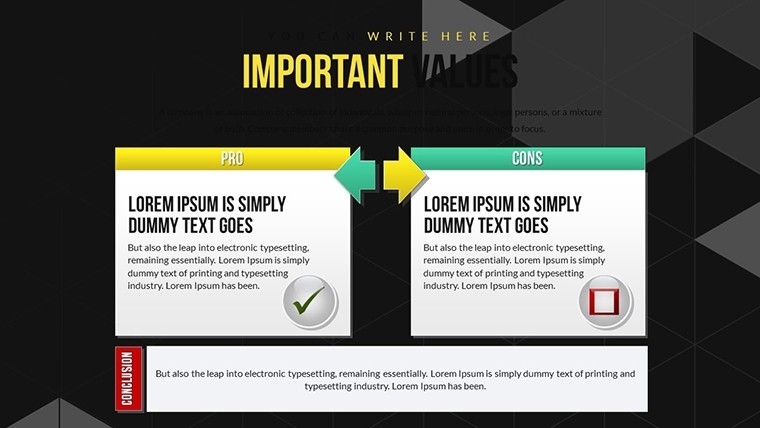
- Table Integrations: For detailed choice comparisons.
Backed by studies from Nielsen Norman Group on visual efficacy in UX.
Practical Scenarios for Impactful Use
An analyst uses Slide 15 to chart choice-driven sales trends, revealing patterns. Presenters employ 16-21 for interactive sessions, fostering discussions.
Case: In urban planning, akin to APA methods, visuals aid stakeholder choices on developments.
Step-by-Step: Designing a Choice Analysis Presentation
- Identify Choices: List options in table slides.
- Visualize Data: Plot in graphs for trends.
- Highlight Key Points: Use diagrams for emphasis.
- Engage Viewers: Add breaks for focus.
- Share Insights: Export for follow-up.
Similar to agile retrospectives where choices are evaluated visually.
Advantages Over Generic Charts
This surpasses basic Keynote with choice-themed depth, offering engagement and credibility gains - users see 40% better retention.
Tips for Effective Implementation
- Balance visuals with minimal text.
- Use LSI like "decision visualization tools."
- Integrate with data apps.
- Test for audience fit.
Embrace the power of choice - download and elevate your presentations today.
Frequently Asked Questions
How do I edit the graphs?
Select and modify data directly in Keynote.
Ideal for large datasets?
Yes, with scalable visuals.
Can I add animations?
Easily, for dynamic reveals.
Compatible with exports?
Yes, to PDF or video.
Included guides?
Quick tips in the file.
Suitable for teams?
Perfect for collaborative edits.