Transform your teaching with our specialized classroom PowerPoint chart templates, tailored for educators seeking to make lessons more interactive and insightful. From progress trackers to concept maps, these charts help visualize data in ways that resonate with students of all ages.
Designed for teachers, tutors, and school admins, they simplify complex topics like math trends or reading levels into colorful, digestible formats. Integrate polls, timelines, or hierarchies to foster active participation and deeper understanding.
Our templates are quick to adapt, ensuring you spend less time on setup and more on instruction. Peruse the gallery and select charts that align with your curriculum for immediate impact.

Classroom charts bridge abstract ideas and tangible visuals, accelerating comprehension in diverse learning environments. They encourage student-led analysis, turning passive lectures into collaborative explorations. With responsive designs, these templates adapt to hybrid classes, maintaining clarity on any screen.
Versus plain worksheets, charts add gamification - think progress bars that fill as goals are met - boosting motivation. Educators note improved retention rates, with visuals aiding memory formation.
In STEM, scatter plots diagram experiment results; in arts, radial charts organize project critiques. These tools democratize data, empowering even young learners.
Default charts often feel rigid, but ours include thematic overlays like seasonal motifs or subject icons, injecting fun without distraction. Vector graphics ensure longevity - no blurring after repeated edits. Plus, embedded formulas auto-update calculations, freeing teachers from manual math.
Accessibility features like screen-reader tags make them inclusive, aligning with modern pedagogy standards.
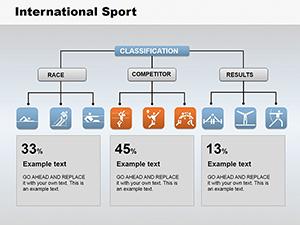
One middle school adopted hierarchy charts for history timelines, reporting heightened engagement and quiz scores up 25%.
A high school biology class used Venn diagrams to compare ecosystems, revealing overlaps that clarified biodiversity. Elementary teachers charted reading milestones with trophy icons, celebrating incremental wins. These stories highlight charts` role in nurturing curiosity and confidence.
Adapt for parent nights with summary dashboards or admin reports with aggregated metrics. The possibilities are as boundless as your imagination.
Revitalize your lessons - choose a template and chart a path to inspired education.
Empower your classroom - download and deploy these charts for transformative teaching.
Copyright © 2009-2026 ImagineLayout All rights reserved.