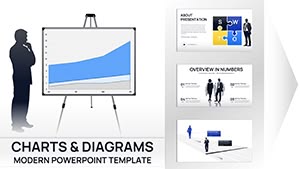
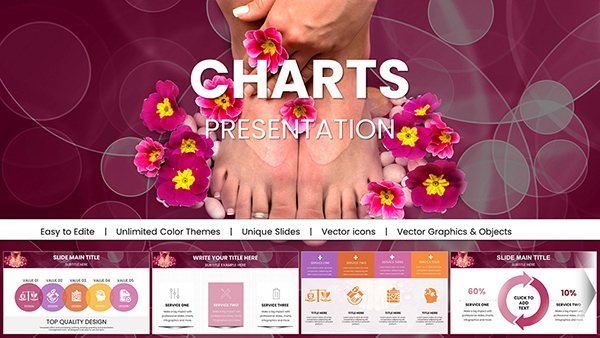
Career chart PowerPoint templates empower professionals, coaches, and HR teams to map journeys visually, highlighting achievements and future trajectories. With sleek graphs, timelines, and icons, they turn abstract progress into tangible narratives.
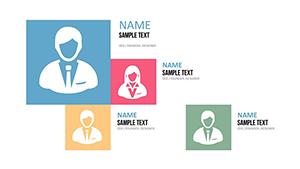
Geared toward job seekers illustrating skill evolution, managers tracking team developments, or educators teaching advancement strategies, these templates simplify complex data into digestible slides.
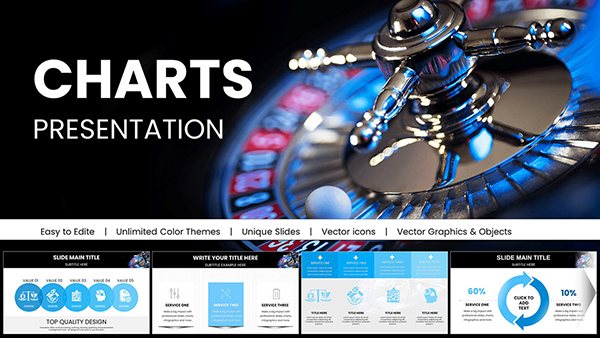
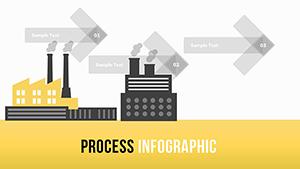
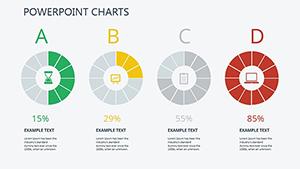
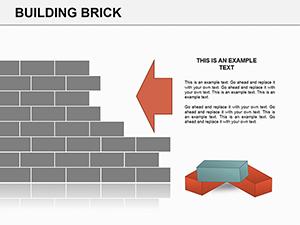
PowerPoint-native, they boast drag-and-drop charts that update dynamically with your inputs. Choose from ladder diagrams for hierarchical climbs or radial plots for multifaceted roles.
Discover how these tools can elevate your presentations - browse our career chart selection and chart your course to standout decks.
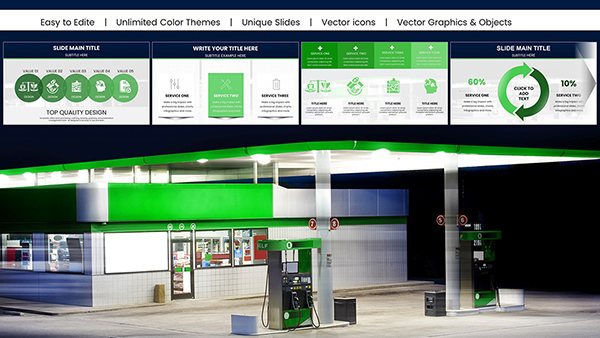


Versatile for multiple contexts, these templates aid in performance reviews, where supervisors plot promotion tracks with bar growths. Job applicants embed charts in portfolios, quantifying experiences like project impacts.
Coaches design session visuals, using flowcharts for goal setting. Recruiters showcase company ladders, attracting talent with clear progression paths.
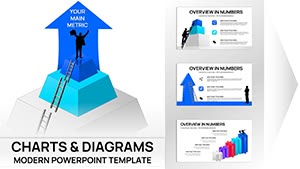
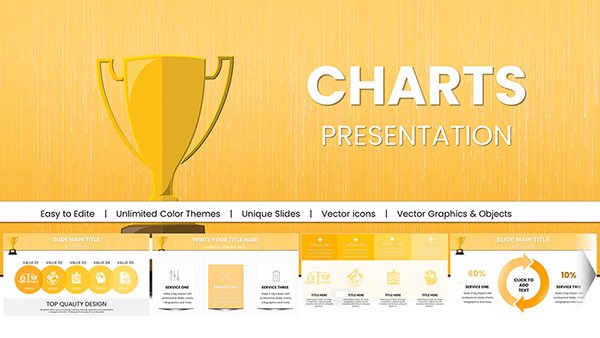
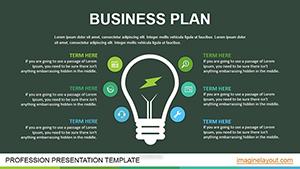
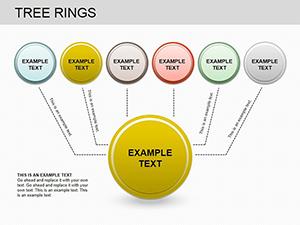
Built-in PowerPoint charts feel rigid and uninspired; our career-specific ones incorporate motivational icons like upward arrows, fostering aspiration. Defaults lack context - ours tie data to career metaphors, like branches for diversification.
Automation perks: Linked Excel imports refresh visuals instantly, unlike manual redraws.
| Factor | Career Templates | Generic Charts |
|---|---|---|
| Relevance | Career-themed icons | Abstract shapes |
| Update Speed | Dynamic links | Static edits |
| Inspirational Value | Narrative integration | Data only |
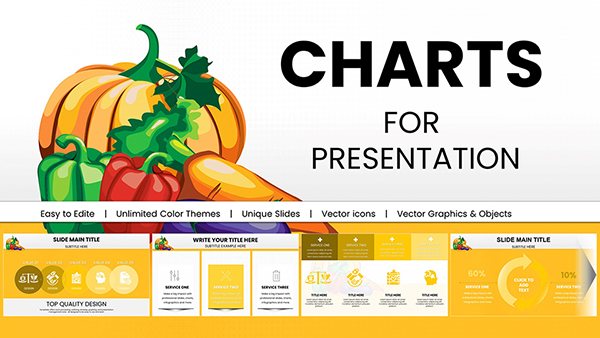
Color-code stages - blues for foundations, golds for peaks - to guide eyes. Annotate peaks with key wins for storytelling. Test accessibility with high-contrast modes.
Example: A mentee`s progress deck landed a promotion, its visuals clarifying value added. Animate builds sequentially for dramatic reveals.
Secure your career chart template.
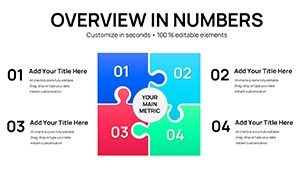
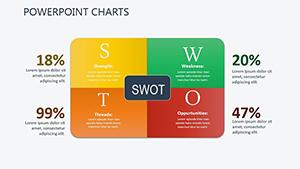
Go further: Integrate SWOT analyses as quadrant charts for self-assessments. In workshops, gamify with progress thermometers.
Case: An HR firm standardized onboarding with these, reducing turnover via transparent visuals. Customize for industries, like tech stacks as node graphs.
Drive meaningful dialogues.
Gantt, pie, line, and custom career ladders for varied needs.
Yes, embed spreadsheets for live data syncing.
Intuitive drag-and-drop makes them user-friendly.
Pre-animated options, plus easy custom paths.
Adaptable across fields like tech, healthcare.
Copyright © 2009-2026 ImagineLayout All rights reserved.