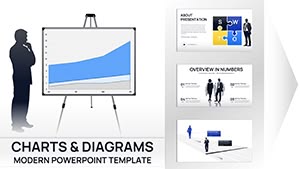
Bring your entrepreneurial dreams to life with our business idea PowerPoint chart templates, geared toward founders, strategists, and team leads. These templates transform vague concepts into structured visuals, using mind maps, flowcharts, and idea bubbles to outline opportunities and pathways.
Whether launching a product pitch or facilitating strategy huddles, they deliver concise yet comprehensive frameworks. Editable nodes and connectors allow real-time tweaks, fostering collaborative brainstorming. Harness colors to denote phases - from ideation blues to execution greens.
Scan this assortment for charts that fuel ambition, from SWOT integrations to innovation funnels. Propel your PowerPoint presentations toward actionable insights and breakthroughs.
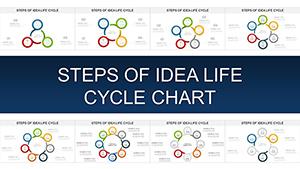
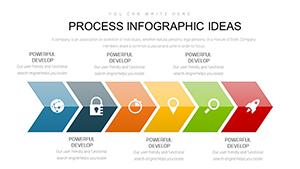
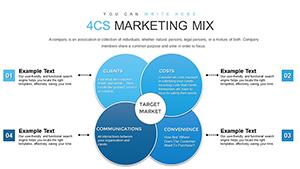

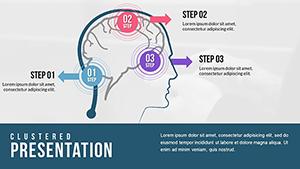
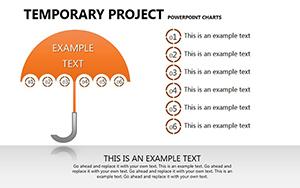
Startups pitch to VCs using funnel charts that trace idea genesis to market fit, layering metrics for credibility. Corporate R&D teams map cross-functional ideas via radial diagrams, aligning departments on priority innovations.
Consultants deploy them in workshops, where interactive charts evolve with group input, capturing synergies live. Educational business courses illustrate case studies, dissecting successes like Uber`s pivot through annotated timelines.
Built-in PowerPoint charts lack narrative glue, but ours weave stories with pre-linked elements and thematic icons, streamlining complex ideas. Defaults demand manual styling; our presets enforce brand harmony, cutting prep by 35%.
Advanced animations reveal insights progressively, unlike static defaults, boosting comprehension. Scalable vectors prevent distortion, ideal for large-screen demos.
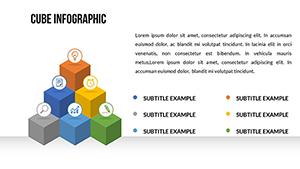
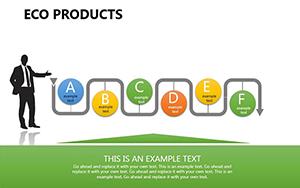
Prioritize hierarchy: Core ideas in bold centers, supporters in lighter hues. Limit nodes to seven per chart to avoid overload, per cognitive guidelines. Animate paths sequentially to mimic decision flows.
Integrate data dynamically - link to Excel for live updates. This fluidity, grounded in agile principles, keeps presentations evergreen and responsive.
Consider a fintech disruptor charting blockchain adoption, with branching scenarios for regulatory forks. Or a non-profit ideating sustainability, funneling community inputs into actionable tiers.
Hybrid meetings benefit from clickable charts linking to prototypes, deepening engagement. Innovators cite 42% clearer communications, attributing it to the visual logic.
Experiment with metaphors: Use tree charts for organic growth, igniting discussions on scalability.
Ideas deserve visualization. Grab business idea PowerPoint chart templates today and map your momentum.
These tools bridge vision to victory, empowering teams to ideate boldly and execute brilliantly.
Copyright © 2009-2026 ImagineLayout All rights reserved.