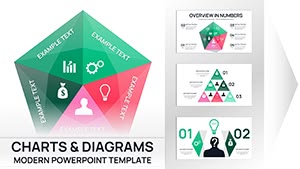
Illuminate agendas with business meetings PowerPoint chart templates that pack punch into every pixel. Suited for coordinators, presenters, and data enthusiasts, they encompass flow diagrams, balance scorecards, and heatmap visuals to unpack performance and priorities succinctly.
Turn figures into focal points: sales trends via lines or resource allocations through stacks. PowerPoint`s versatility supports hybrid setups seamlessly.
Geared for efficiency, they streamline prep. Infuse with thematic elements for memorability.
Clarify your convos - view our charts and download to decode data dynamically today.
Sustainable Development PowerPoint Charts: Inspire Eco-Innovation
ID: #PC00937
$25.00
(430)
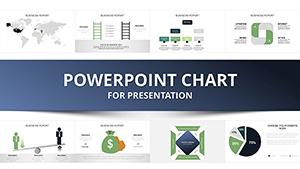
Mastering Technical Analysis: PowerPoint Charts for Informed Trading Decisions
ID: #PC00924
$24.00
(654)
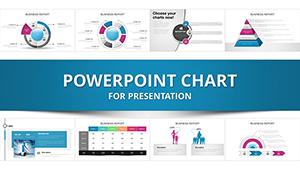
Remote Work PowerPoint Charts Template
ID: #PC00892
$18.00
(692)
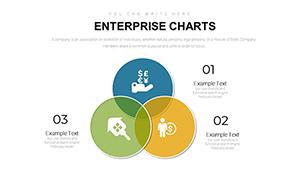
Enterprise PowerPoint Charts Template: Elevate Business Insights
ID: #PC00883
$14.00
(623)
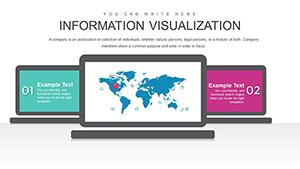
Information Visualization PowerPoint Template
ID: #PC00876
$19.00
Empowering Discussions with Dynamic Charts
Meetings flourish with focused visuals, and our PowerPoint templates oblige, trumping stock charts with zoomable treemaps and combo hybrids. Leads apply them for pipeline analyses, revealing bottlenecks that accelerate resolutions.
Highlight reels: pivot table embeds for flexibility and theme syncing for cohesion, easing maintenance. This streamlines from setup to spotlight.
Strategic Integrations in Sessions
Goal Alignment: Bubble charts for priority plotting.
Trend Analysis: Sparkline series for compact histories.
Feedback Loops: Funnel drops for conversion insights.
Superior to defaults, they feature error bars for statistical rigor.
Curating Charts for Conviction
Emphasize relevance: curate datasets to core questions. Blend chart types judiciously, leveraging morph transitions for evolutions. Standardize via slide masters for uniform appeal.
Ensure equity with color-blind palettes and audio alt text cues. These measures maximize inclusivity and influence.
Inspired Adaptations for Variety
Evolve into workshop aids with editable quadrants or audit trails via Sankey flows. HR adapts for talent reviews, quantifying skills gaps. Breadth broadens boardroom boundaries.
Tap into tech: visuals for blockchain audits or remote collab metrics innovate interactions.
From Gridlock to Breakthroughs
Exec Lia condensed reports with our heatmaps, sharpening strategic pivots. Planner Theo decoded variances via combos, optimizing ops. Transformations testify to chart clarity.
Annotate outliers to narrate nuances effectively.
Frequently Asked Questions
Decode decisively - secure PowerPoint charts today and discuss deliberately. Delve into complementary designs.