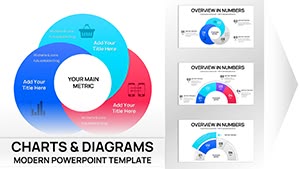
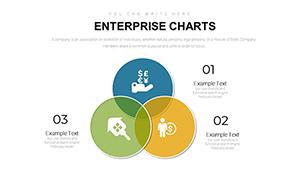
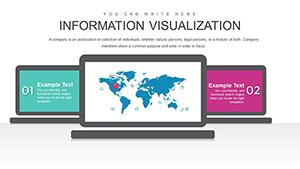
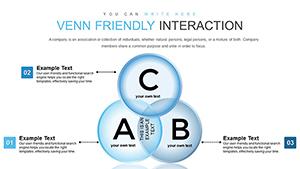
Master the art of data visualization in your business development presentations with our PowerPoint charts collection. Aimed at analysts and managers who turn numbers into narratives, these charts simplify complex info like revenue trends and market penetrations.
Featuring editable vectors, 3D effects, and smooth animations, they`re perfect for highlighting key insights during strategy huddles or investor calls. Save design drudgery and focus on insights.
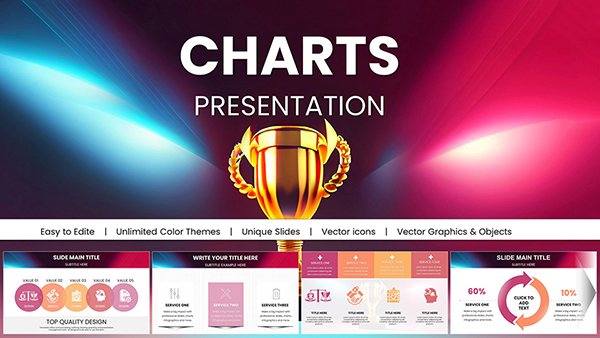
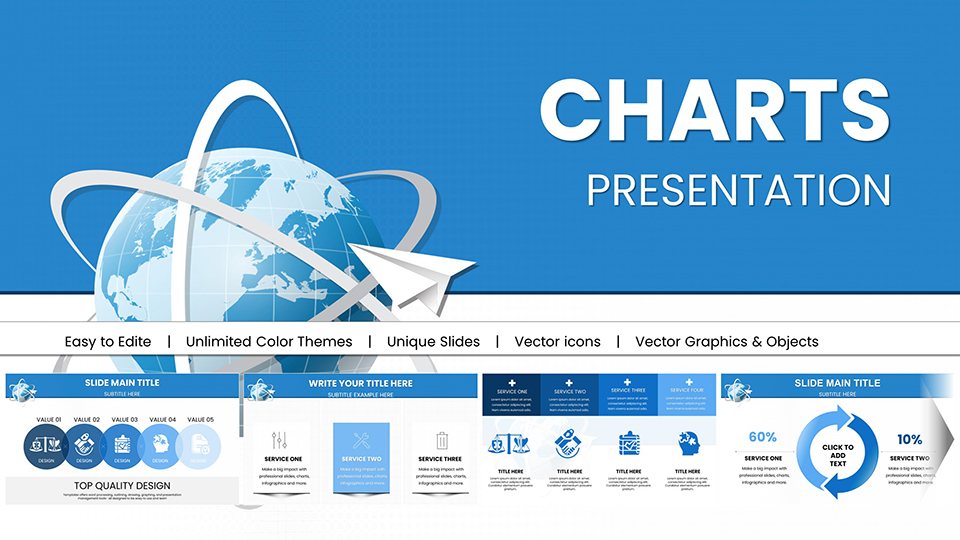
Our templates ensure compatibility across Windows and Mac, with high-DPI exports for sharp prints. Dive in and make your data pop.
View our PowerPoint charts to supercharge your slides.
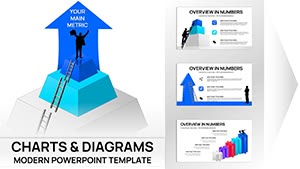
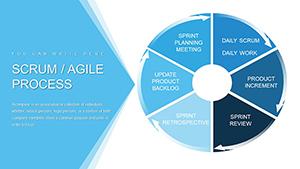
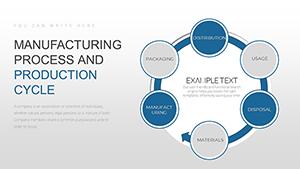
Charts elevate development talks - use a waterfall chart to break down profit margins in finance reviews, revealing levers for improvement. In product launches, Sankey diagrams trace user journeys, pinpointing drop-offs visually.
Built-ins are rigid; ours offer theme-synced styles and formula embeds for real-time tweaks.
Premium Features and Smart Practices
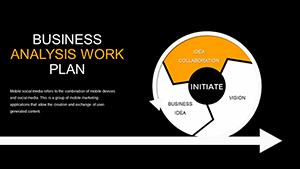
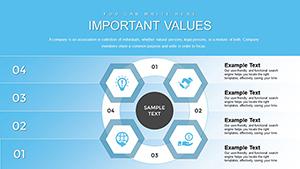
Highlights: Gradient fills for depth, icon overlays for context. Practice: Align to grid for precision, limit data series to five for clarity. Creatively, animate chart builds to mimic growth, syncing with voiceover for drama.
Example Implementations
A VC firm used our radar charts for portfolio comparisons, aiding quick diversification decisions. HR pros love the org chart variants for restructuring visuals.
Chart your course - pick a template now.
Designer Recommendations
Opt for sans-serif labels; use accessibility contrasts. Link to external data for dashboards that update automatically.
Chart Creation Workflow
Select type based on story.
Input clean data sets.
Add annotations sparingly.
Preview in slideshow mode.
Refine for resonance.
Frequently Asked Questions
Make data your ally. Download charts and illuminate your strategies.