Business analysis PowerPoint Charts

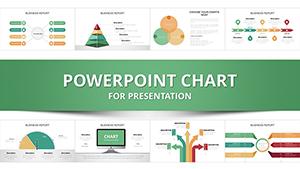
Empower your business narratives with our PowerPoint charts for analysis. Curated for managers, consultants, and strategists, these templates dissect operations, finances, and markets with analytical depth and visual appeal.

Including SWOT matrix charts and Pareto analyses, they facilitate breakdown of business metrics into actionable visuals. Harness PowerPoint`s collaboration tools for team refinements, ensuring charts evolve with insights. From boardrooms to brainstorming sessions, make analysis accessible and authoritative.

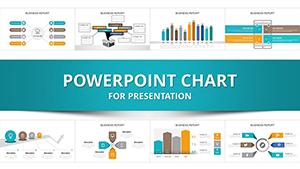
Designed for those decoding business complexities, our charts clarify paths forward. Review the selection to align with your objectives, and download to integrate strategic visuals into your arsenal. Analyze smarter, starting now.


View by: Last Added | Most Popular
  • like 4
    (309)
    Chemistry Lessons PowerPoint Charts and Templates: Revolutionize Your Teaching
    ID: #PC00976
    $20.00
  • like 5
    (747)
    International Flights PowerPoint Charts: Navigate Aviation Data Effortlessly
    ID: #PC00974
    $20.00
  • like 2
    (1007)
    Airplane Flights PowerPoint Charts: Elevate Your Aviation Presentations
    ID: #PC00972
    $18.00
  • like 4
    (377)
    Schematic Venn Diagram PowerPoint Template
    ID: #PC00295
    $20.00
  • like 2
    (1055)
    Business Analyst PowerPoint Charts Template for Impactful Presentations
    ID: #PC00292
    $25.00
  • like 3
    (762)
    Graph PowerPoint Charts Template for Customer Support Excellence
    ID: #PC00934
    $24.00
  • like 3
    (1046)
    Productivity PowerPoint Chart Template: Enhance Finance Efficiency
    ID: #PC00933
    $24.00
  • like 4
    (296)
    Business Process Management PowerPoint Charts Template: Optimize and Visualize
    ID: #PC00929
    $24.00
  • like 3
    (583)
    Steps Analysis PowerPoint Charts Template: Visualize Processes with Precision
    ID: #PC00918
    $18.00
  • like 5
    (212)
    Step Business Plan PowerPoint Charts Template for Compelling Pitches
    ID: #PC00916
    $23.00
  • like 3
    (508)
    Best Modern Infographic PowerPoint Templates for Engaging Presentations
    ID: #PC00913
    $15.00
  • like 2
    (478)
    Graphic Venn PowerPoint Charts Template: Visualize Connections Effortlessly
    ID: #PC00871
    $22.00
  • like 2
    (1071)
    Science Technology Society Venn PowerPoint Charts: Uncover Intersections
    ID: #PC00863
    $20.00
  • like 3
    (231)
    Venn Diagrams PowerPoint Charts: Unlock Problem-Solving Potential
    ID: #PC00862
    $19.00
  • like 4
    (960)
    Steps Processing PowerPoint Charts Presentation Template
    ID: #PC00809
    $20.00
  • like 3
    (537)
    Business Process Modeling 3D Cube PowerPoint Charts Template
    ID: #PC00794
    $15.00
  • like 3
    (421)
    Improved 4 Set Venn Diagram PowerPoint Template for Professional Presentations
    ID: #PC00790
    $20.00
  • like 3
    (441)
    Venn - 5 Set PowerPoint Charts Template
    ID: #PC00789
    $22.00
  • like 2
    (595)
    4-Set Venn Diagram PowerPoint Template: Visualize Complex Intersections
    ID: #PC00788
    $22.00
  • like 3
    (43)
    Venn - 3 Set PowerPoint Charts
    ID: #PC00787
    $22.00
  • like 4
    (673)
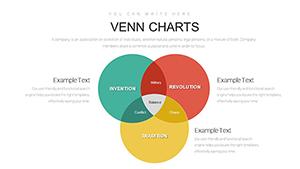
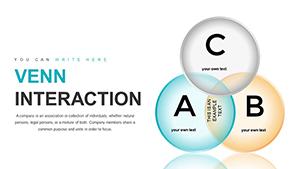
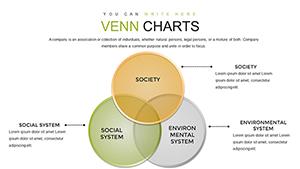
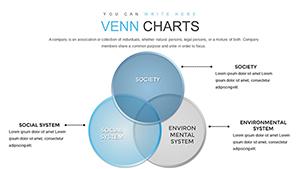
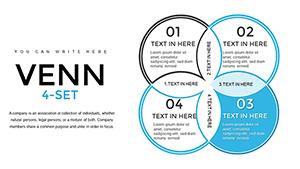
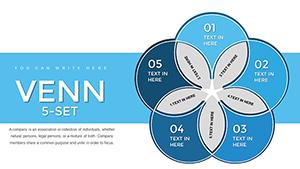
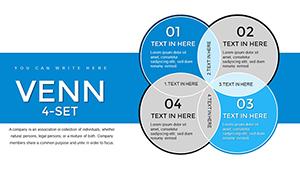
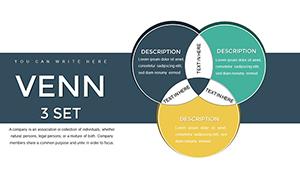
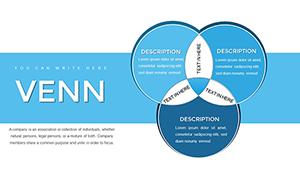
    Professional Venn Diagram PowerPoint Template | Editable Slides (PPTX) - Download Now
    ID: #PC00786
    $24.00
  • like 3
    (1107)
    Data Flow PowerPoint Charts Template for Presentation
    ID: #PC00785
    $20.00
  • like 3
    (1104)
    3D Cube Marked Sides PowerPoint Charts Template
    ID: #PC00676
    $20.00


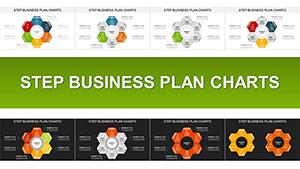
Strategic Depth in Charts

These charts integrate with PowerPoint`s query functions for live business data pulls, surpassing static alternatives in adaptability for evolving analyses.

Core Use Cases

  • Market Research: Bubble charts plotting competitive numerics.
  • Financial Audits: Sankey for resource flow analysis.
  • Operational Reviews: Control charts monitoring variance.

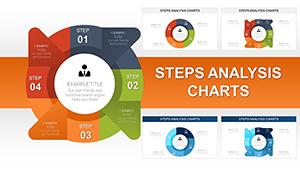
For startups, cohort analysis charts track user retention metrics. They excel over standards with scenario sliders for what-if modeling.

Analytical Best Practices

Layer insights: base charts with trendlines, overlay forecasts. Benchmark against industry averages using dual-series formats. Facilitate Q&A with clickable segments linking to appendices.

Hallmark: AI-suggested annotations highlighting anomalies in business data, automating discovery.

Premium vs. Everyday

Basic charts falter in multi-dimensional analysis; ours support pivot-like rotations for 360-degree views of business metrics.

Strategize visually - download your toolkit.

Case Studies and Innovations

A consultancy charted supply chain risks, averting disruptions via heatmap intensities. In retail, ABC analysis charts prioritized inventory by value.

Forward-thinking: Gamify analysis with progress bars for KPI achievements.

  1. Secure sensitive data with passwords.
  2. Version control via OneDrive.
  3. Customize for stakeholder personas.

Lead with data - begin downloading.

Frequently Asked Questions

Business analysis redefined through charts. Advance ahead.