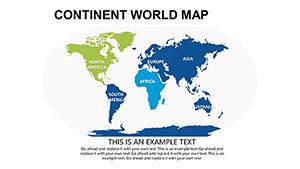
Bring the vast landscapes of Australia to your slides with our comprehensive collection of PowerPoint map templates. From pinpointing urban hubs to shading regional demographics, these designs make geographical storytelling effortless and visually striking.
Suited for business analysts, educators, and travel planners, each template highlights states, territories, and key cities with precision. Use them to illustrate market expansions, educational geography lessons, or adventure routes that captivate your audience.
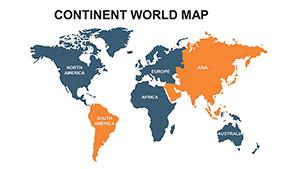
Fully vector-based for infinite scalability, you can recolor regions to match branding, add data labels, or overlay icons for custom markers. Whether projecting in a boardroom or sharing online, these maps ensure clarity and professionalism. Dive into our library and chart a course for presentations that resonate across the continent.


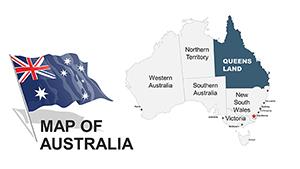

Australia`s diverse terrain - from arid outback to coastal metropolises - demands maps that capture its scale and variety. Our PowerPoint templates excel here, offering layered outlines that separate states like New South Wales from remote territories, allowing nuanced data representation without distortion.
Unlike static images, these interactive elements let users zoom into specifics, such as Sydney`s harbor or Perth`s mining districts, fostering deeper engagement. This approach transforms dry stats into dynamic tales, ideal for global audiences unfamiliar with the layout.
Such uses underscore the templates` role in bridging information and inspiration.
Free clipart maps often warp shapes and lack detail, frustrating precise users. Our professional-grade versions maintain accurate proportions, with editable paths for custom boundaries - think adding indigenous lands or urban sprawl zones.
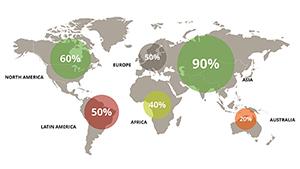
Integration with charts, like pie overlays on regions, surpasses simple coloring, enabling multifaceted analysis in one slide. Responsive to themes, they harmonize with corporate palettes, unlike rigid stock graphics. For international collabs, multi-language labels enhance accessibility, a feature absent in many alternatives.
Result: Maps that inform, persuade, and impress, elevating your narrative authority.
These perks make complex geography approachable and actionable.
Anchor maps with context: precede with a full-country overview before drilling down. Employ consistent legends for color meanings, avoiding guesswork. Animate builds sequentially - reveal states one-by-one to guide viewer focus during reveals.
For data-heavy slides, use subtle gradients over bold fills to denote trends without clashing. Test projections in various lights to confirm legibility. Collaborate by locking base layers, freeing teams to add localized insights safely.
Dodge pitfalls like overcrowding: limit pins to 5-7 per view, linking extras to pop-ups. Refresh data annually for relevance, keeping your decks evergreen.
A logistics firm mapped supply chains across the Nullarbor, optimizing routes that slashed fuel costs by 15%. In academia, a lecturer`s animated colonization routes engaged students, boosting retention scores. Travel agencies plotted bespoke itineraries, converting 30% more inquiries to bookings.
These triumphs highlight templates` power to navigate real challenges.
Plot your path to excellence - download a map template now!
Drawn from official GIS sources, they reflect current boundaries with pixel-perfect scaling for reliability.
Yes, text boxes snap to coordinates, supporting fonts and sizes for clear, branded annotations.
Built-in paths enable smooth fades, wipes, or paths for dynamic region reveals.
High-res vectors export to PDF at 300 DPI, ensuring sharp handouts or posters.
Layer Excel embeds over regions for live data syncing and interactive updates.
Discover the lay of the land - choose your template and navigate forward!
Copyright © 2009-2026 ImagineLayout All rights reserved.