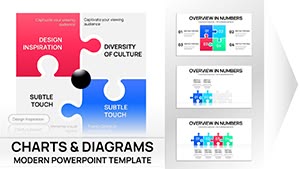
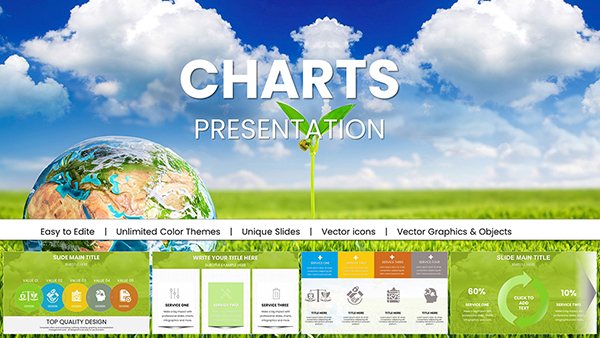
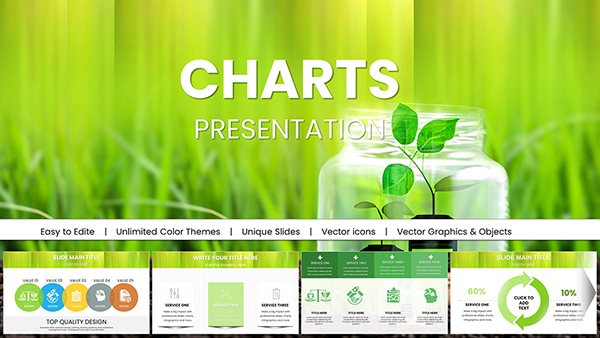
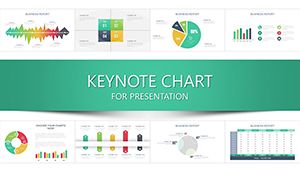
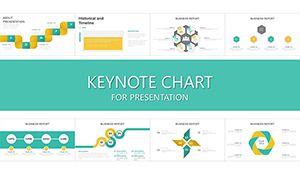
Accounting demands precision, and visuals are key to conveying financial stories clearly. Our accounting Keynote charts templates equip CPAs, analysts, and business owners with sophisticated tools for Apple Keynote, including balance sheets, P&L graphs, and trend analyses. These templates transform raw numbers into insightful narratives through clean lines, color-coded segments, and animated builds.
Ideal for audits, investor meetings, or internal reviews, they save design drudgery while amplifying data impact. Edit formulas, import spreadsheets, and align with your firm`s branding effortlessly. Focused on usability, they ensure compliance-friendly layouts that impress stakeholders.
For finance teams in SMEs to enterprises, this category delivers reliability and flair. Uncover the chart template that balances your books beautifully - integrate numbers with narrative today.
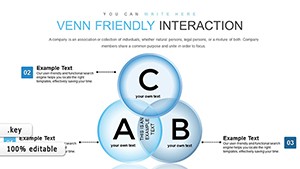
Venn Friendly Interaction Keynote Charts for Relationships
ID: #KC00870
$22.00
(395)
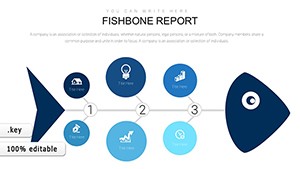
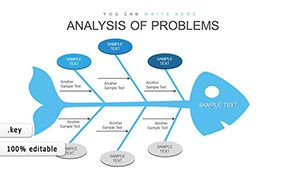
Ishikawa Fishbone Analysis: Master Problem Solving with Keynote Charts
ID: #KC00861
$18.00
(1060)
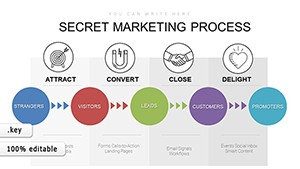
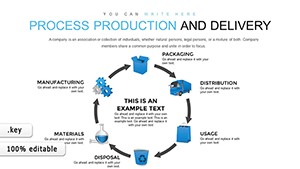
Production and Delivery Process Keynote Charts Template
ID: #KC00854
$18.00
Harnessing Charts for Accounting Excellence
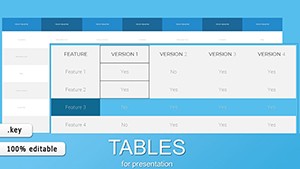
In accounting, charts bridge numbers and decisions. Our Keynote templates specialize in fiscal visuals, from waterfall charts dissecting variances to pie breakdowns of expenses. Auditors appreciate audit trail slides, while managers favor KPI dashboards for quick scans.
Elevating beyond spreadsheets, these leverage Keynote`s charting prowess for real-time updates and scenario modeling. For tax season, seasonal variants track deductions with progress bars.
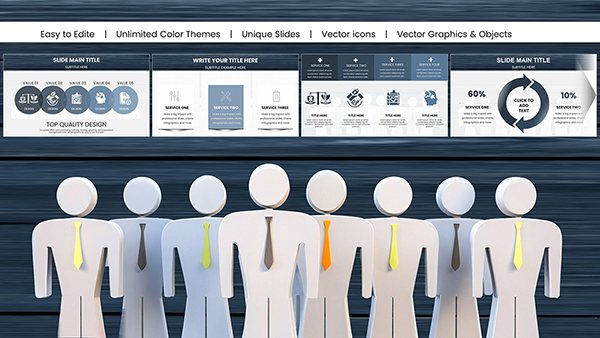
Power-Packed Chart Features
Dynamic Data Links: Pull from Excel for live refreshes.
Compliance Icons: GAAP symbols and legend standards built-in.
Animation Sequences: Sequential reveals for layered insights.
Export Options: Seamless to PDF or video for reports.
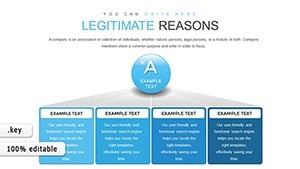
Targeted Use Cases in Finance
A CFO presents quarterly results using the Financial Summary Template, with stacked bars illustrating revenue streams. Board members nod in approval, strategies sharpened.
Small business owners utilize the Budget Tracker Template for loan applications, line graphs forecasting cash flow to sway lenders.
Consultants craft the Client Audit Template, radar charts comparing benchmarks to highlight efficiencies.
Outshining Default Keynote Charts
Stock charts lack accounting nuance; ours include error bars for variances and dual-axis for comparisons. Lighter files load faster than bloated alternatives, crucial for large datasets.
Pro Tips for Chart Mastery
Select chart types wisely - bars for categoricals, lines for trends. Color consistently: greens for positives, reds for alerts. Narrate each visual with key takeaways, avoiding data dumps.
Validate accuracy with double-checks; use tooltips for hover details in digital versions.
Innovative Financial Applications
Tax Planning: Funnel charts for deduction flows.
Forecasting: Bubble plots for risk-reward scenarios.
Non-Profits: Donut charts for fund allocation transparency.
Startups: Gantt hybrids for milestone budgeting.
These elevate routine reports to strategic assets.
Frequently Asked Questions
Balanced answers to accounting chart queries.
Chart your course - secure a template and finance with finesse. Link to bookkeeping for complementary tools.