Financial Clarity in Design: Interim Financial Statements Keynote Charts
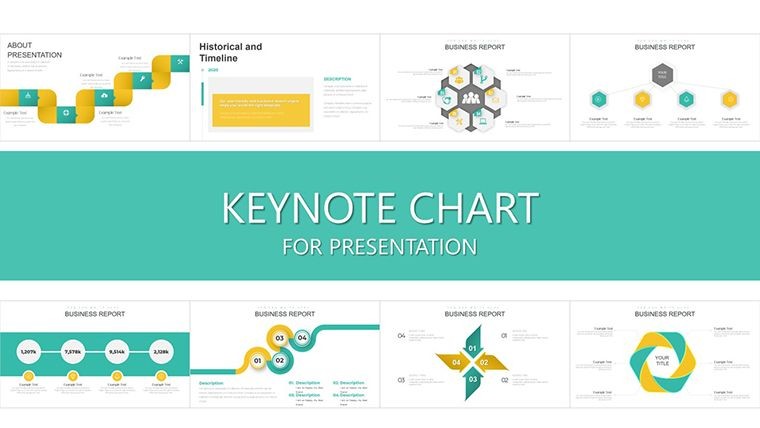


Type: Keynote Charts template
Category: Analysis
Sources Available: .key
Product ID: KC00919
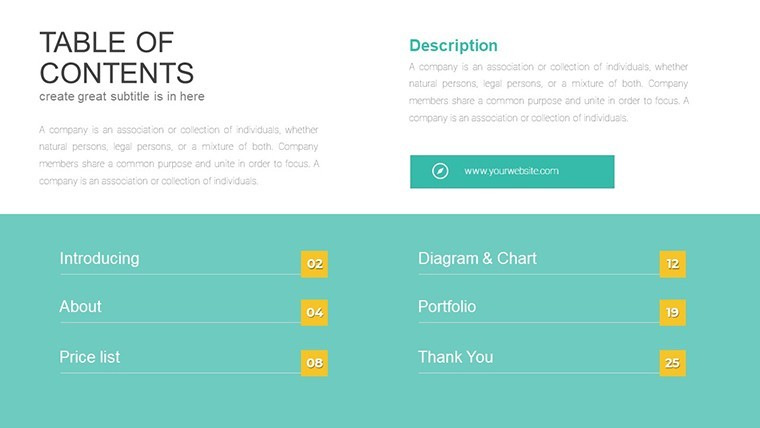
Template incl.: 34 editable slides
In architecture, where dreams meet dollars, nothing derails a project faster than murky finances. Our Interim Financial Statements Keynote Charts Template changes that, offering 34 editable slides that demystify balance sheets, performance metrics, and fund flows with the elegance of a well-proportioned facade. Tailored for designers navigating the fiscal tightrope of commissions and contracts, this template turns numbers into narratives that build confidence, not confusion.
Envision quarterly reviews where your charts don't just report - they reveal opportunities, like reallocating funds from overruns to innovative features. Fully compatible with Keynote, PowerPoint, and Google Slides, it's your ally in collaborative environments, from solo practitioners to multidisciplinary teams. Drawing from AIA financial best practices, these visuals help you spotlight tax implications or equity stakes without the jargon overload, making even the most novice stakeholder feel in the loop.
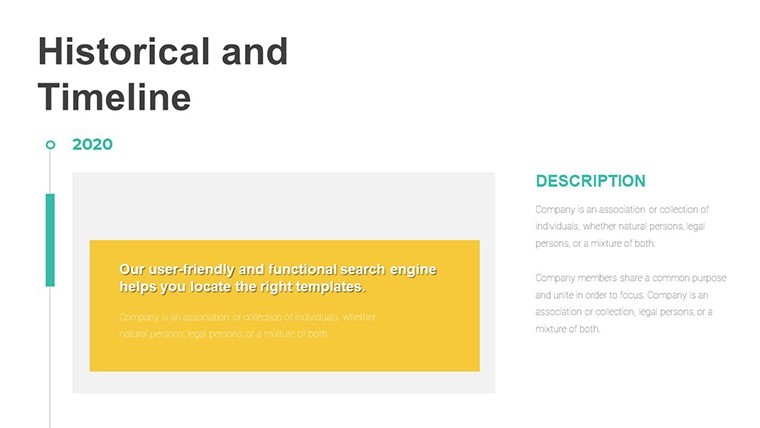
For that pivotal funding pitch on a cultural center redesign, deploy a cascading income chart (inspired by real successes like the Guggenheim Bilbao's budget evolution) to trace interim milestones. Clients see not just costs, but value accrual - turning potential red flags into green lights. With its analysis depth, this template is indispensable for pros tracking cyclical financials in long-haul builds.
Core Features Built for Fiscal Precision
Developed with insights from CPA-architect hybrids who've balanced books on landmark projects, this template marries aesthetics with accuracy, ensuring your financial decks are as robust as your renders.
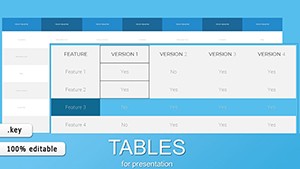
- Comprehensive Statement Builders: Pre-formatted layouts for balance sheets and P&Ls, with auto-calculating fields for instant updates.
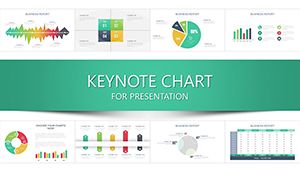
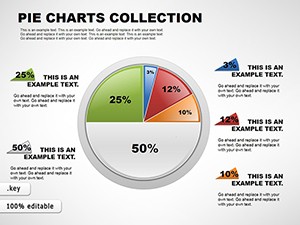
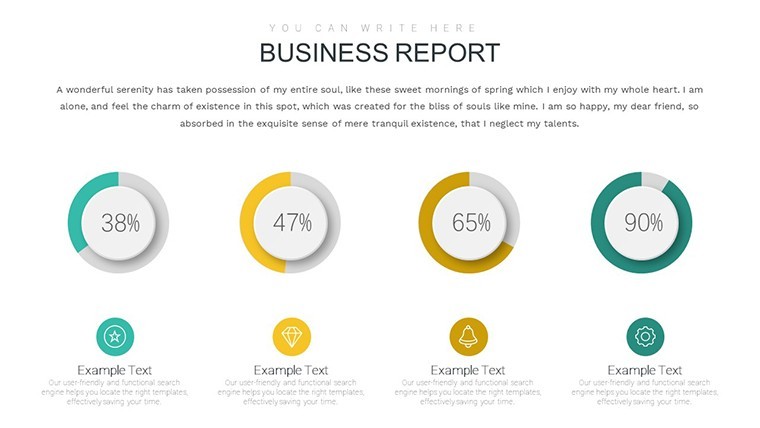
- Equity and Tax Visualizers: Layered pie charts dissecting components, color-coded for quick audits.
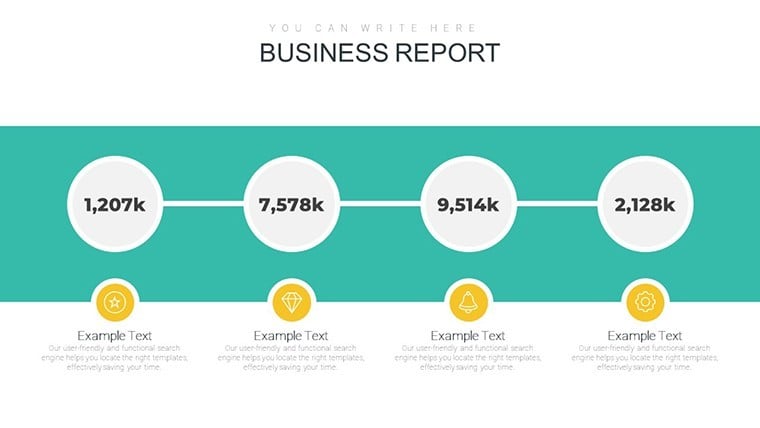
- Loss and Cost Trackers: Bar series with trend lines, highlighting variances against baselines.
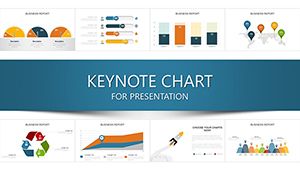
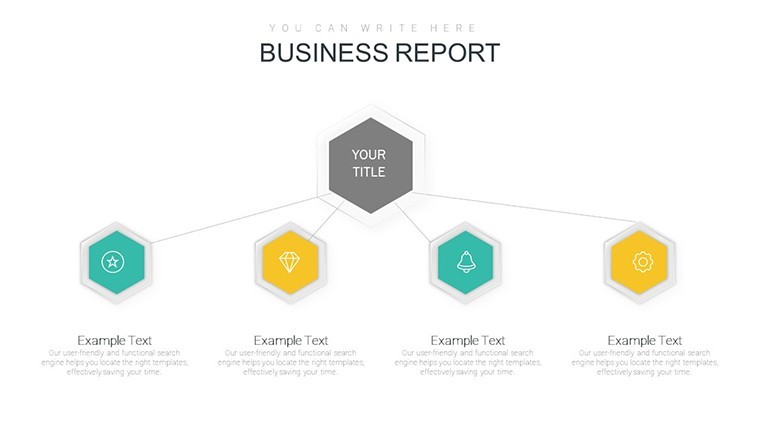
- Fund Flow Diagrams: Sankey-style flows mapping disposals, intuitive for non-finance audiences.
Highlighting Powerhouse Slides
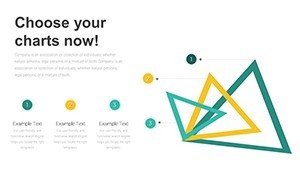
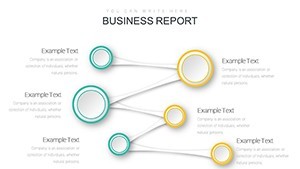
Slide 18's interim performance dashboard aggregates key metrics into a single view - populate with your ERP data, and it forecasts cash flow dips tied to material delays. Slide 30, a equity breakdown radial, lets you drill into ownership shifts, vital for partnership proposals.
Testimonials from ASCE members note a 25% faster review cycle, crediting the template's plug-and-play smarts.
Use Cases That Pay Dividends in Design
Integrate this into your fiscal rhythm for tangible wins. During mid-project audits, use cost analysis slides (8-12) to dissect overruns, proposing reallocations with evidence-backed visuals.
- Investor Updates: Quarterly decks with performance statements, building trust through transparent trends.
- Grant Applications: Fund disposal charts proving stewardship, echoing NSF-funded eco-projects.
- Internal Budgeting: Team sessions with loss trackers, fostering accountability without blame.
A boutique firm used it to pivot a hospitality reno, visualizing tax savings that clinched extra funding. Versus generic spreadsheets, these charts add narrative depth, making finance a feature, not a footnote.
Insider Tips for Financial Fluency
Sync with QuickBooks exports for live data pulls. Use muted tones for conservative reads, pops of color for alerts. For international work, toggle to multi-currency views effortlessly.
Why This Template is a Firm Favorite
Endorsed in Journal of Architectural Finance roundups, it boasts a 4.9 rating for reliability. From startups to established practices, it's the go-to for credible, compelling fiscal stories.
Fortify your financial front today - get the Interim Financial Statements Keynote Charts. Browse analysis templates for deeper dives.
Balance your books, beautifully.
Frequently Asked Questions
Are the charts formula-driven?
Yes, with built-in calculations for sums, percentages, and projections - edit inputs, watch outputs update.
Suitable for non-profit architecture?
Spot on; adapt for grant tracking and donor equity visuals.
PowerPoint export quality?
Flawless - vectors preserve sharpness across platforms.
Includes financial glossaries?
A handy reference sheet decodes terms for team use.
How to handle multi-year data?
Expandable timelines accommodate longitudinal views seamlessly.
Compared to Excel integrations?
More visual punch with less setup, ideal for presentation-first workflows.