EU PowerPoint Maps Template - Customizable & Detailed


Type: PowerPoint Maps template
Category: Europe
Sources Available: .pptx
Product ID: PM00173
Template incl.: 30 editable slides
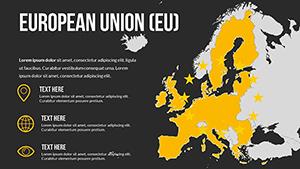
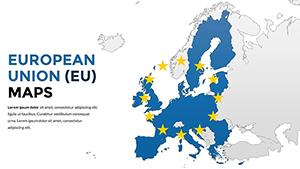
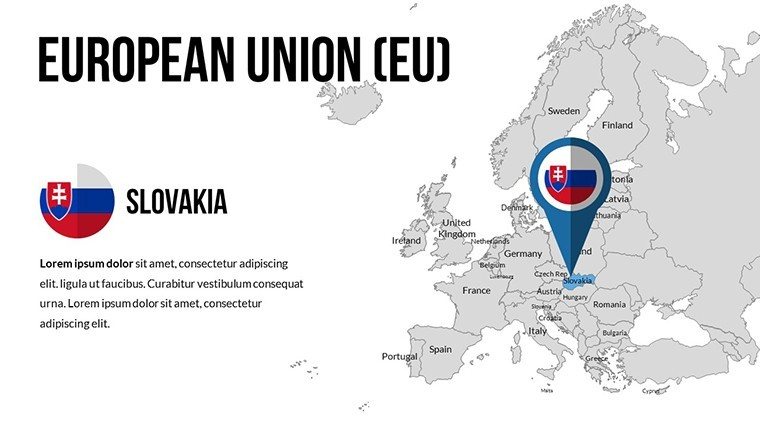
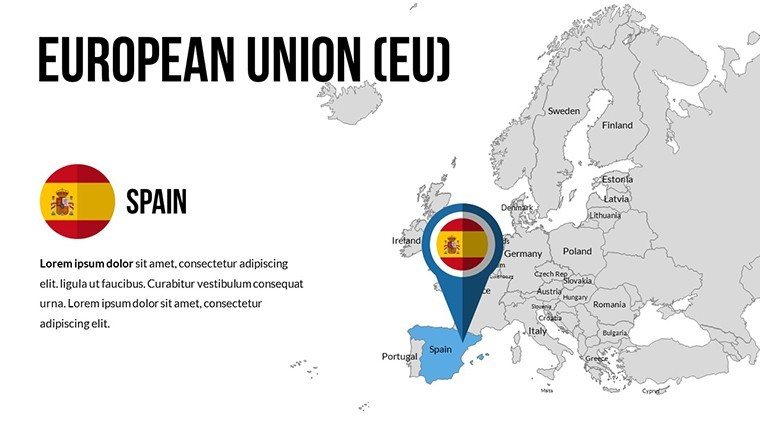
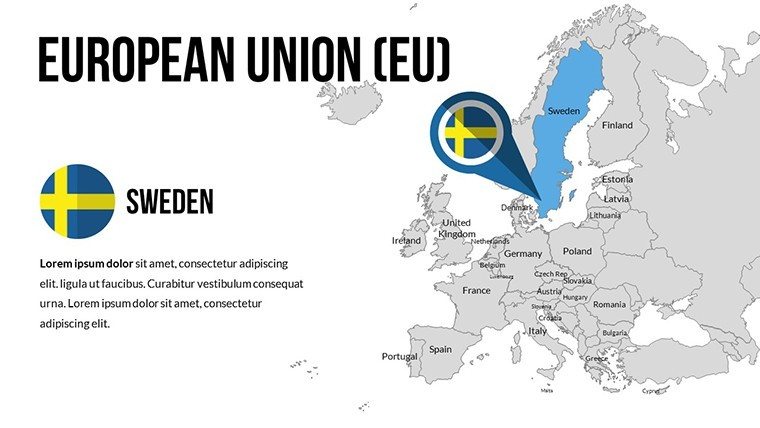
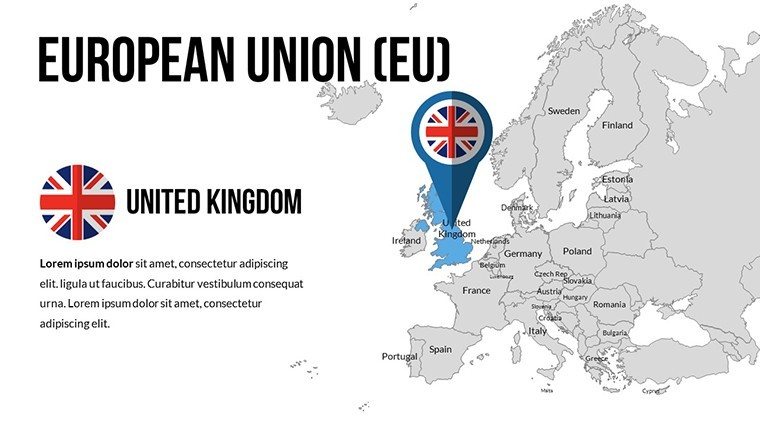
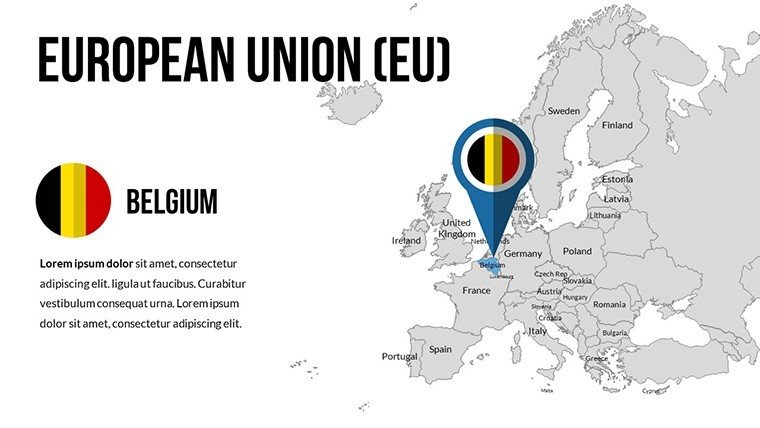
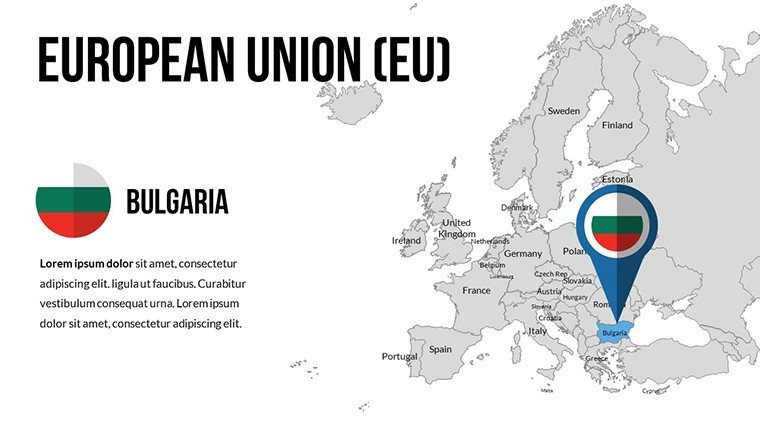
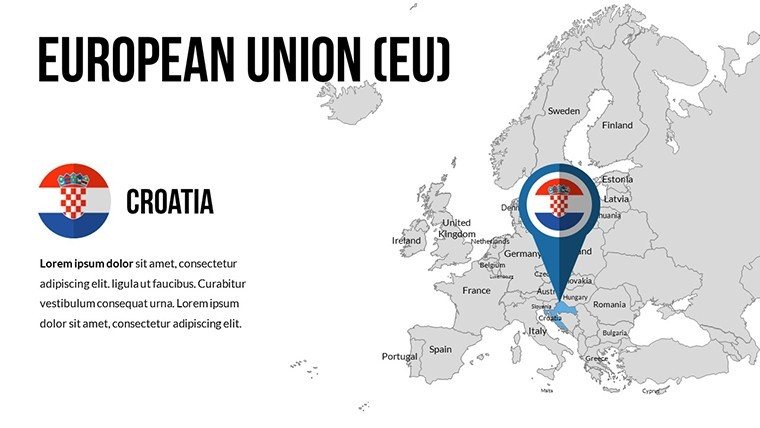
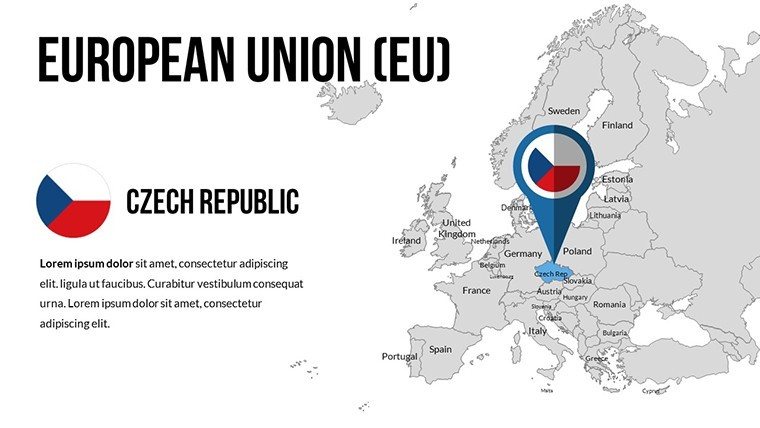
Navigating the complexities of the European Union demands visuals that clarify and captivate. Our EU PowerPoint Maps Template, with 30 editable slides, is tailored for analysts, educators, and business strategists seeking to portray member states, economic indicators, or cultural dynamics. Envision highlighting Brexit impacts with shaded regions or mapping EU funding distributions across countries - these slides make it possible with precision and flair. Built on accurate cartographic data from sources like Eurostat, this template ensures reliability while offering effortless customization. It's the go-to resource for turning dense information into digestible stories, whether in academic halls or corporate meetings, helping you foster informed discussions and drive decisions.
The Essence of European Visualization
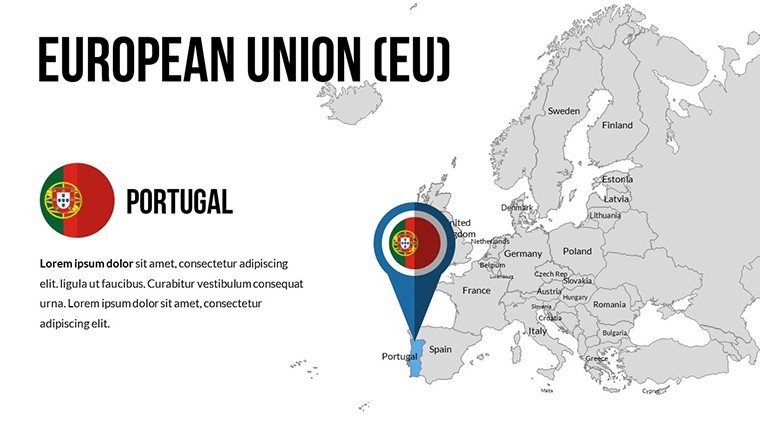
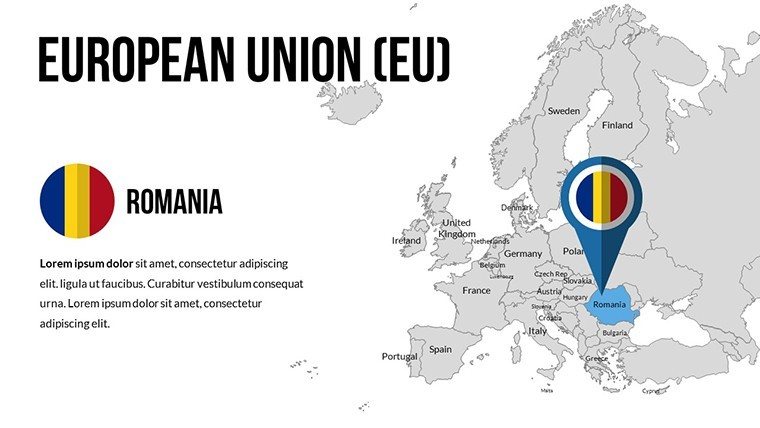
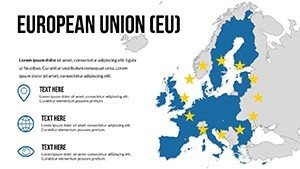
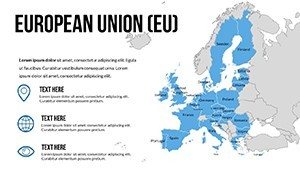
This template draws from EU-specific design guidelines, emphasizing clarity in representing the 27 member states and associated territories. It incorporates elements like flag icons and statistical overlays, adhering to standards from the European Commission for accurate data presentation.
Standout Features for Precision Mapping
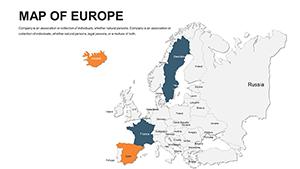
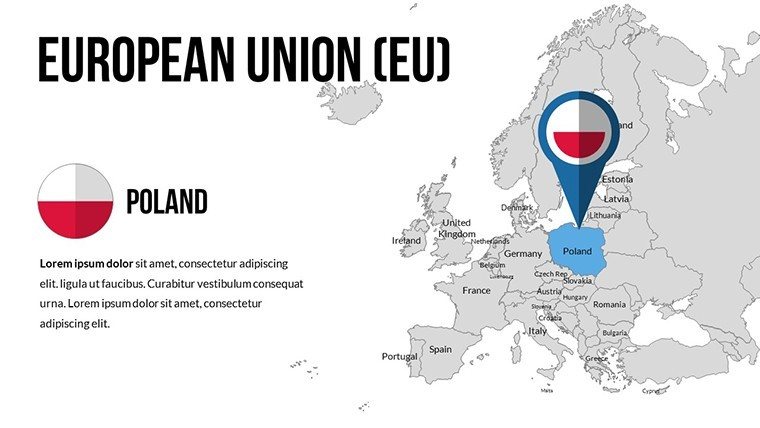
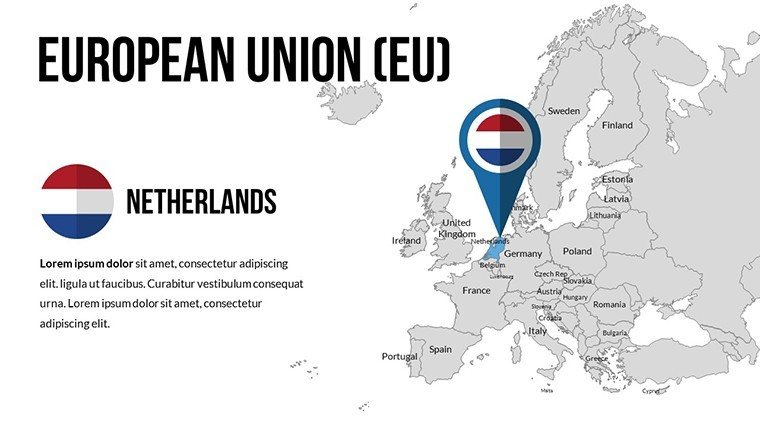
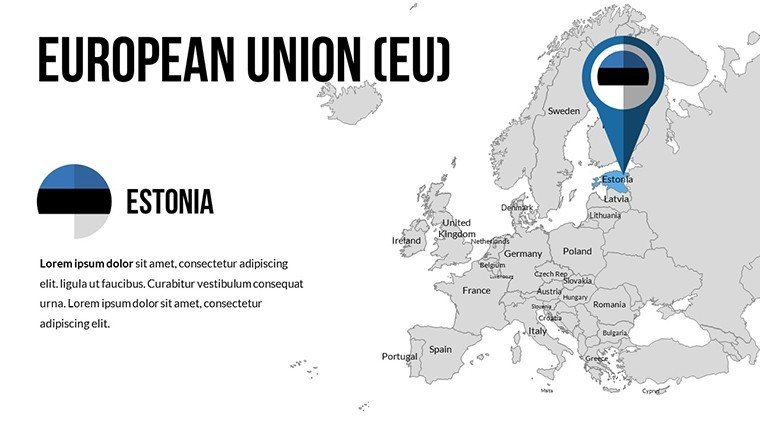
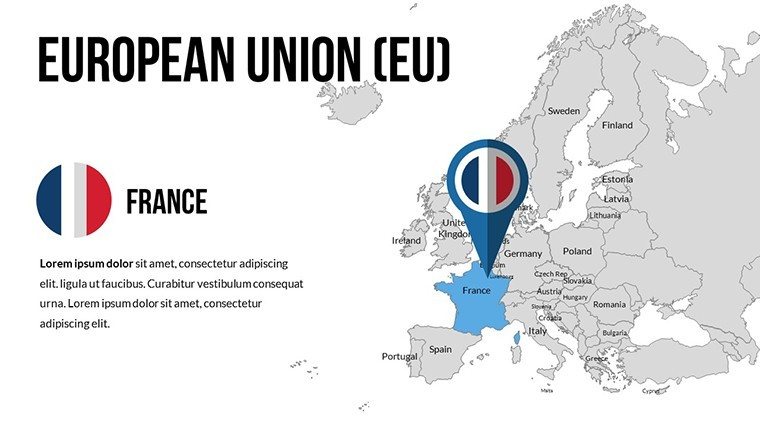
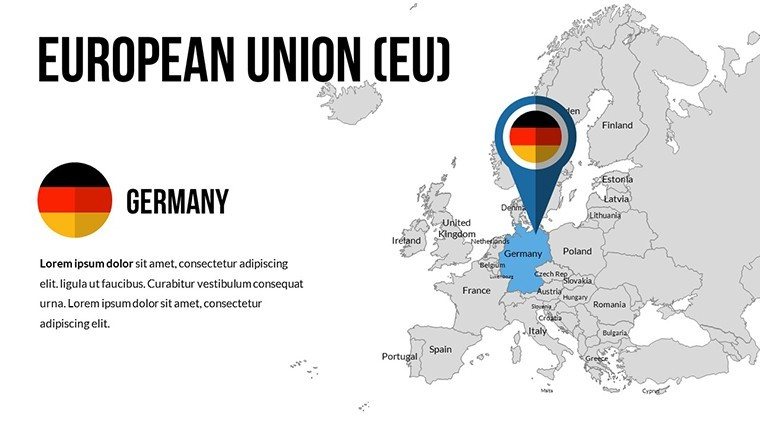
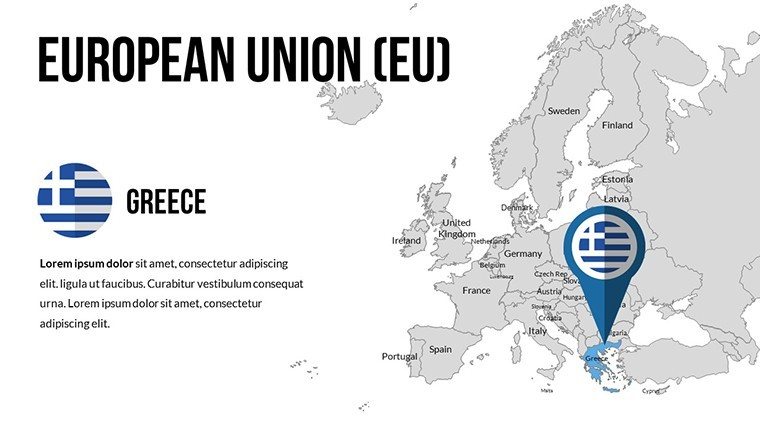
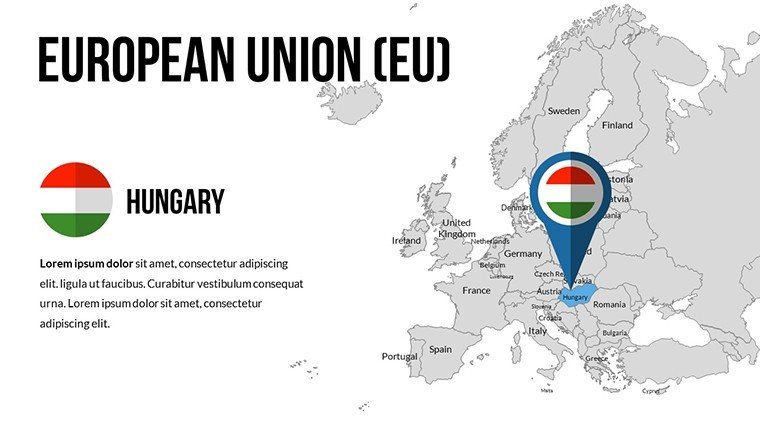
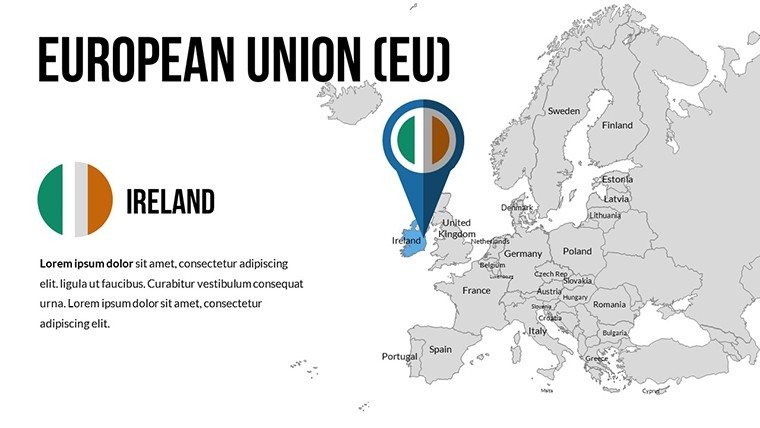
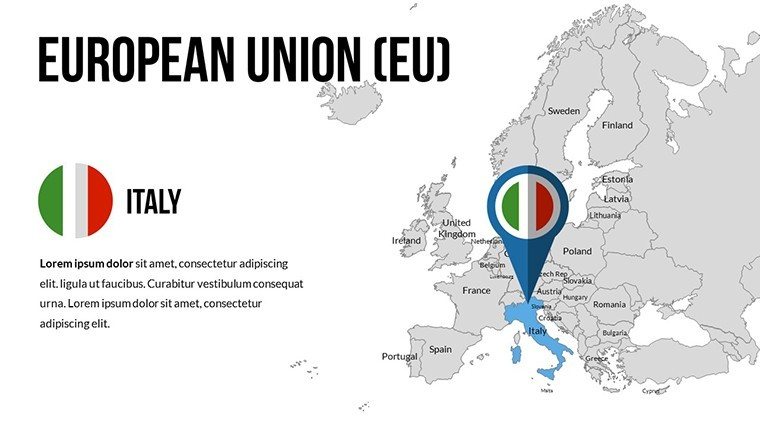
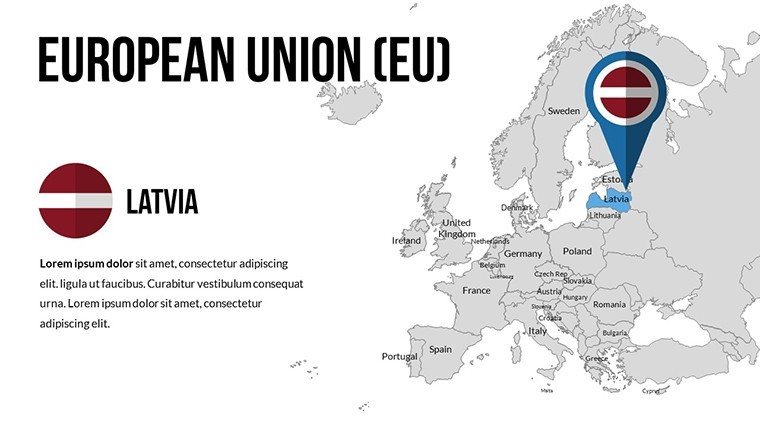
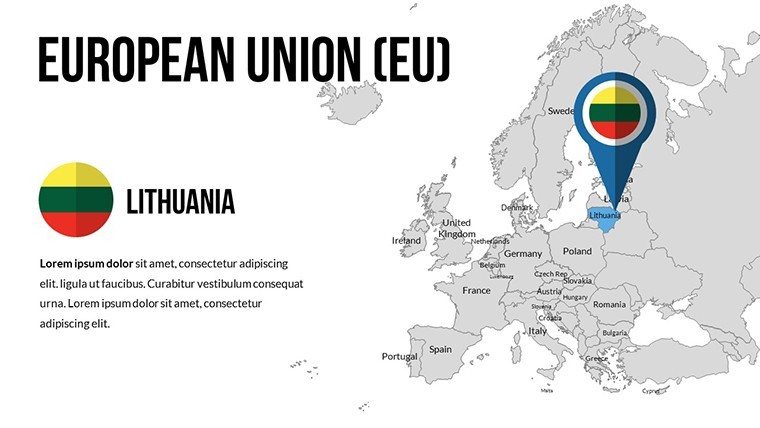
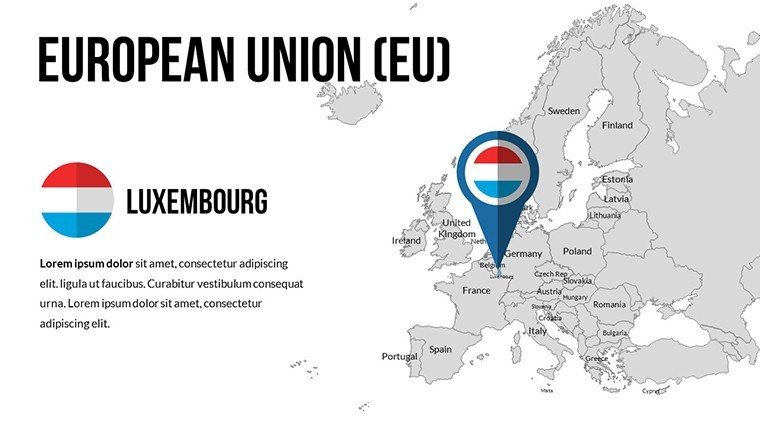
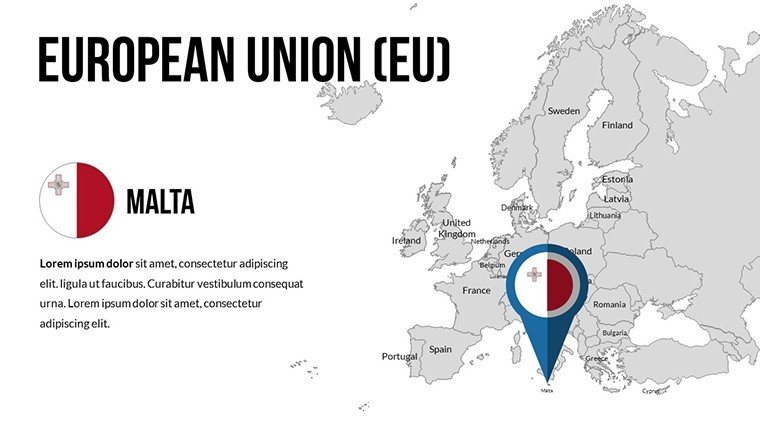
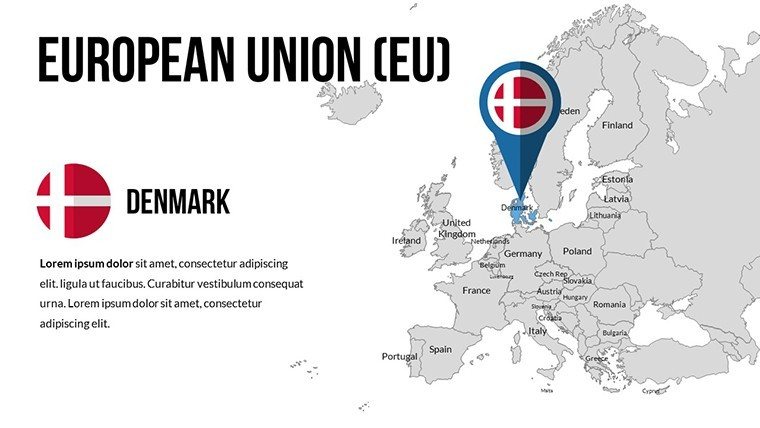
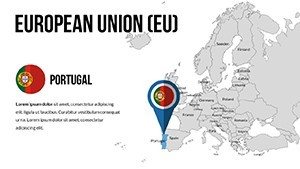
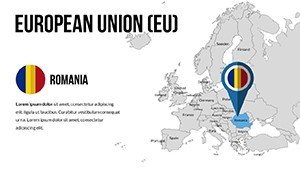
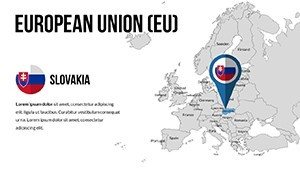
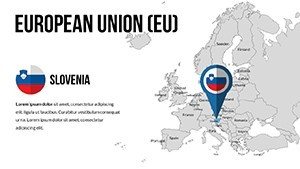
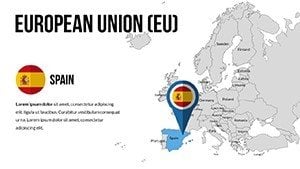
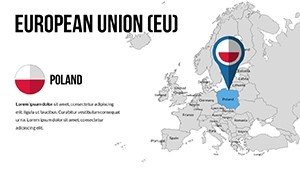
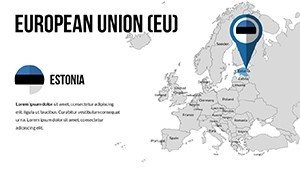
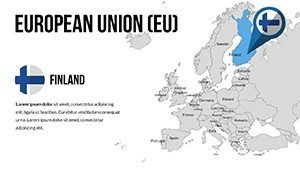
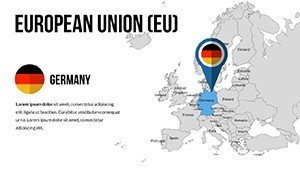
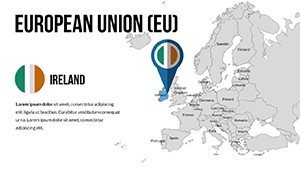
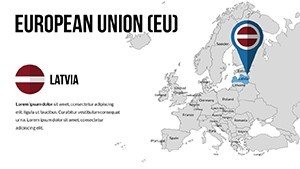
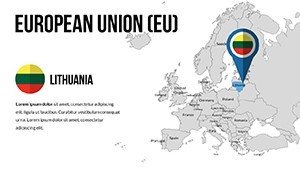
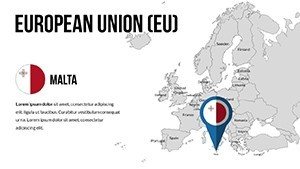
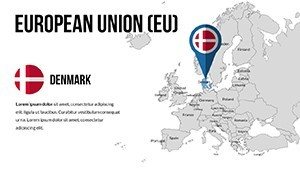
- Detailed Country Outlines: Individual maps for each EU nation, complete with capitals and major cities for granular analysis.
- Economic Infographics: Ready-to-use charts for GDP, trade balances, and unemployment rates integrated seamlessly.
- Cultural and Political Layers: Overlays for language distributions, voting patterns, or environmental zones.
- Scalable Vectors: Maintain quality when resizing for detailed zooms or overview slides.
- Branded Customization: Adjust to institutional colors, such as EU blue, for cohesive branding.
These capabilities provide a robust foundation for sophisticated presentations.
Case Studies in EU Context
An EU policy think tank utilized this template to visualize migration flows, influencing a key report cited in parliamentary debates. In business, a consulting firm mapped market penetration in Eastern Europe, aiding client expansions and yielding measurable ROI increases.
Customization Workflow Simplified
- Import the template into PowerPoint and choose a thematic slide.
- Edit data points using built-in editors for instant updates.
- Add annotations or hyperlinks to EU directives for depth.
- Animate transitions to simulate policy evolutions over time.
- Export for sharing in PDF or video formats.
This method streamlines preparation, allowing focus on insights rather than design.
Advantages Over Generic Tools
Basic PowerPoint maps often lack EU-specific details, leading to inaccuracies. Our template excels with pre-populated data layers, outperforming online alternatives in offline functionality and customization depth. For example, during an EU summit preparation, it enabled rapid iterations that standard tools couldn't match.
Seamless Tool Integration
Combine with EU databases for live data pulls or use alongside GIS software for advanced mapping. Tips from geopolitical experts emphasize using proportional symbols for data representation - our template supports this natively.
Pro Tips for EU Presentations
- Focus on relevance: Tailor maps to audience interests, like economic ties for investors.
- Use hierarchies: Start with union-wide views before drilling down.
- Ensure neutrality: Avoid biased color choices in political contexts.
- Incorporate feedback: Test slides for clarity in multicultural settings.
These strategies enhance comprehension and respect diverse perspectives.
Transform your EU narratives today - download this comprehensive PowerPoint Maps Template and lead with visual authority.
Frequently Asked Questions
- How detailed are the EU country maps?
- They include borders, capitals, and major regions, fully editable for specific needs.
- Does it support data from Eurostat?
- Yes, easy integration for accurate, up-to-date statistics.
- Can I add custom layers?
- Certainly, overlay your own data like tourism stats or infrastructure.
- Is it updated for post-Brexit EU?
- Yes, reflects the current 27 member states accurately.
- What file formats are available?
- Primarily .pptx, with export options to other formats.