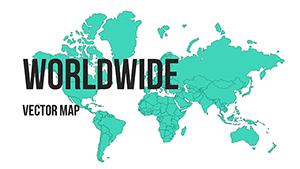
PowerPoint Maps Template for Global Data


Type: PowerPoint Maps template
Category: World
Sources Available: .pptx
Product ID: PM00164
Template incl.: 10 editable slides
As a presentation designer who`s crafted decks for Fortune 500 execs and UN policy briefings, I know the power of a well-mapped narrative. This PowerPoint maps template isn`t just a set of slides - it`s your strategic ally for distilling worldwide trends into crystal-clear visuals that command boardrooms and lecture halls alike. Imagine briefing investors on market expansions without the clutter of spreadsheets; instead, you reveal growth hotspots across continents with a single, animated overlay. Tailored for professionals who present global data weekly, this template equips you with 10 fully editable slides that blend cartographic accuracy with infographic flair, ensuring your audience grasps complexities at a glance.
What sets this apart is its focus on real-world applicability: from tracking supply chain ripples in Asia to illustrating climate policy impacts in the Americas. Compatible with PowerPoint 2016 and later, plus seamless Google Slides import, it saves hours of manual mapping. I`ve used similar setups to help a logistics firm visualize route optimizations, turning a routine quarterly review into a strategic pivot point. Whether you`re a consultant mapping client footprints or an educator charting historical migrations, this template elevates your delivery from informative to unforgettable. Dive in, layer your data, and watch engagement soar - because in high-stakes presentations, geography isn`t background; it`s the backbone.
Core Components: Building Blocks for Dynamic Global Mapping
At its heart, this PowerPoint maps template offers a curated arsenal of slides designed for depth and flexibility. Each one starts as a blank canvas primed for your inputs, but packed with smart elements that anticipate common global data challenges.
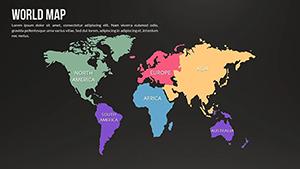
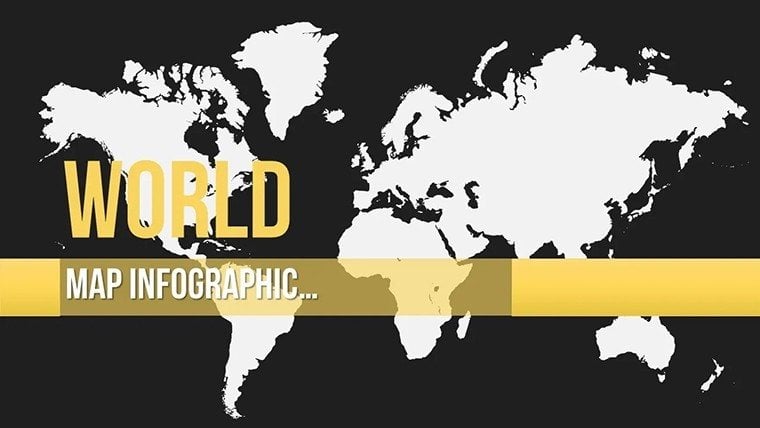
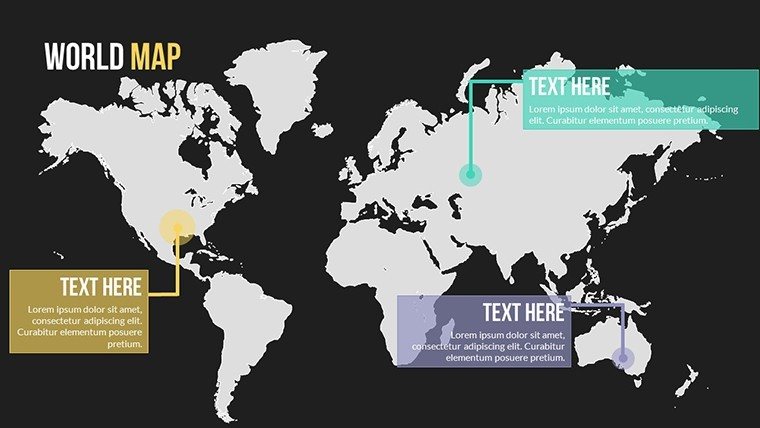
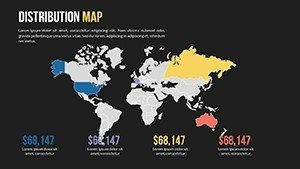
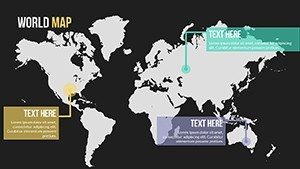
World Overview Slide: The Command Center for Continental Narratives
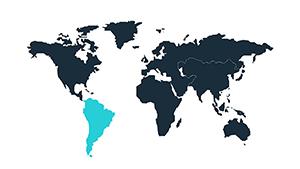
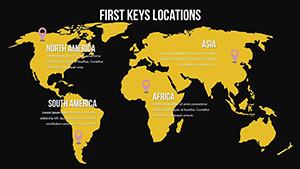
Kick off with the flagship world overview slide - a high-resolution base map that spans from Arctic outposts to Antarctic research stations. I`ve layered it with client revenue streams during a venture capital pitch, highlighting untapped regions in Africa with subtle glow effects. Customize continents by color-coding economic indicators, then animate reveals to guide viewers from macro trends to micro details. It`s perfect for setting the stage in strategy sessions, where one glance conveys the full scope of your global operations.
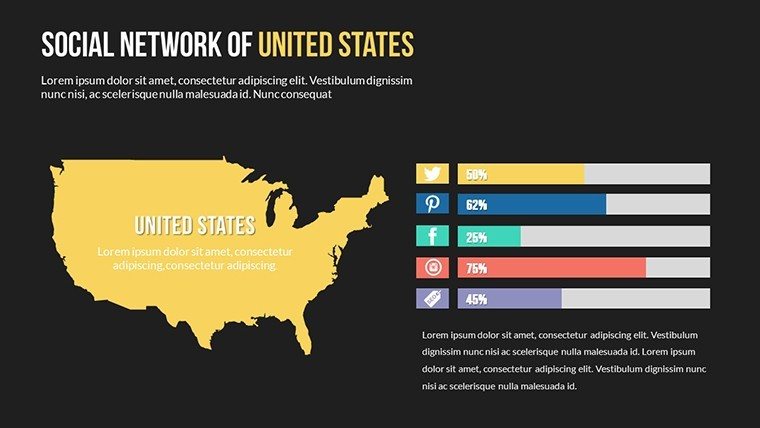
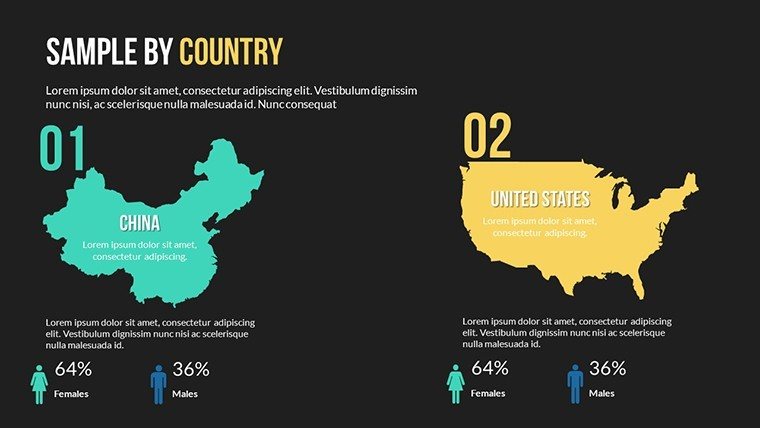
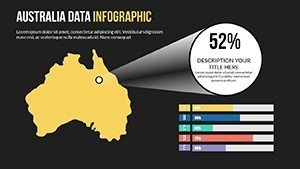
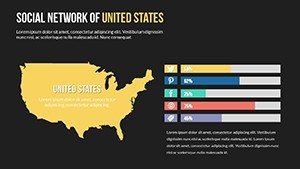
Regional Spotlights: Zooming into Key Territories Like USA and Australia
Next, drill down with targeted regional maps, including a detailed USA layout for social metrics and an Australia-focused view for environmental datasets. In a recent government advisory deck, I populated the USA slide with population density overlays to underscore urban policy needs - data linked directly from Excel for live updates. The Australia slide, meanwhile, handled drought impact visualizations, using gradient fills to show severity gradients. These aren`t static images; they`re interactive frameworks where pins drop on demand, revealing footnotes or charts on hover.
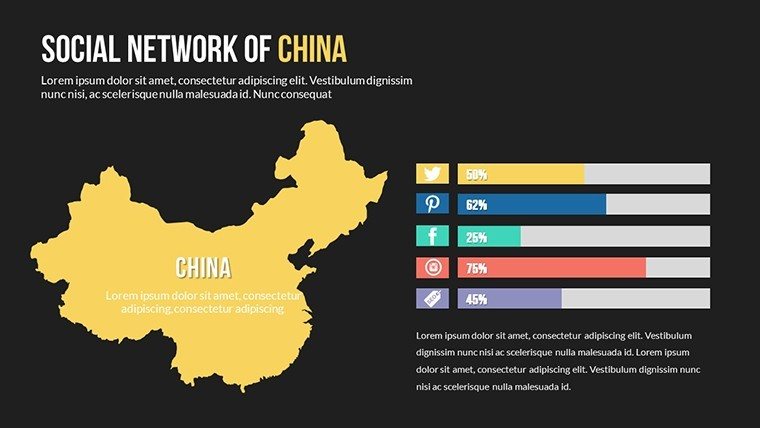
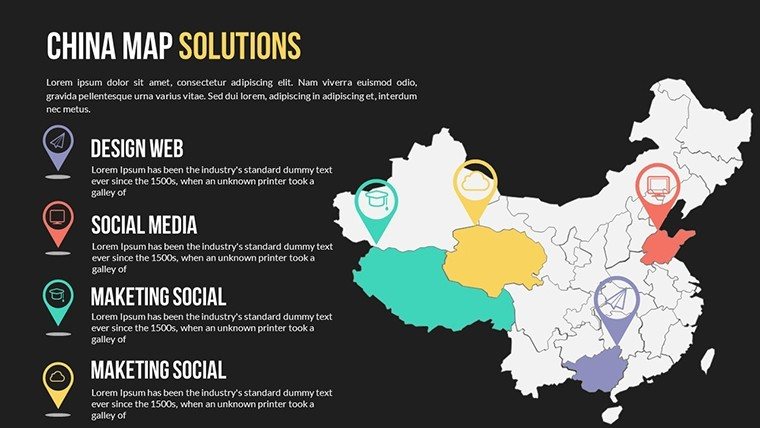
China and Europe Modules: Tailored for High-Growth and Heritage Analyses
For Asia-Pacific dominance, the China module shines with urban sprawl templates and innovation hubs marked for tech ecosystem mapping. Paired it with a startup founder`s investor roadshow to plot manufacturing shifts - resulting in clearer funding asks. Europe`s slide, conversely, excels at heritage trade routes or EU regulatory flows, with riverine paths that animate to trace historical influences. Both support multi-layer stacking, so you can superimpose current events over baseline geographies without losing clarity.
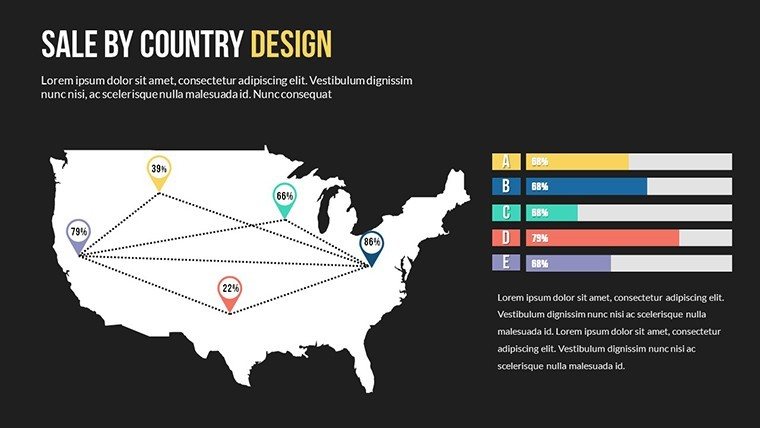
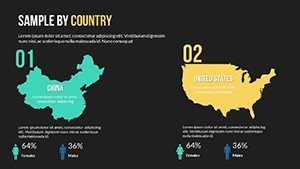
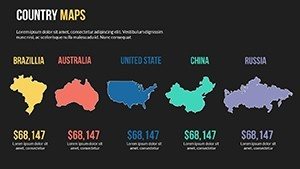
Infographic Integrations: Flows, Distributions, and Sales Trackers
Infuse life with built-in elements like arrow flows for migration patterns or bubble distributions for resource spreads. The sales country tracker slide, for instance, uses proportional sizing to depict market shares - I`ve scaled it for a retail chain`s expansion report, where bubble pops revealed quarterly variances. All components scale vectorially, maintaining sharpness whether projected on a 100-inch screen or exported to PDF briefs.
Seamless Workflow: From Data Dump to Deck Delivery in Under an Hour
Integrating this PowerPoint maps template into your routine is straightforward, leveraging native tools you already know. Start by importing your dataset - CSV or Excel - into linked tables that auto-populate map markers. I typically spend five minutes aligning colors to brand guidelines, then another ten scripting animations via PowerPoint`s timeline. For collaborative tweaks, export to Google Slides where team comments flag revisions without version chaos.
In practice, this means prepping a crisis response deck overnight: pull logistics data, overlay disruption zones on the world slide, and sequence reveals to match your talking points. No need for external plugins; everything runs on stock PowerPoint features, from shape morphing for fluid transitions to hyperlink hotspots linking to source docs. It`s this efficiency that lets me iterate decks for C-suite reviews without sacrificing sleep - proven in back-to-back client calls where time is the scarcest resource.
Real-World Applications: How Pros Across Sectors Leverage These Maps
Consultants and Analysts: Navigating Market Volatilities with Mapped Precision
For strategy consultants, this template demystifies international expansions. Picture advising a manufacturing CEO on tariff impacts: use the Europe module to shade affected trade corridors, animating phased rollouts that sync with your forecast narrative. In one engagement, this approach clarified a 15% cost shift across borders, prompting immediate supplier diversifications. It`s not hype - it`s the visual rigor that turns data skeptics into advocates.
Educators and Trainers: Bringing Global Histories to Life in Classrooms
University lecturers swear by these for interactive seminars. An economics prof I collaborated with mapped colonial trade winds on the world overview, using distribution flows to trace commodity paths - students engaged deeper, citing visuals in essays over rote stats. Adapt for workshops too: overlay current events like geopolitical tensions, fostering discussions that stick long after the slide advances.
Founders and Investors: Pitching Visions with Geographic Storytelling
Startup pitches thrive on ambition, but numbers alone fall flat. Founders I`ve coached layer user growth on the China slide, pinpointing viral hotspots to justify scaling bets. Investors respond to the spatial logic - seeing clusters in Southeast Asia validates go-to-market plans. One founder credited a similar map for securing seed rounds, as it spatially articulated TAM in ways spreadsheets couldn`t.
Managers in Government and Non-Profits: Policy Briefs That Resonate Locally
Public sector pros use it for impact reports. A non-profit director mapped aid distributions on the Australia slide during a donor summit, with flows illustrating reach from coastal hubs to outback communities. The result? Heightened commitments, as donors visualized equity gaps. For policymakers, the GPS-style slide plots legislative footprints, making abstract reforms tangibly trackable.
Edge Over Defaults: Why This Template Outpaces Built-In Tools
PowerPoint`s native maps are functional but forgettable - basic outlines without the infographic depth or animation presets that demand custom builds. This template bridges that gap, pre-engineering layers and interactions that would take days to DIY.
| Aspect | Default PowerPoint Maps | This PowerPoint Maps Template |
|---|---|---|
| Customization Depth | Limited to basic fills and labels; no built-in infographics. | Vector layers for 3D effects, color gradients, and embeddable charts - tailor to themes in minutes. |
| Data Integration | Manual entry; no linked tables for updates. | Excel-linked inputs auto-refresh markers; ideal for live demos. |
| Animation Capabilities | Basic fades; requires add-ons for paths. | Pre-set morphs for flows and reveals; enhances pacing without code. |
| Regional Focus | Generic world view; sparse details. | Dedicated modules for USA, China, Australia - zoom with pinpoint accuracy. |
| Cross-Platform Use | PowerPoint-only; clunky Google import. | Native .pptx with Google Slides harmony; one file, multi-tool workflow. |
This isn`t about replacing tools - it`s amplifying them. Where defaults demand design detours, this template keeps you in flow, delivering polished outputs that feel bespoke.
Use Cases Spanning Industries: From Tech to Sustainability
- Tech Sector: Map API adoption rates across APAC using the China module, animating user surges to spotlight monetization opportunities in pitches.
- Sustainability: Visualize carbon footprints on the world overview, with bubble distributions showing offset potentials - key for ESG reports that sway stakeholders.
- Healthcare: Track pandemic spreads via USA regional slides, overlaying vaccination flows to inform public health strategies in advisory sessions.
- Finance: Illustrate portfolio exposures with Europe trade paths, revealing diversification needs in investor updates.
- Retail: Pinpoint sales variances on Australia maps, using sales trackers to dissect seasonal trends for merch planning decks.
- Media: Chart audience migrations with global flows, enhancing content strategy briefs for ad buys.
Across these, the template`s modularity shines - swap elements to fit narratives, ensuring relevance without rework.
Ready to map your next win? This PowerPoint maps template is a one-time investment for lifetime versatility - grab it and redefine how you present the world.
Frequently Asked Questions
What makes this PowerPoint maps template ideal for quick global data updates?
Its linked table functionality pulls from external sources, refreshing visuals automatically as your data evolves - crucial for dynamic reports where accuracy trumps perfection.
Can I adapt these maps for non-business presentations, like academic conferences?
Absolutely; educators layer thematic overlays effortlessly, turning abstract concepts into spatial stories that captivate diverse audiences from students to peers.
How does the template handle high-resolution exports for print materials?
All elements are vector-based, ensuring crisp outputs in PDF or high-DPI formats - vital for handouts that match your on-screen impact.
Is there support for multilingual labels on the maps?
Yes, editable text fields accommodate any language, making it a go-to for international teams presenting cross-culturally.
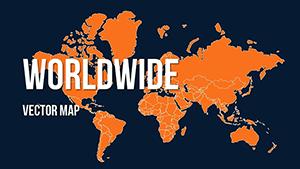
What if my presentation theme clashes with the default map styles?
Full recoloring tools let you harmonize with palettes in seconds, preserving professionalism while aligning with brand identities.
Does the license allow unlimited use across multiple projects?
One purchase grants perpetual access for personal or commercial decks - no royalties, just endless customization.