Business Maps of the World for PowerPoint - Editable PPT Templates


Type: PowerPoint Maps template
Category: World
Sources Available: .pptx
Product ID: PM00161
Template incl.: 10 editable slides
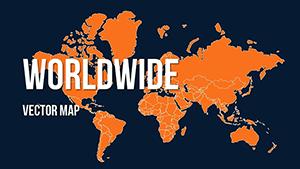
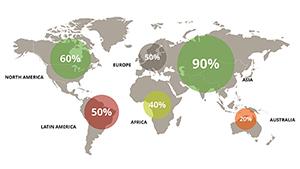
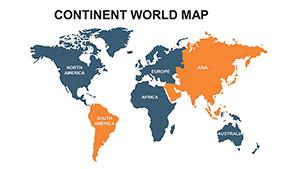
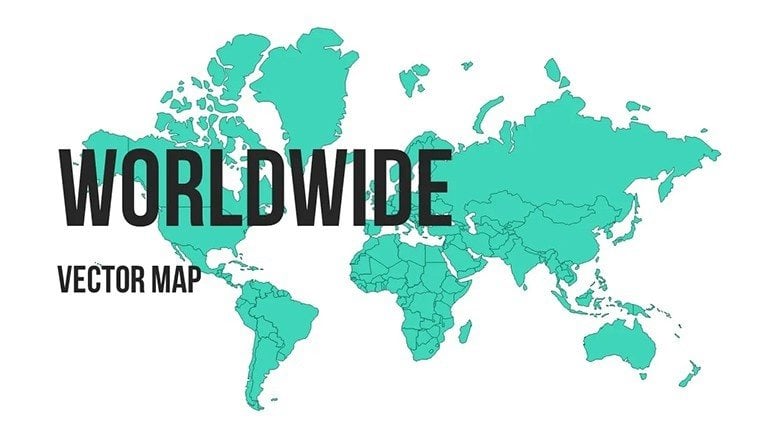
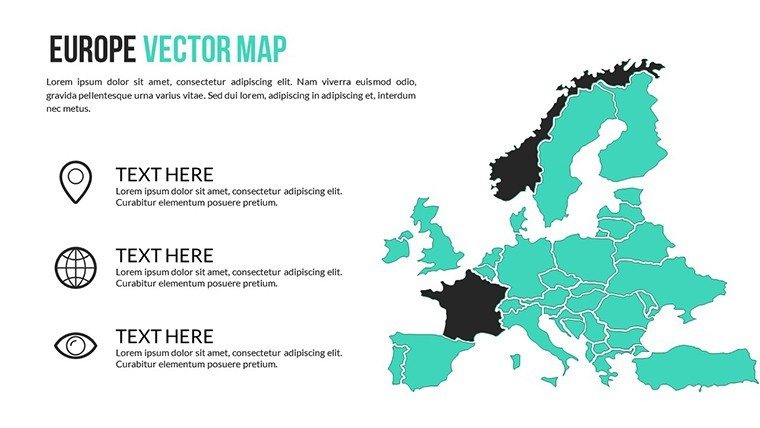
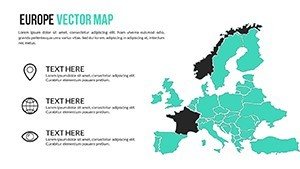
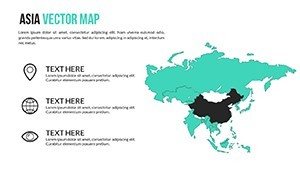
In today's interconnected economy, understanding global dynamics is key to business success, and our Business Maps of the World PowerPoint Template provides the perfect canvas to paint those insights. With 10 editable slides featuring vector maps of continents from Asia's bustling markets to Europe's innovation hubs, this tool is tailored for executives who need to articulate strategies with visual prowess. Whether plotting international trade routes or analyzing demographic shifts, it helps you deliver presentations that not only inform but inspire action, much like how Fortune 500 companies use geospatial data to drive decisions.
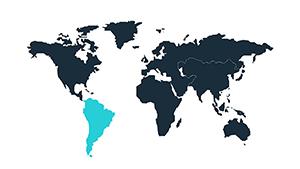
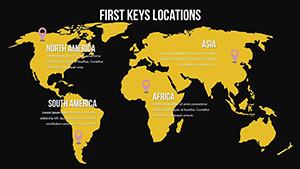
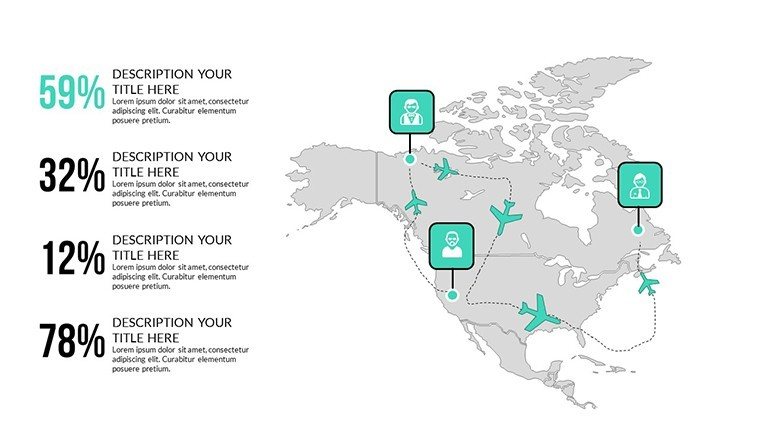
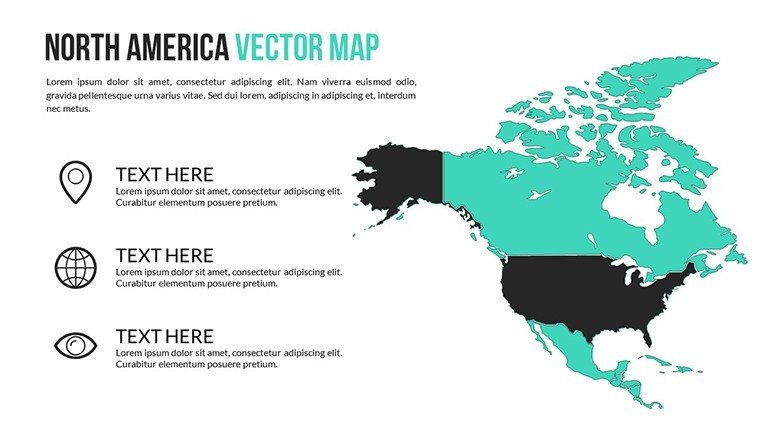
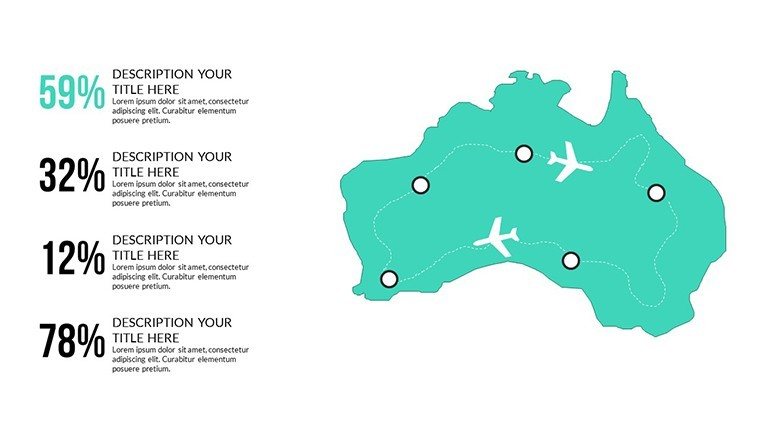
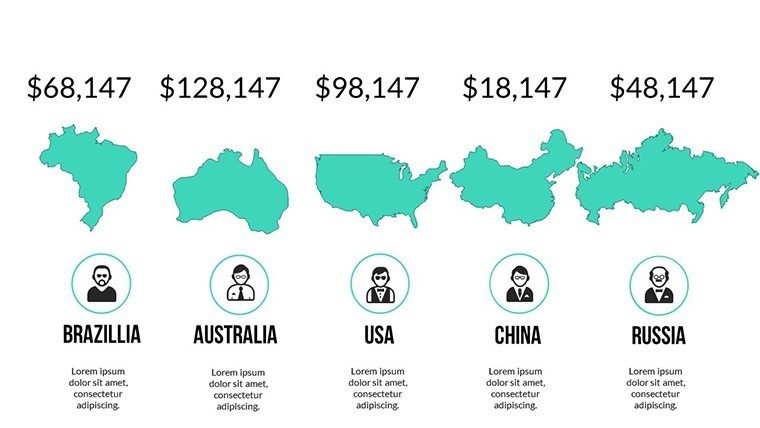
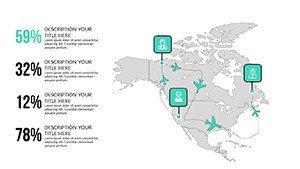
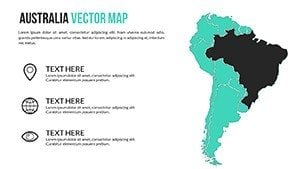
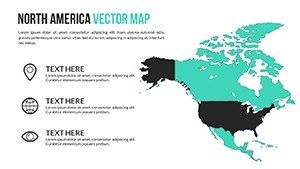
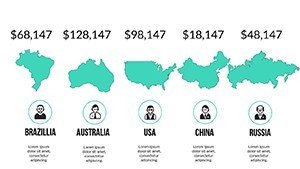
The template's emphasis on worldwide coverage allows for nuanced depictions - imagine a slide zooming into North America's tech corridors, with pins marking Silicon Valley investments contrasted against South America's resource-rich landscapes. This versatility addresses the needs of diverse audiences, from board members reviewing expansion plans to analysts forecasting trends in emerging markets like Brazil or India.
Core Features for Strategic Visualization
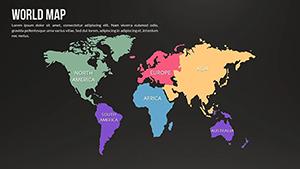
At its heart, the template offers robust customization: Alter colors to denote risk levels in global supply chains, add pins for key locations like Shanghai's ports, or adjust labels for clarity in multilingual presentations. Compatibility across PowerPoint versions ensures no hiccups, while the user-friendly interface means even those new to design can produce polished outputs swiftly.
For a market expansion strategy, start with the full-world view slide, then segment into continental breakdowns. Overlay data from sources like World Bank reports, showing GDP per capita with heat maps - red for high-growth Asia-Pacific versus cooler tones for stable but slower North America.
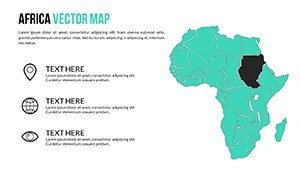
- Pin and Label Tools: Highlight specific cities or regions, essential for tourism reports on landmarks like the Eiffel Tower or Great Wall.
- Brand Alignment: Match your corporate colors and fonts for cohesive branding.
- Seamless Integration: Works with other tools like Excel for live data updates.
This surpasses basic maps by providing vector quality that scales perfectly, avoiding the blurriness that plagues free alternatives.
Practical Use Cases in Business and Beyond
In international trade presentations, use it to map supply chains disrupted by events like the Suez Canal blockage, with arrows illustrating reroutes via the Cape of Good Hope. Economic trend analyses benefit from layered visuals, such as shading countries by inflation rates, drawing on IMF data for credibility.
For cultural research, non-profits can visualize migration patterns, pinning origin and destination countries to advocate for policies. In education, it serves academic projects on globalization, with students customizing slides to debate trade agreements like NAFTA versus CPTPP.
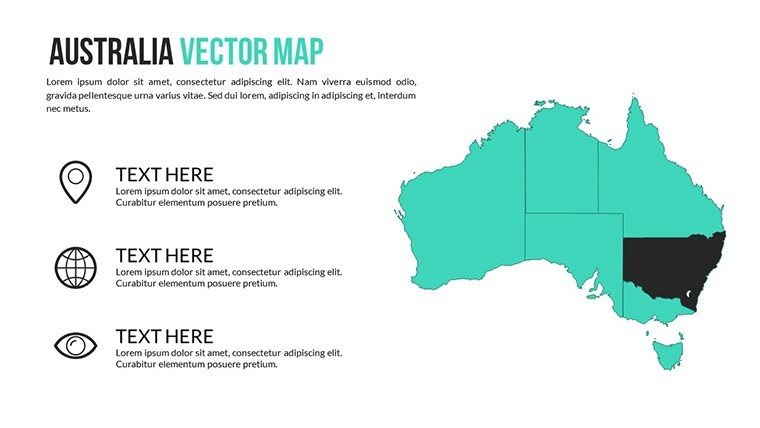
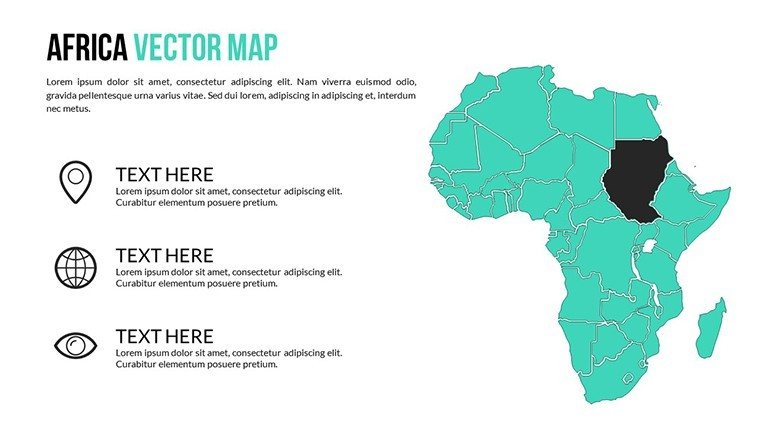
Tourism industry reports come alive by marking hotspots - Australia's reefs in vibrant blues, Africa's safaris in earthy browns - helping agencies pitch packages effectively. Workflow-wise, integrate with project management software for iterative updates, ensuring your deck evolves with new insights.
Expert Tips for Compelling Decks
Draw from design gurus like Garr Reynolds: Simplify slides to one key idea per map, use animations for progressive reveals, and end with a global overview tying back to your CTA, like "Expand your horizons - partner with us today."
Priced at $20, it's a strategic asset for any professional. Elevate your global narratives; grab this template and map your path to influence.
Frequently Asked Questions
How do I customize the maps?
Change colors, add pins, and adjust labels directly in PowerPoint for full control.
Is it compatible with older PowerPoint versions?
Yes, works seamlessly with all Microsoft PowerPoint versions.
Can I use it for non-business purposes?
Certainly, suitable for education, research, and more.
What format is the download?
Available as .pptx for easy editing.
Are the maps vector-based?
Yes, ensuring high-quality scaling without loss of detail.
How to import data?
Link to Excel or manually input for dynamic visualizations.