USA PowerPoint Maps Template: 36 Editable Slides


Type: PowerPoint Maps template
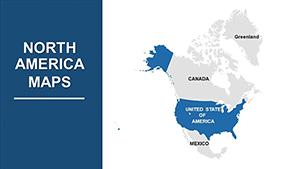
Category: North America
Sources Available: .pptx
Product ID: PM00023
Template incl.: 36 editable slides
Imagine transforming dry data into dynamic stories that captivate your audience, whether you're pitching a regional expansion strategy to executives or illustrating historical migrations in a classroom. Our USA PowerPoint Maps Template is your go-to resource for creating visually stunning presentations that highlight the diverse landscapes and insights of the United States. With 36 meticulously crafted, editable slides, this template is designed for professionals in business, education, and research who demand precision and polish in their visuals. Compatible seamlessly with Microsoft PowerPoint and Google Slides, it empowers you to customize every element - from state boundaries to color schemes - without needing advanced design skills.
What sets this template apart is its focus on real-world applicability. For business analysts mapping out market territories, educators tracing the impact of natural resources, or researchers visualizing demographic shifts, these maps turn complex information into clear, compelling narratives. Drawing from established geographic standards like those from the U.S. Geological Survey, each slide ensures accuracy while allowing creative freedom. Say goodbye to pixelated clipart or time-consuming manual drawings; instead, dive into a ready-to-use toolkit that saves hours and boosts your presentation's impact.
Unlocking the Power of Detailed State and Regional Maps
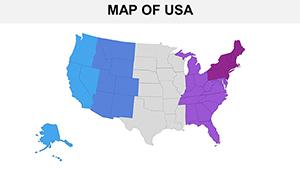
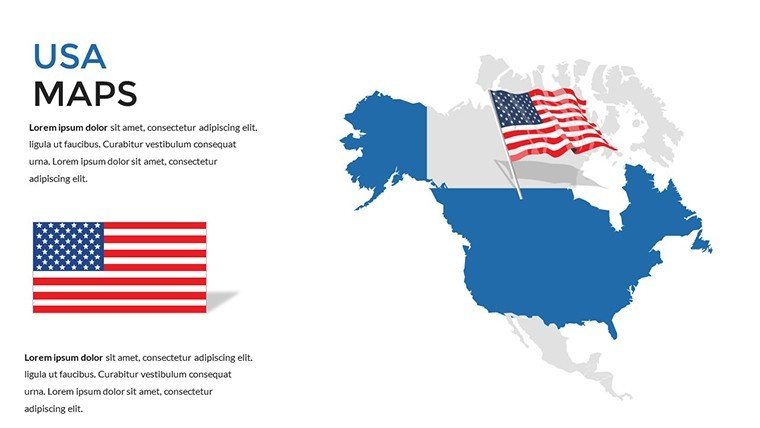
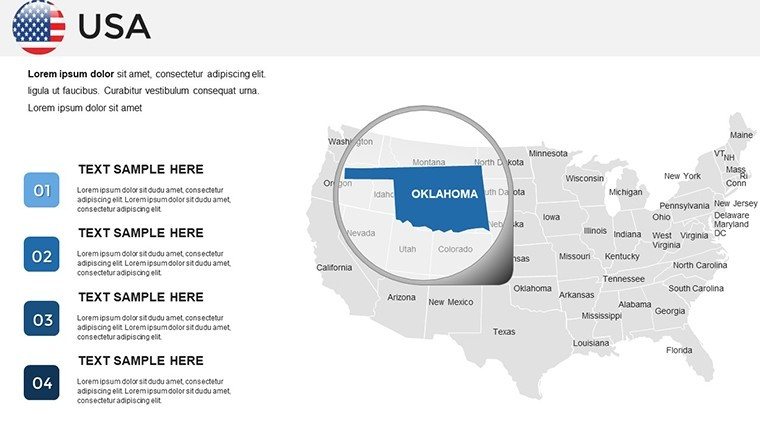
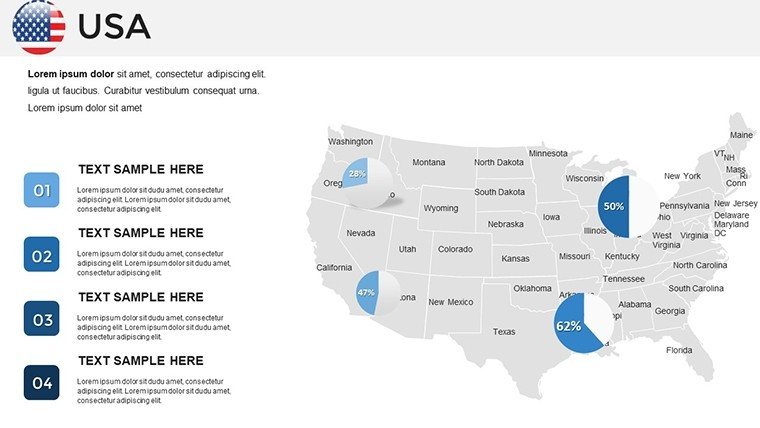
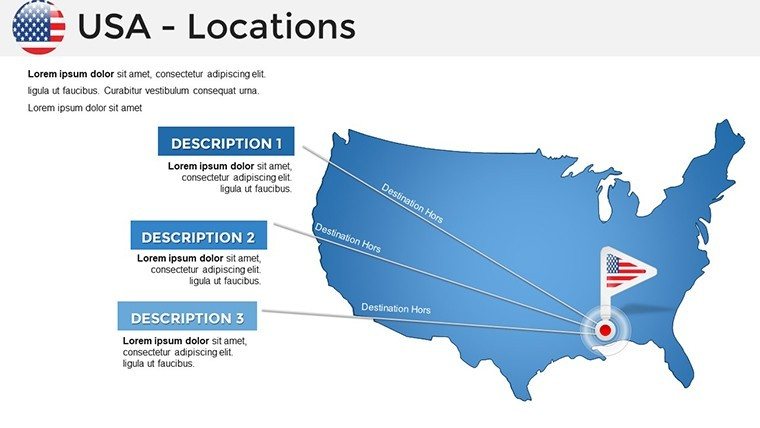
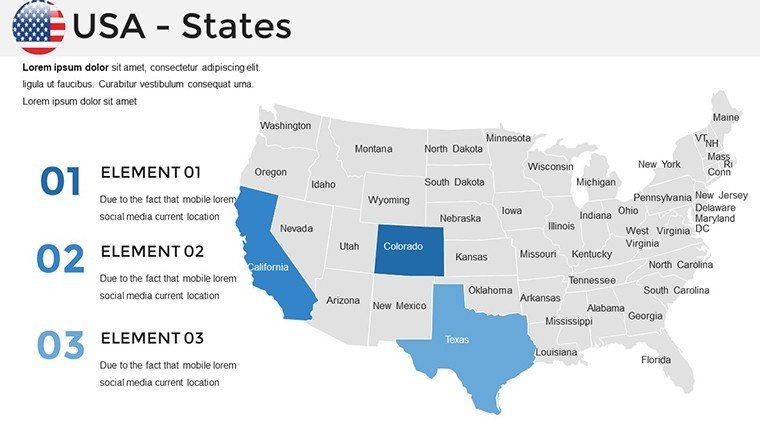
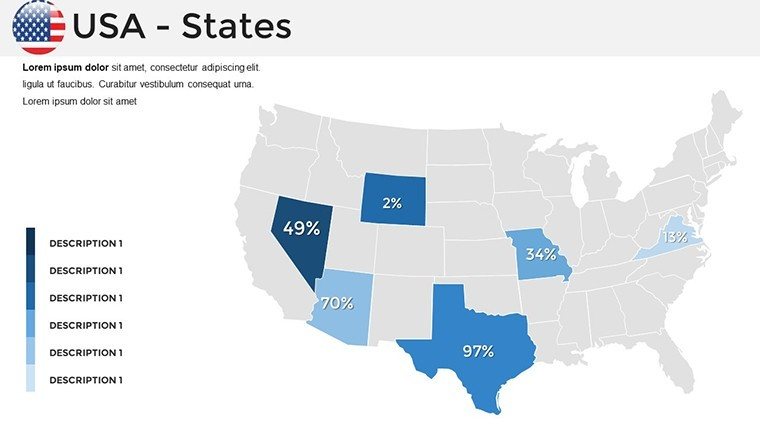
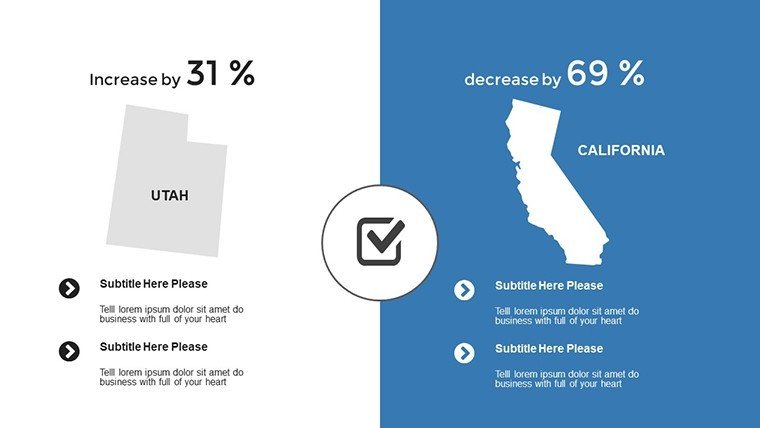
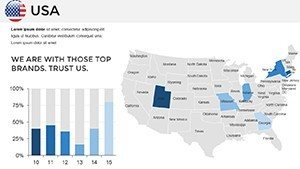
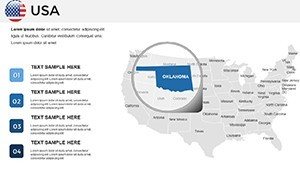
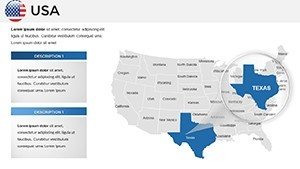
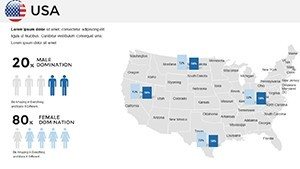
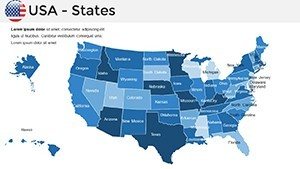
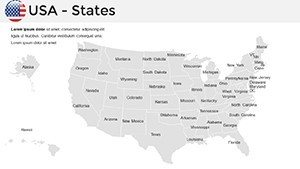
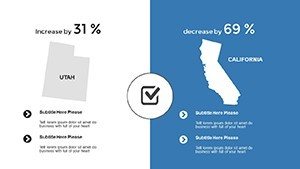
At the heart of this USA PowerPoint Maps Template are its versatile slide designs, starting with individual state maps that zoom in on specifics like California's tech hubs or Texas's energy sectors. These aren't just static images - each is vector-based for sharp scalability, letting you highlight key areas with ease. For instance, overlay sales data on a Midwest regional map to demonstrate growth patterns, or use a national overview to compare urban vs. rural populations. The template includes 12 dedicated state-focused slides, 10 regional groupings (think Northeast, South, West), and 14 national views, all interlinked for smooth transitions in your deck.
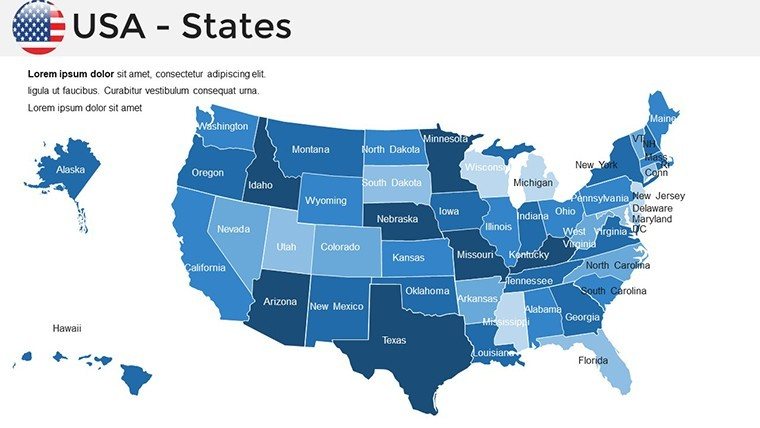
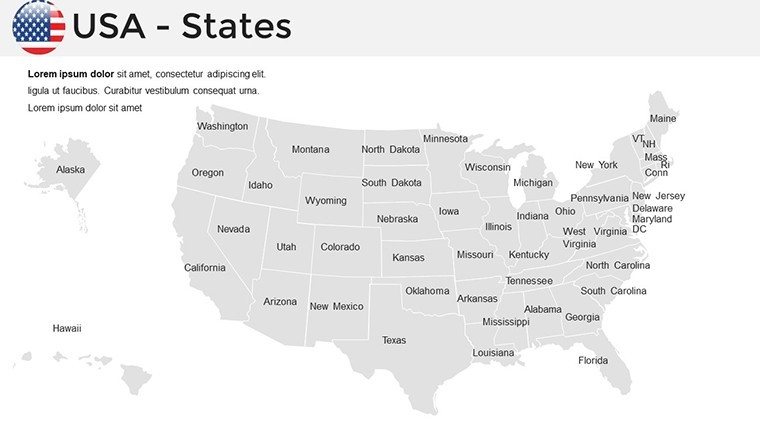
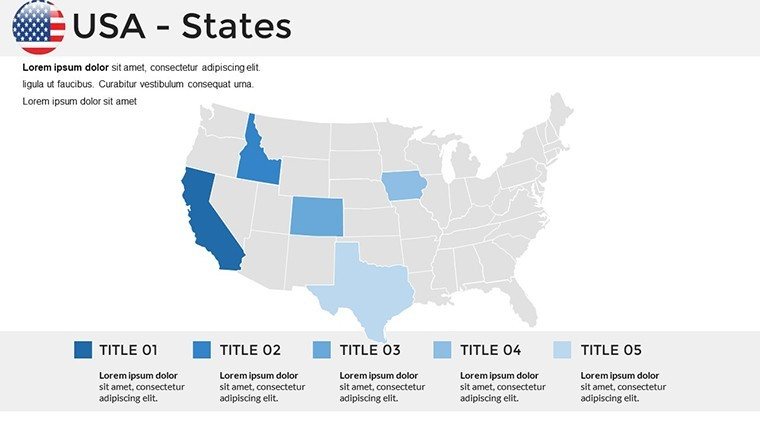
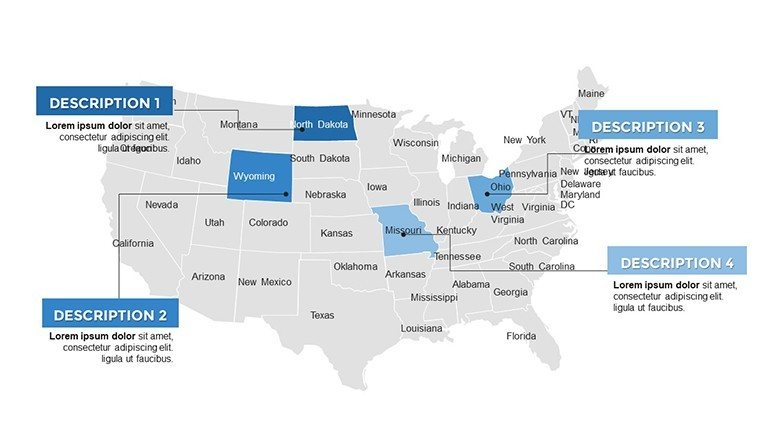
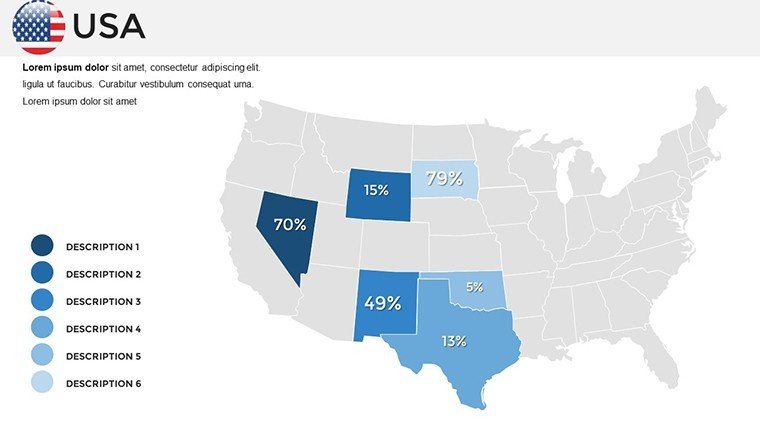
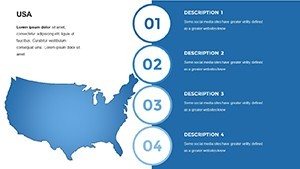
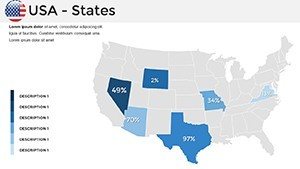
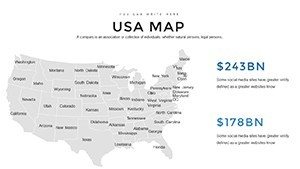
- State-Specific Slides: Drill down into any of the 50 states with pre-labeled outlines, ready for annotations on economy, climate, or population metrics.
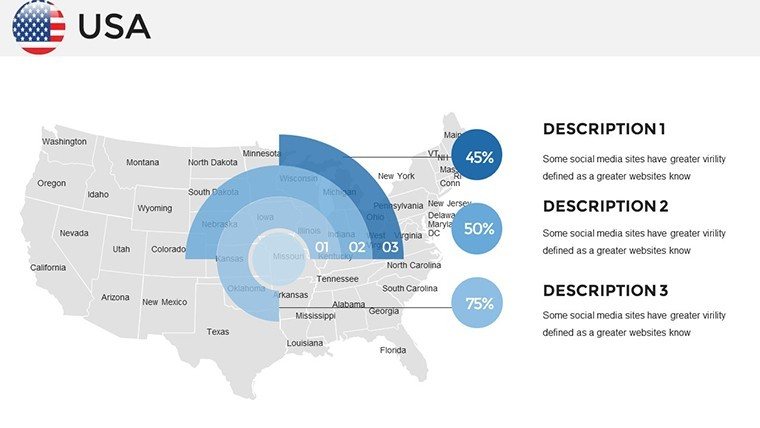
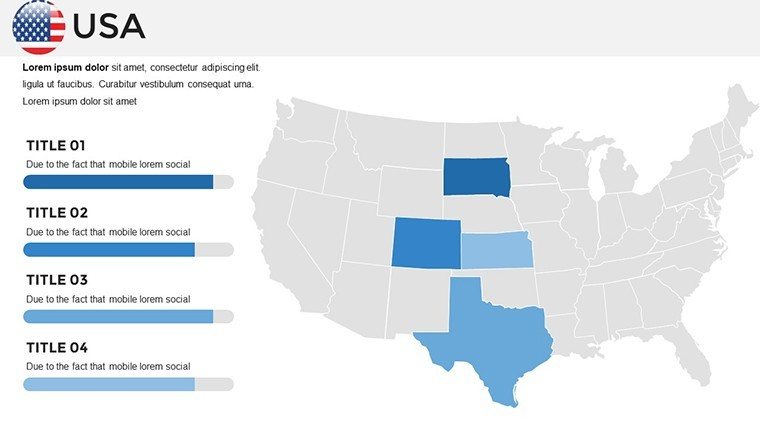
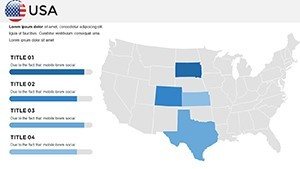
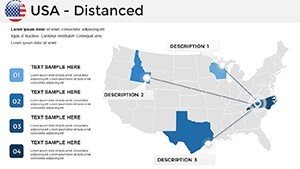
- Regional Breakdowns: Group states logically for comparative analysis, ideal for logistics planning or environmental impact studies.
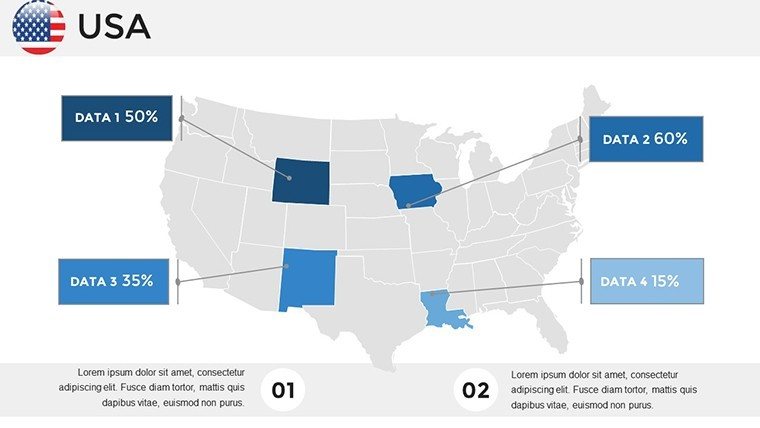
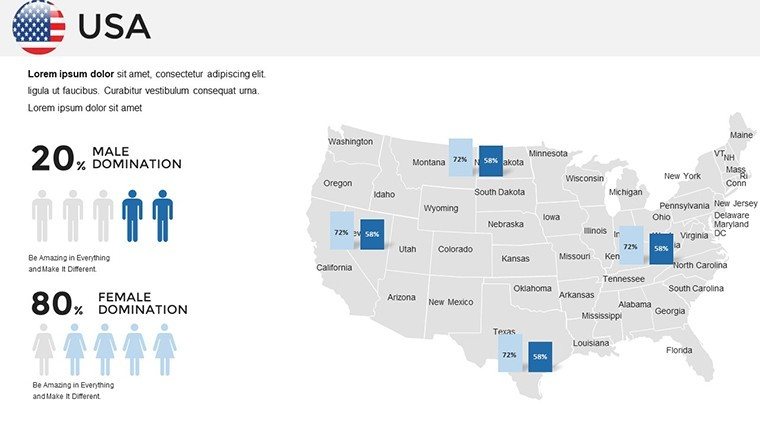
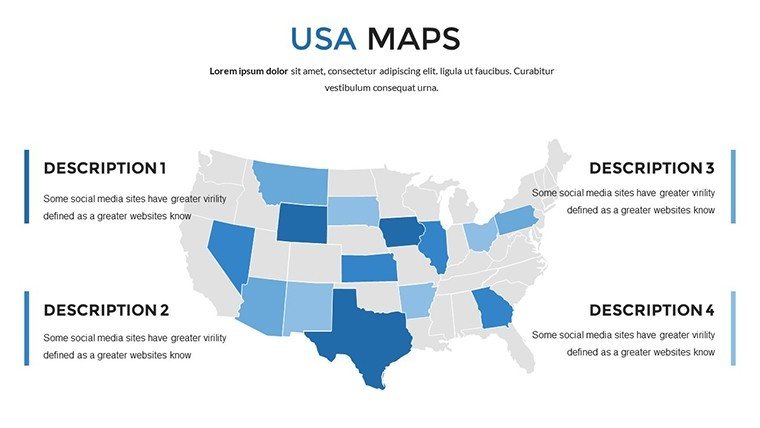
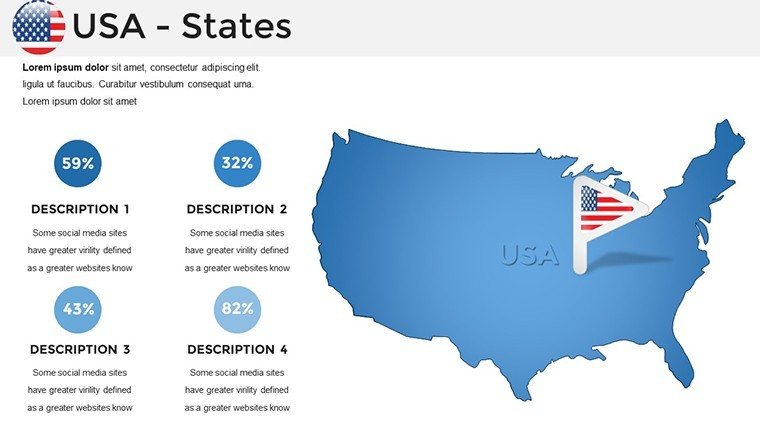
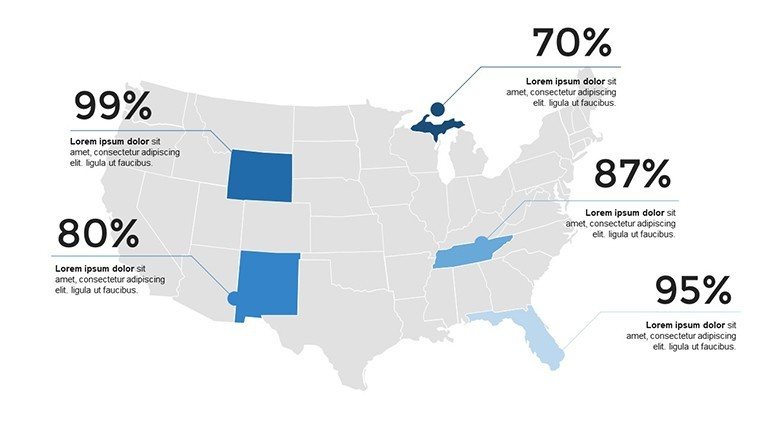
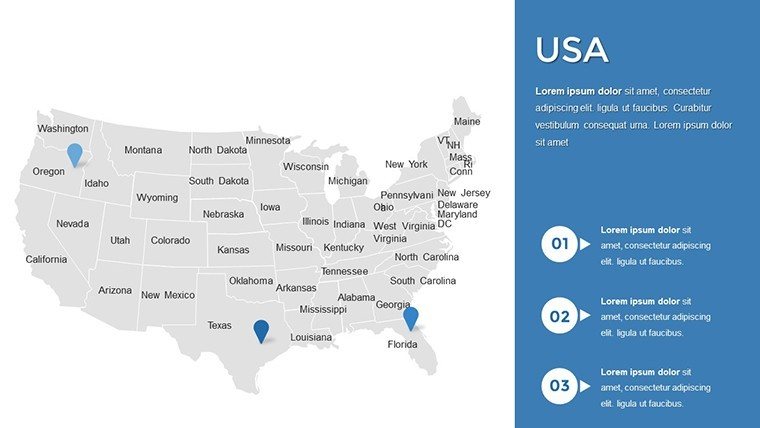
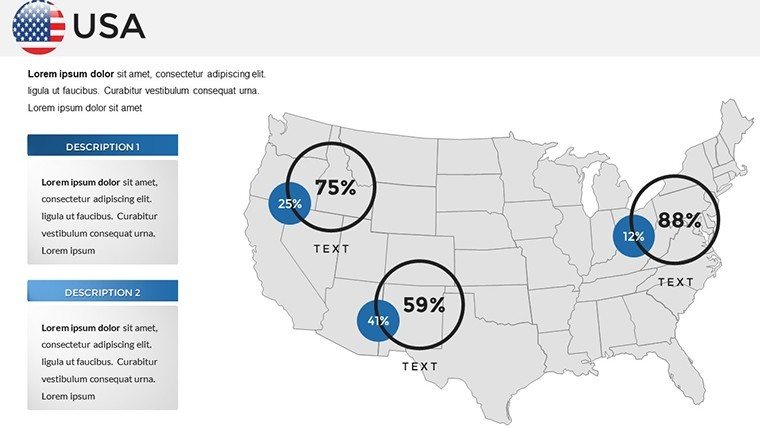
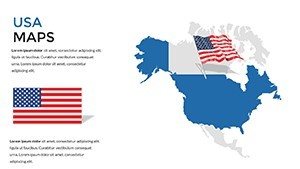
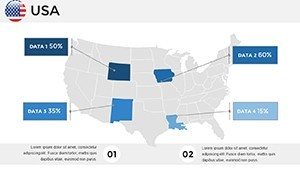
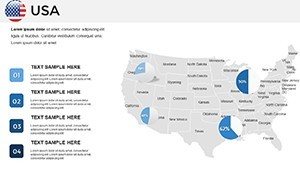
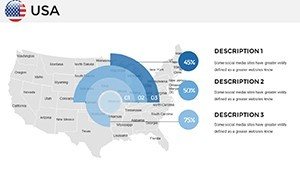
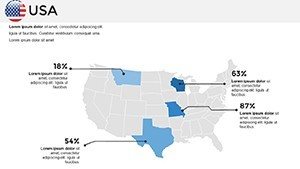
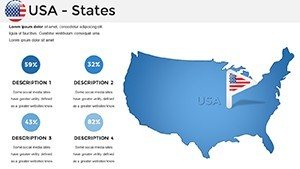
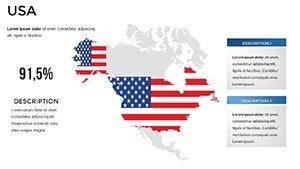
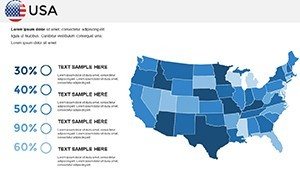
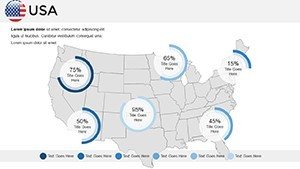
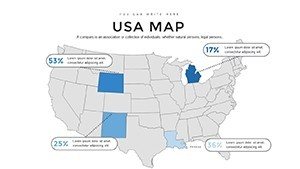
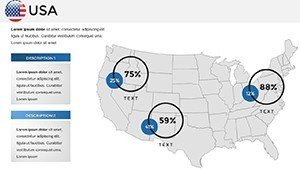
- National Overviews: Full U.S. maps with thematic layers, such as election results or infrastructure networks, to provide big-picture context.
Customization is effortless: Adjust hues to match your brand palette - perhaps vibrant blues for coastal states in a tourism pitch - or add icons for quick data points. In a real-world case, a marketing firm used similar maps to visualize customer distribution across the Southeast, resulting in a 25% increase in stakeholder buy-in during their quarterly review. This template replicates that professional edge, ensuring your visuals resonate.
Seamless Integration into Your Workflow
Integrating this template into your daily routine is straightforward. Download the .pptx file and open it in PowerPoint; the slides are organized in a logical sequence, from broad overviews to detailed insets. For Google Slides users, import without losing fidelity - perfect for collaborative teams. Add your data via simple charts or text boxes, and animate elements like state highlights to guide viewer attention. Pro tip: Pair these maps with timeline slides for chronological storytelling, such as tracking urban development from the Industrial Revolution to modern smart cities.
Beyond basics, the template supports advanced features like hyperlinks between slides, making navigation intuitive during live presentations. Whether you're preparing for a TED-style talk on American innovation or a boardroom strategy session, these tools enhance clarity and engagement. Users report saving up to 40% of prep time compared to building from scratch, allowing more focus on content that drives decisions.
Real-World Applications: From Boardrooms to Classrooms
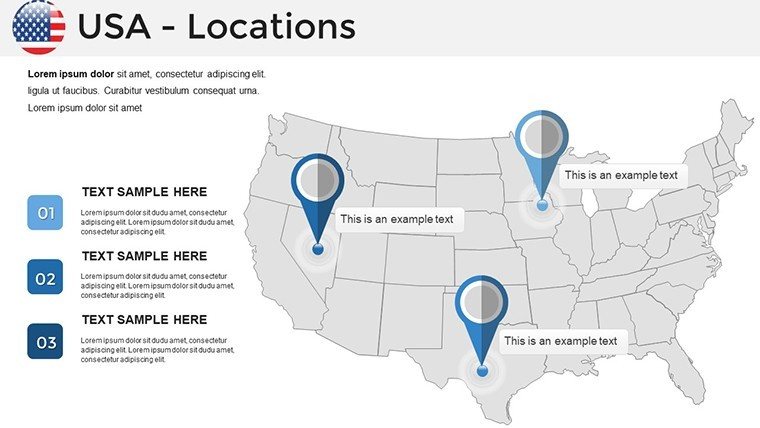
This USA PowerPoint Maps Template shines in diverse scenarios. In business, leverage it for supply chain visualizations - map supplier locations from the Rust Belt to Silicon Valley to optimize routes and reduce costs. A logistics company, for example, adapted these slides to forecast delivery times, impressing clients with data-driven foresight. For education, teachers can animate historical events, like the Lewis and Clark expedition, overlaying routes on interactive maps to spark student curiosity.
Researchers benefit too: Visualize climate change effects with heat maps on coastal states, citing data from NOAA for credibility. The template's editable nature means you can incorporate live stats, turning static presentations into dynamic discussions. In urban planning pitches, highlight zoning changes across metro areas, aligning with AIA-inspired design principles to advocate for sustainable growth. No matter the field, these maps bridge data and narrative, making abstract concepts tangible.
- Business Strategy: Use regional maps for competitive analysis, shading market share to reveal opportunities.
- Educational Outreach: Create interactive lessons on geography, with quizzes embedded via hyperlinks.
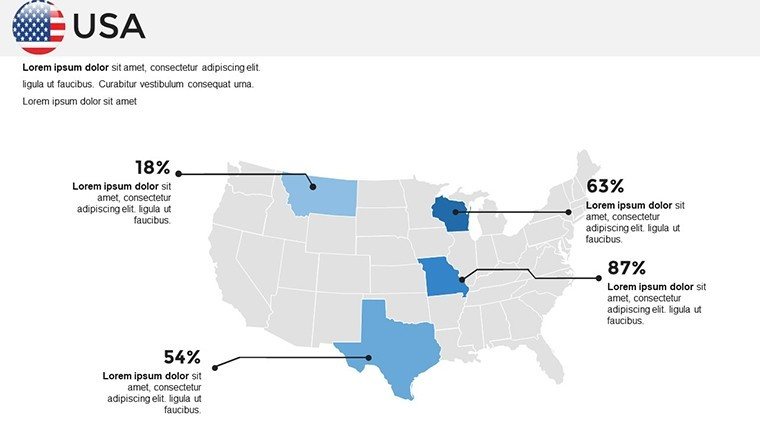
- Research Dissemination: Present survey results geographically, using color gradients for trend spotting.
- Marketing Campaigns: Map consumer demographics to tailor regional ads, boosting ROI.
Compared to default PowerPoint shapes, this template offers themed icons (e.g., factories for industry, waves for coasts) and consistent styling, ensuring a cohesive look. It's not just about aesthetics - it's about persuasion. Studies from presentation experts like those at Duarte show that visual aids like maps increase retention by 65%, giving you an edge in any forum.
Enhancing Engagement with Custom Tips
To maximize value, start by auditing your data: Which states or regions need emphasis? Then, layer in multimedia - embed short videos of landmarks or link to external resources. For humor in lighter presentations, add quirky labels like "Home of the Best Barbecue" on Southern states to humanize the content. Always test on different screens to maintain clarity, as these high-res vectors adapt flawlessly.
In corporate settings, align maps with KPI dashboards for holistic views, impressing C-suite audiences. Educators might integrate AR elements via companion apps, but even without, the slides foster interactive Q&A. This template isn't a one-off; it's a reusable asset for ongoing projects, from annual reports to grant proposals.
Why Choose This Template Over Others?
In a sea of generic map tools, our USA PowerPoint Maps Template stands out with its U.S.-centric depth and user-centric design. Unlike free online generators that lack editability, this offers full control without watermarks. Premium quality rivals tools from Esri or Tableau but at a fraction of the cost and complexity. Backed by design principles from visual communication pros, it ensures trustworthiness - your audience will see you as an expert.
Ready to map out success? Download now and customize your first slide today. Elevate your pitches, lessons, and analyses with visuals that inform and inspire.
Frequently Asked Questions
How editable are the USA PowerPoint Maps?
All 36 slides are fully editable, allowing changes to colors, labels, and shapes in PowerPoint or Google Slides.
Are these maps suitable for commercial use?
Yes, licensed for personal and commercial purposes, including client presentations and reports.
Can I add my own data to the maps?
Absolutely - import charts, stats, or images easily to overlay on any state or regional view.
Does it work with Google Slides?
Perfectly compatible; just upload the .pptx file for seamless editing and sharing.
What if I need maps for specific industries?
Tailor them for sectors like real estate (property heatmaps) or healthcare (facility distributions).
Is there support for animations?
Yes, built-in animations for highlighting areas, plus easy addition of custom transitions.