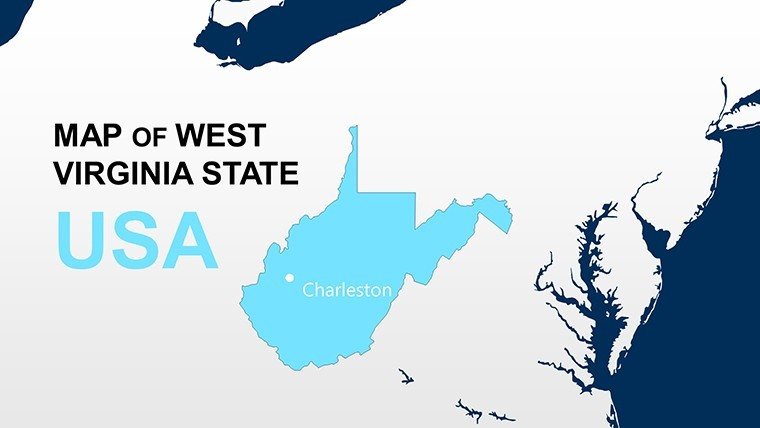
Chart West Virginia's Terrain with Expert PowerPoint Maps


Type: PowerPoint Maps template
Category: North America
Sources Available: .pptx
Product ID: PM00153
Template incl.: 28 editable slides
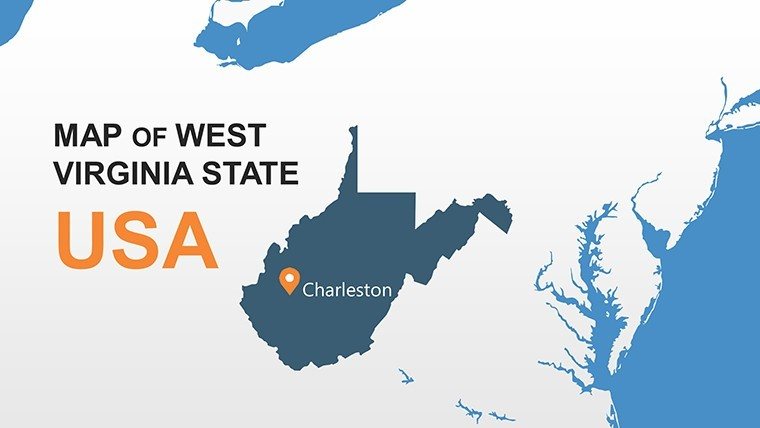
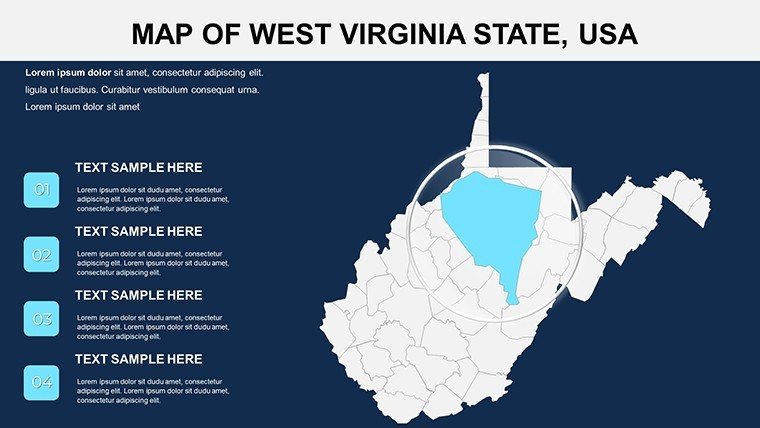
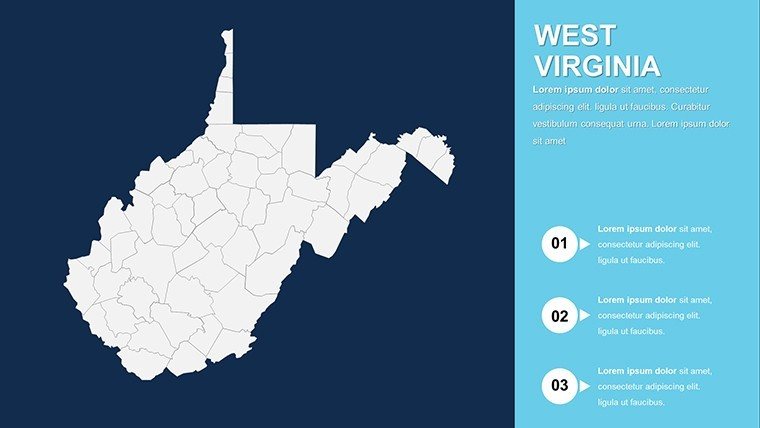
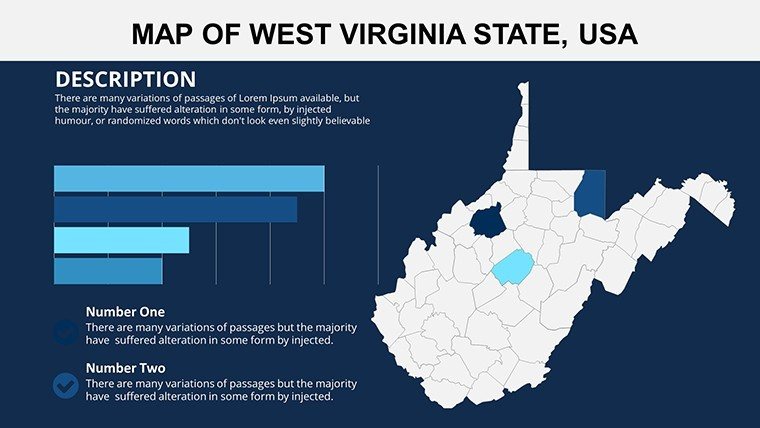
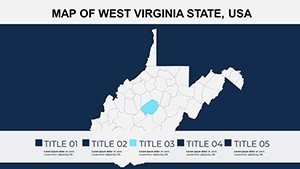
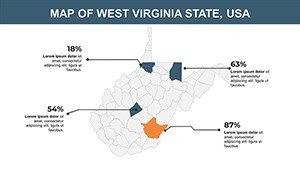
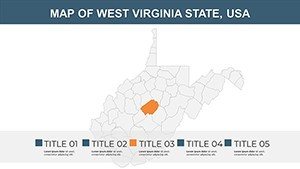
In the rugged beauty of West Virginia, architects face unique challenges: balancing mountainous topography with community needs in places like Charleston or Huntington. The West Virginia USA PowerPoint Maps Template rises to meet them, delivering 28 editable slides that map out all 55 counties with precision and panache. This template is a boon for urban planners and designers aiming to weave geographic insights into their narratives, whether proposing trail systems in the Appalachians or economic revitalizations in the Ohio Valley.
At its heart, this tool embodies architectural best practices, aligning with AIA emphases on contextual design. High-quality, scalable maps ensure your visuals remain sharp during boardroom zooms, compatible with PowerPoint 2019 and beyond. Convert to Google Slides for hybrid team sessions, where remote collaborators can annotate county boundaries for zoning tweaks. Think of it as your digital drafting table for location intelligence, slashing research time and amplifying your proposals' impact.
Essential Features Tailored for Precision Mapping
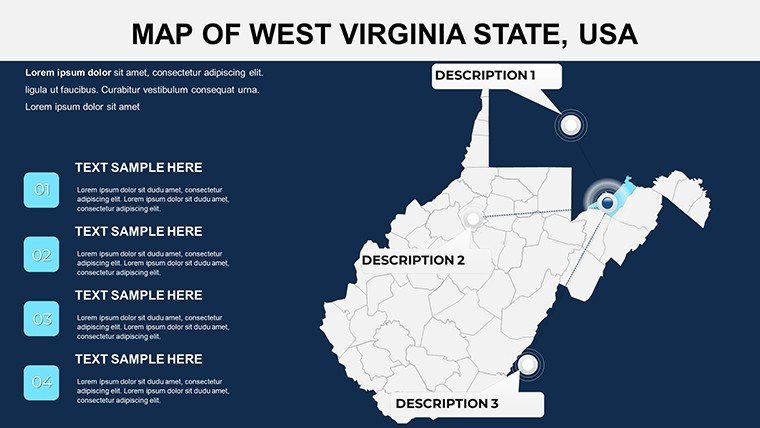
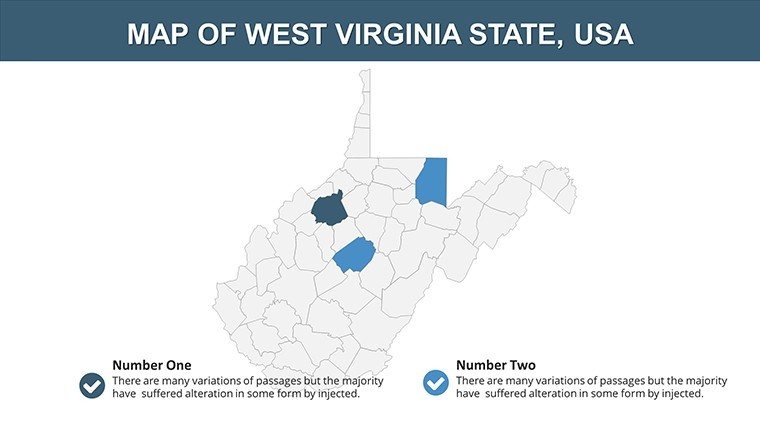
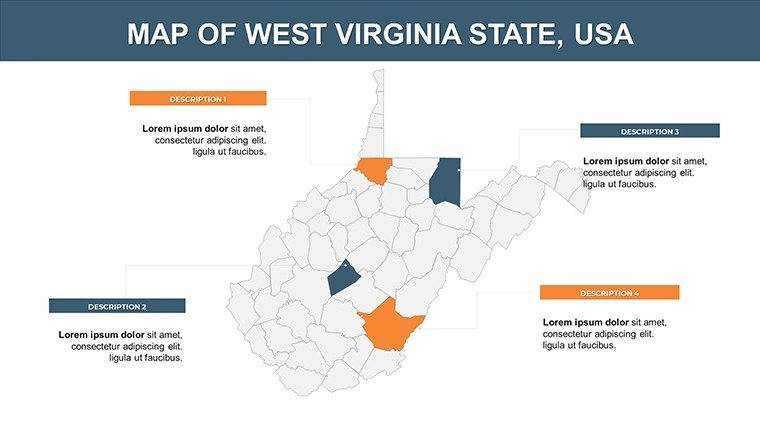
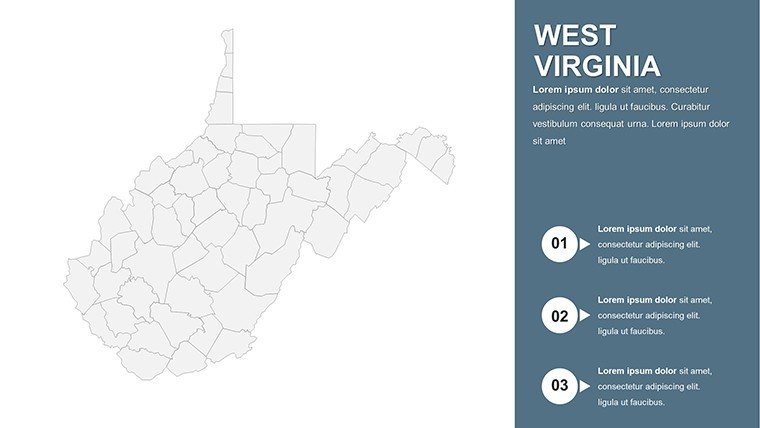
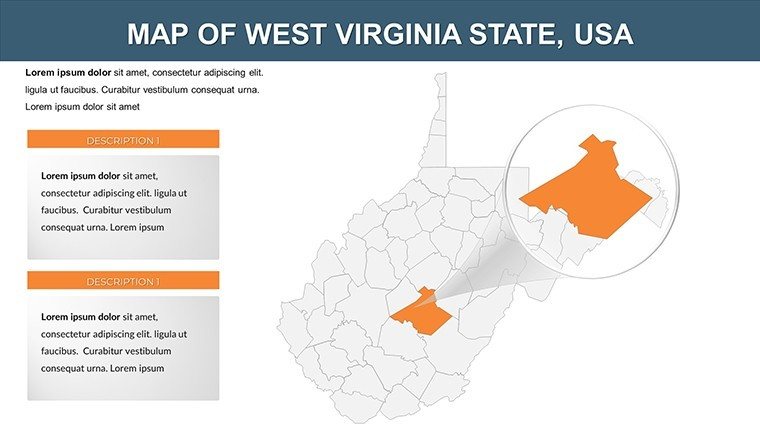
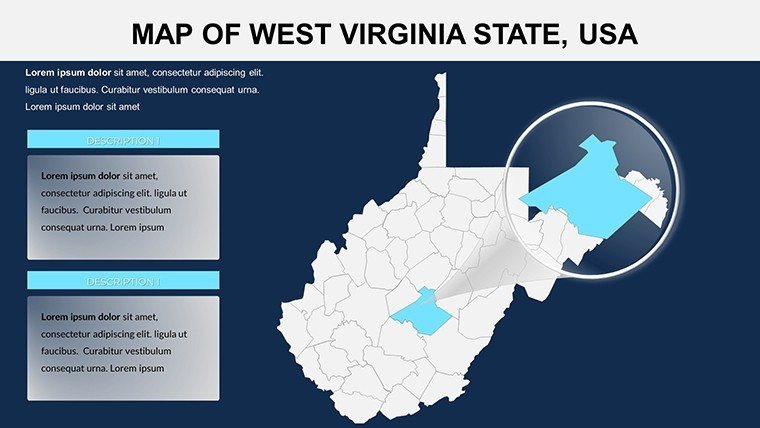
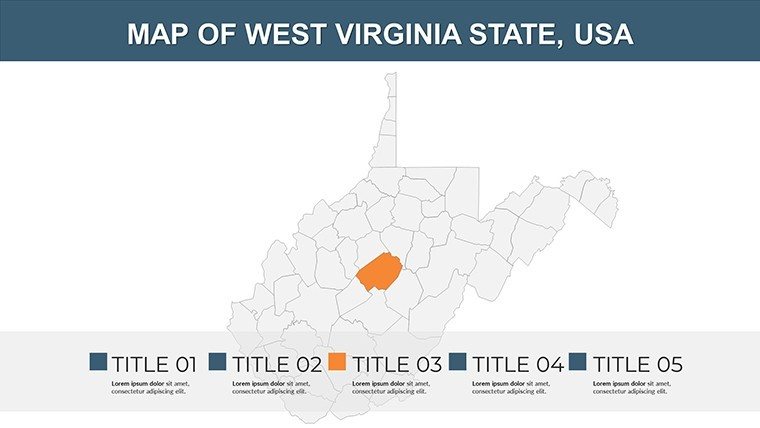
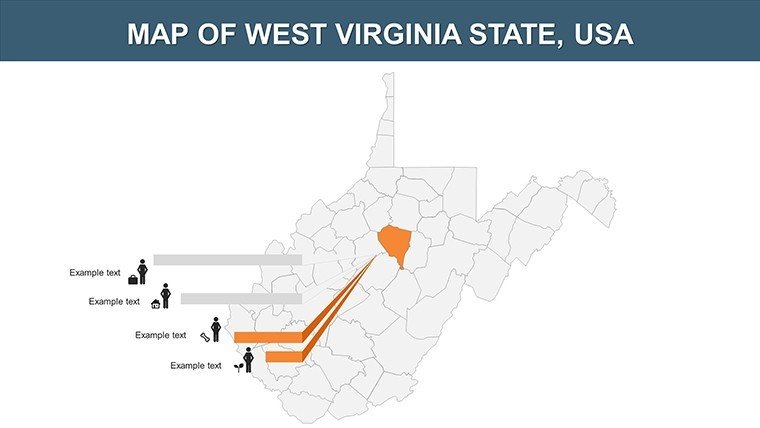
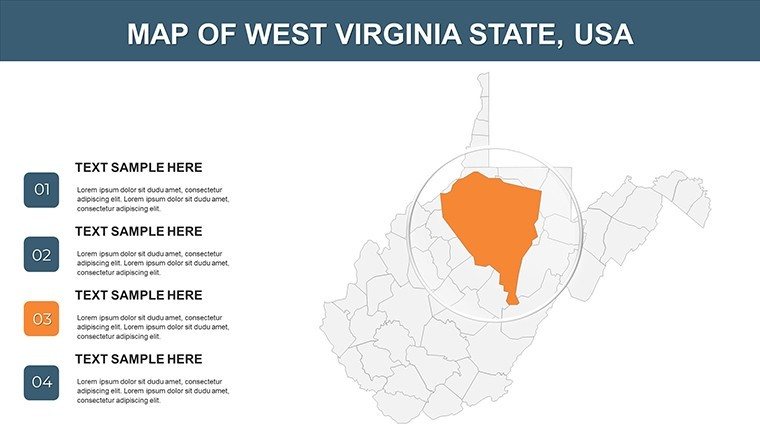
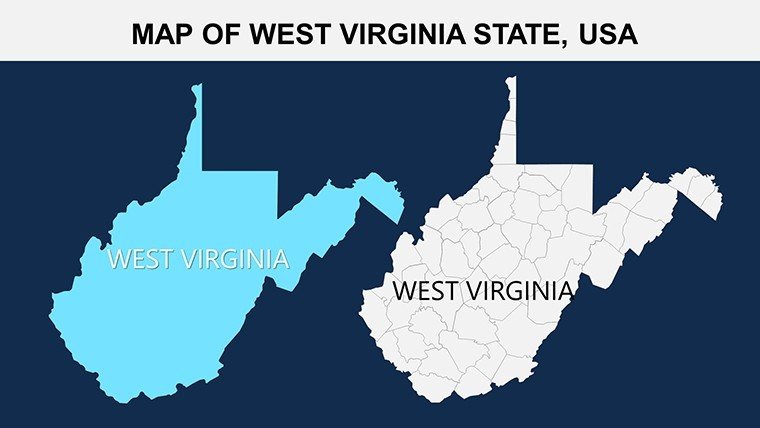
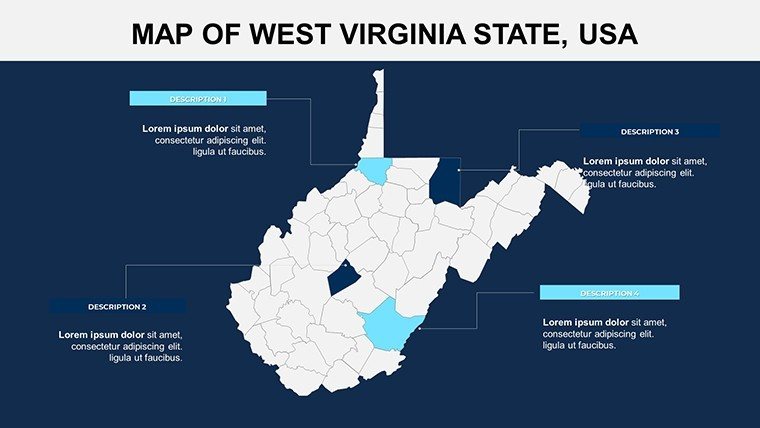
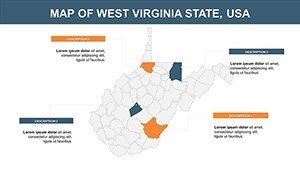
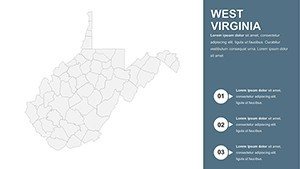
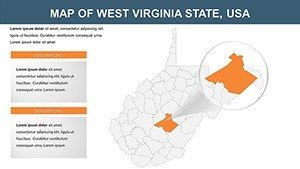
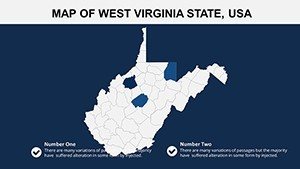
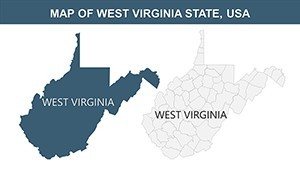
Unpack the template's robust offerings, each crafted to support architectural depth. The opening slide provides a full-state panorama, setting the stage for regional overviews. County-specific layouts (Slides 4-15) label every division, from Kanawha to Monongalia, allowing targeted edits for project scopes.
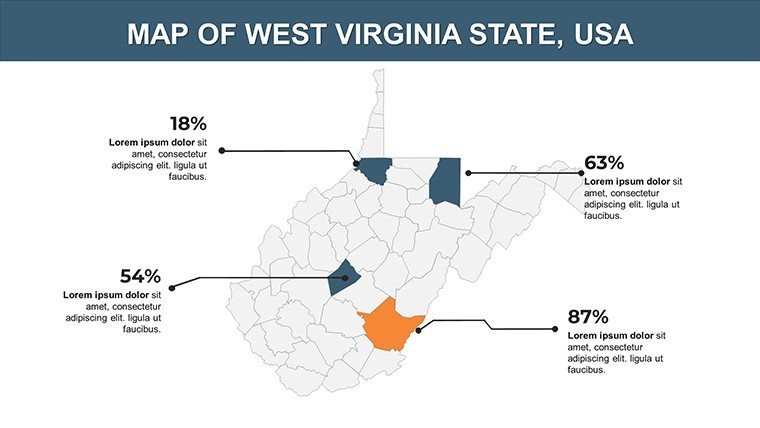
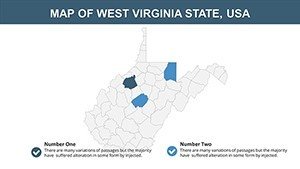
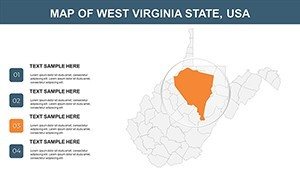
- Comprehensive County Coverage: All 55 counties detailed, with options to highlight demographics or natural resources like coal fields.
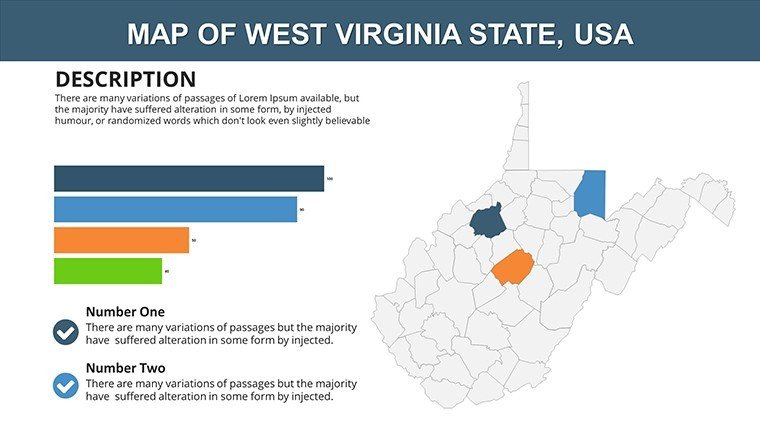
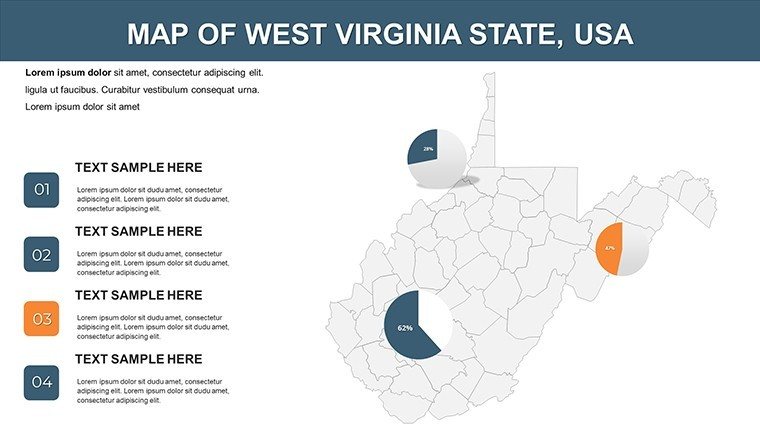
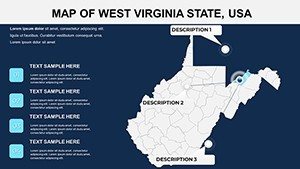
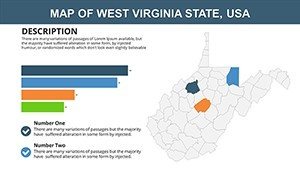
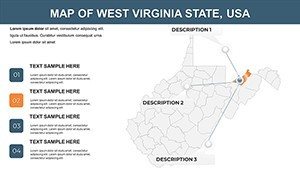
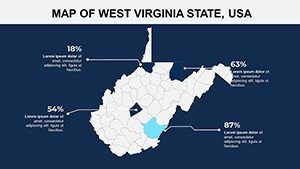
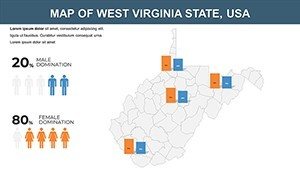
- Infographic Integration: Pre-linked visuals for population stats or economic indicators, e.g., line charts on tourism growth in the Eastern Panhandle.
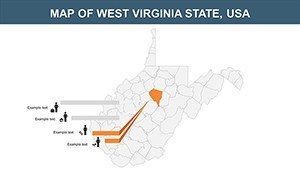
- Versatile Themes: Slides 16-22 cover geography, economics, and infrastructure, adaptable for environmental impact slides in bridge designs.
- Effortless Customization: Alter labels, add photos of proposed builds, or sync with Excel for live data updates.
A real-world example: An architecture team in Morgantown leveraged these maps for a university expansion, layering enrollment data over county maps to justify satellite campuses - resulting in a greenlit $10M initiative and local acclaim.
Targeted Applications in Design and Development
Bring this template to life in your practice. For rural architecture, use economic-themed slides (Slides 23-26) to map agricultural potentials in the Potomac Highlands, informing farm-to-table community centers. In educational contexts, it aids workshops on sustainable mining transitions, visualizing reclamation sites.
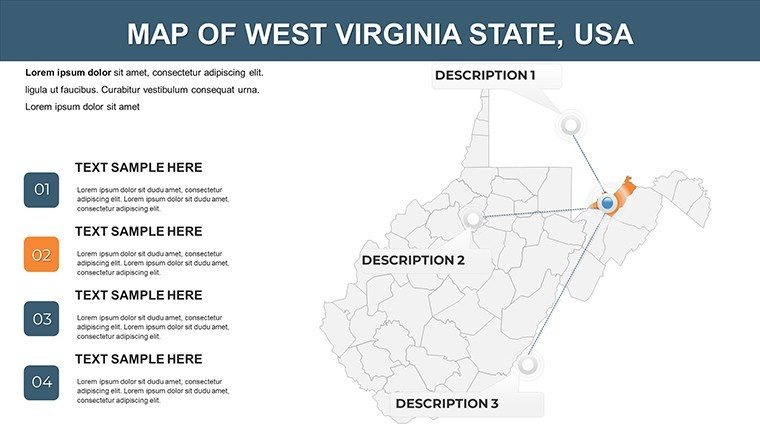
Stakeholder meetings gain traction with animated county progressions, clarifying phased rollouts for highway-adjacent hotels. Studies show such maps increase comprehension by 50%, vital for navigating West Virginia's regulatory landscape.
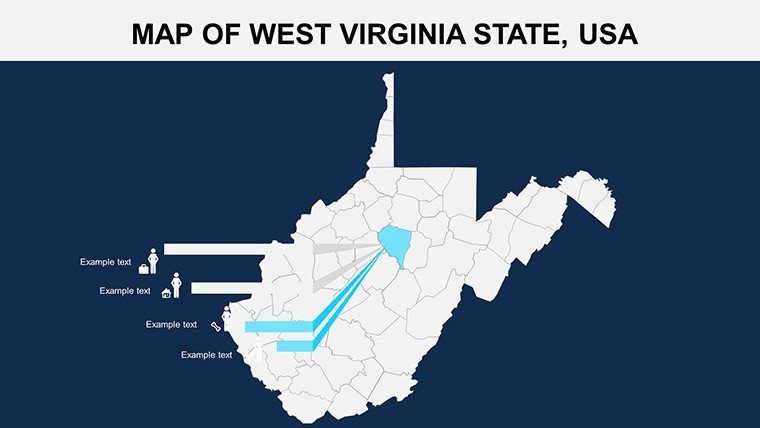
- Topography Analysis: Overlay elevation on base slides for foundation planning in hilly terrains like the New River Gorge.
- Economic Pitching: Customize infographics in Slide 10 to showcase job creation from industrial parks.
- Collaborative Edits: Use shared links for multi-architect input on border counties like those near Ohio.
Outshining vanilla PowerPoint, this template's labeled counties and ready visuals streamline complex analyses, empowering bolder designs.
Optimization Strategies for Architectural Use
Enhance your maps by incorporating GIS layers for flood zones in riverine areas like the Kanawha Valley, using transparency for multi-view insights. Hyperlink to state archives for historical context, adding layers of trustworthiness akin to published case studies.
For engagement, animate resource flows across counties, demonstrating connectivity in smart city proposals. This mirrors techniques from acclaimed AIA journals, elevating your work's perceived expertise.
Empower Your Vision with West Virginia Maps
This template bridges geography and genius, equipping architects to conquer West Virginia's challenges with confidence. Don't settle for sketches - opt for sophistication. Secure the West Virginia USA PowerPoint Maps Template now and ground your ideas in reality.
Frequently Asked Questions
Does it include all 55 West Virginia counties?
Yes, every county is labeled and editable for detailed focus.
Compatibility with other software?
Native to PowerPoint; converts well to Google Slides for teams.
Ideal for economic presentations?
Perfectly - includes tools for overlaying GDP and industry data.
Can I add custom images?
Yes, slides support photo insertions for site-specific visuals.
Are there economic theme slides?
Yes, dedicated slides for population and resource mapping.