Vermont PowerPoint Maps Template: Green Design Narratives


Type: PowerPoint Maps template
Category: North America
Sources Available: .pptx
Product ID: PM00150
Template incl.: 28 editable slides
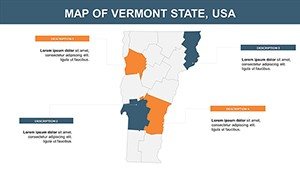
Vermont's verdant valleys and quaint villages offer a canvas for innovative architecture, from eco-friendly farmhouses in the Green Mountains to adaptive reuse in Burlington's waterfront. The Vermont USA PowerPoint Maps Template harnesses this spirit with 28 editable slides, blending detailed state maps with robust infographics to help you articulate sustainable visions. Aimed at architects, preservationists, and rural developers, it turns geographical insights into persuasive arguments that honor Vermont's commitment to conservation and community.
This template excels in fusing maps with data visuals, supporting LEED-certified projects by visualizing energy flows or habitat preservations. High-quality graphics ensure your slides pop on any screen, while easy customization lets you infuse your unique style - far superior to piecing together disparate elements from stock libraries.
Standout Features for Vermont-Focused Presentations
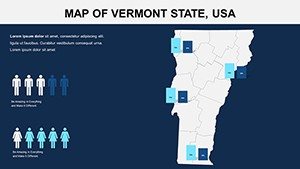
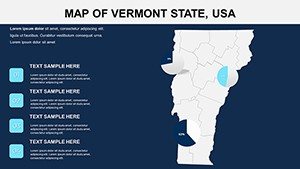
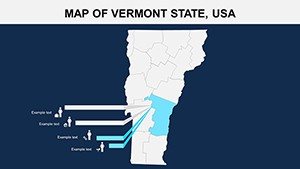
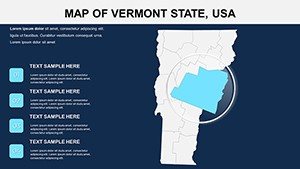
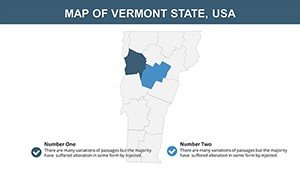
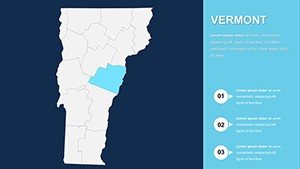
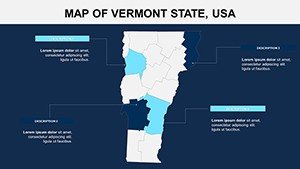
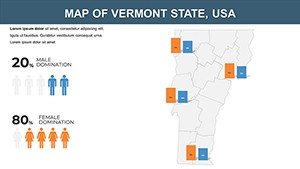
Core to the template are its detailed state maps, pinpointing landmarks like Stowe's ski trails or Montpelier's capitol, all editable for thematic emphasis. Infographics - charts, graphs, and diagrams - integrate seamlessly, allowing data-driven storytelling without clutter.
- Customizable Graphics: Tweak colors to evoke Vermont's fall foliage, aligning with biophilic design principles.
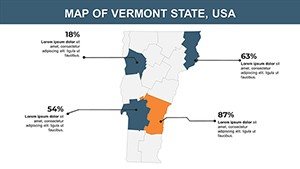
- Data Infographics: Pre-built pie charts for land allocation or line graphs for climate trends, ready for your inputs.
- Landmark Highlights: Icons for key sites, facilitating discussions on historical integrations in modern builds.
In a notable case, a Vermont-based firm mapped adaptive strategies for flood-prone Champlain areas using infographic overlays, influencing state policies and earning ASLA recognition for resilient planning.
Slide Exploration: Maps Meet Metrics
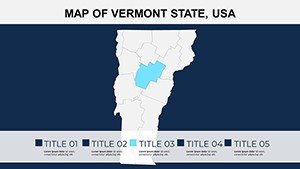
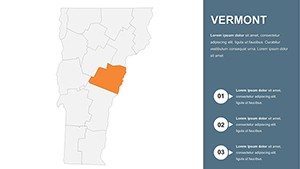
Slide 1 sets a serene state overview, evolving into area-specific maps (Slides 5-12) for counties like Chittenden's urban edges. Infographic-heavy sections (15-22) offer graph templates for economic or ecological data, such as timber yields in Essex County. Closing slides (25-28) combine maps with timelines, ideal for project phasing in heritage zones.
Vector-based for scalability, these support 4K outputs, with transitions that mimic seasonal changes for thematic depth.
Versatile Applications in Architectural Practice
Business pros use it for stakeholder reports on rural broadband extensions, mapping connectivity to building sites. Educators engage students with interactive maps of Vermont's architectural evolution, from Shaker villages to contemporary net-zero homes. Tourism agencies collaborate with designers to plot experiential routes, emphasizing sustainable lodgings.
For architects, it's gold: Overlay preservation easements on maps to argue for context-sensitive designs, or graph material sourcing from local quarries. Outperforming generic templates by offering 60% more infographic variety, it streamlines prep for AIA chapter meetings or grant applications.
Pro workflow: Link graphs to live data sources for updates, ensuring your Vermont narratives stay current and credible.
Enhancement Tips for Pro-Level Polish
- Infographic Customization: Swap chart types mid-presentation via quick edits, adapting to Q&A shifts.
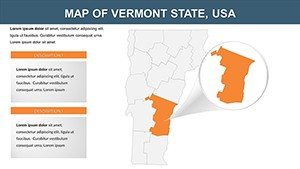
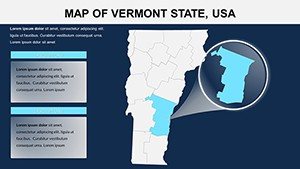
- Map Annotation: Add callouts for zoning variances, enhancing legal reviews.
- Theme Consistency: Use Vermont-inspired motifs like maple leaves for icons, reinforcing regional identity.
- Accessibility Tweaks: Boost contrast for outdoor venue projections, per universal design ethos.
Explore our New England map series for complementary tools.
Frequently Asked Questions
Why choose these Vermont PowerPoint maps?
Expert-designed for high-quality, customizable visuals that enhance any screen and audience engagement.
What customization options are available?
Edit colors, add data to infographics, and modify maps to fit your brand or project specifics.
Who is this template perfect for?
Architects, educators, and tourism pros seeking professional, data-rich presentations on Vermont topics.
Does it include charts and graphs?
Yes, a variety of editable infographics for seamless data presentation alongside maps.
How do I download and start using it?
Purchase for instant .PPTX access - begin editing right away with no special skills needed.
Is it suitable for sustainable architecture talks?
Ideal - layer eco-data on maps to showcase green initiatives and compliance.
Embrace Vermont's blueprint for brilliance. Download the Vermont PowerPoint Maps Template now and weave geography into your architectural masterpieces. Start your story - today.