Texas PowerPoint Maps & Charts Template - Customize Easily


Type: PowerPoint Maps template
Category: North America
Sources Available: .pptx
Product ID: PM00147
Template incl.: 28 editable slides
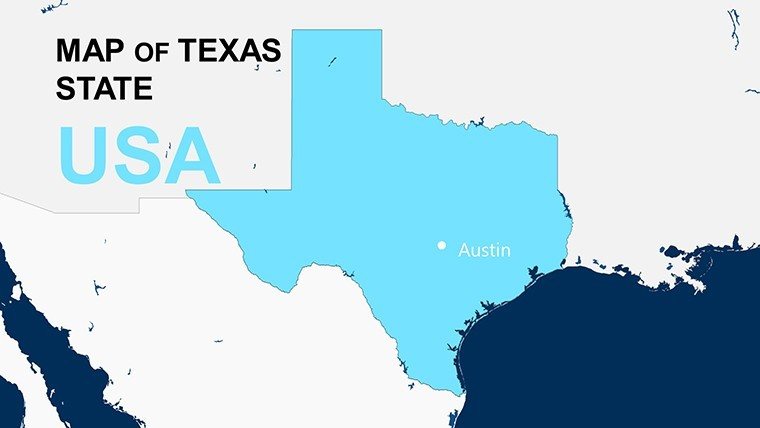
The Lone Star State, with its vast landscapes from the Gulf Coast to the Panhandle, demands presentations that match its scale and diversity. Our Texas PowerPoint Maps & Charts Template delivers just that: 28 editable slides blending detailed maps, data charts, and infographics for dynamic storytelling. Whether you're a corporate leader charting oil industry trends in Houston, a teacher exploring Texas history in Austin classrooms, or a researcher analyzing demographic shifts in Dallas-Fort Worth, this template turns complex info into clear, captivating visuals. Inspired by real-world successes, like those in TEDx talks on regional economics, it helps you command attention and drive home your points.
Rooted in precise GIS data from the Texas Natural Resources Information System, the template ensures reliability while offering extensive personalization. Say goodbye to mismatched designs - our professional layouts integrate seamlessly with PowerPoint, Keynote, and Google Slides. Let's unpack the features that fuel its versatility, then explore benefits and scenarios where it shines, all while providing tips to maximize your impact.
Essential Features for Professional Polish
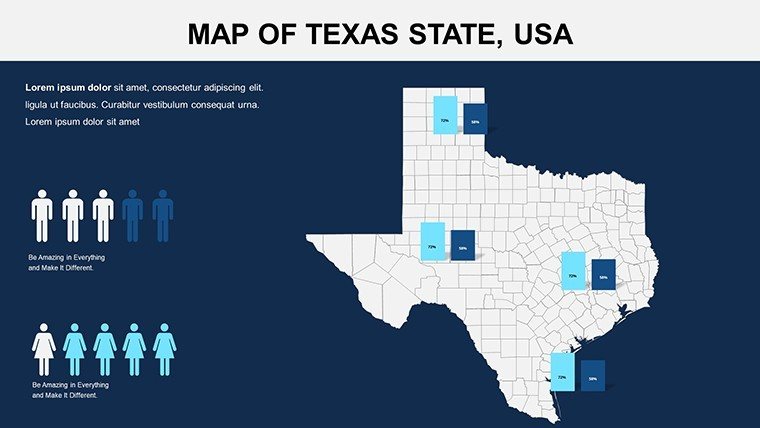
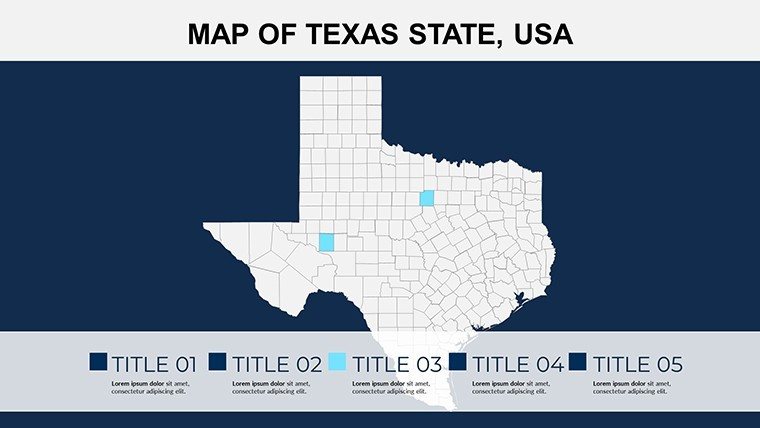
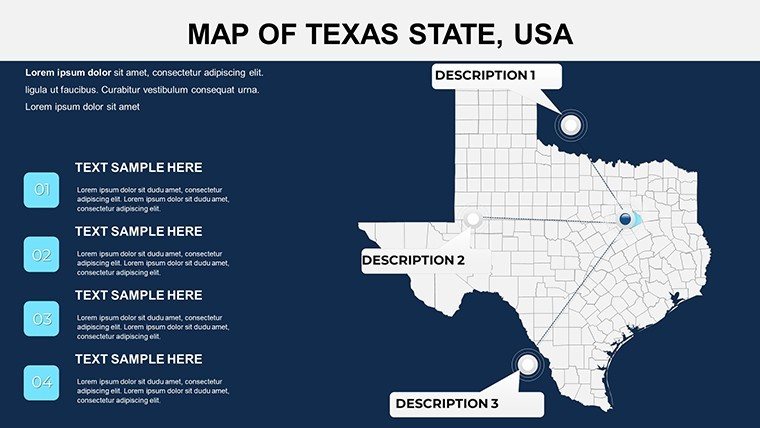
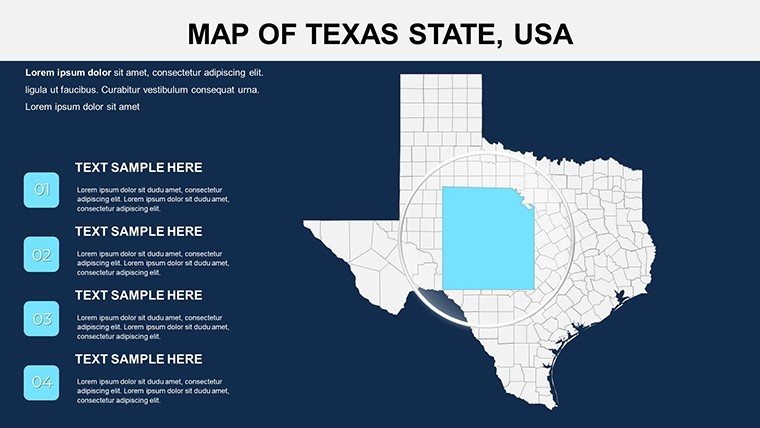
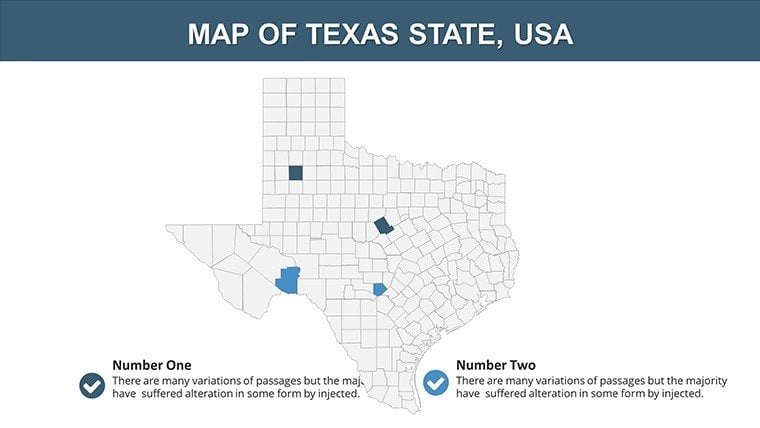
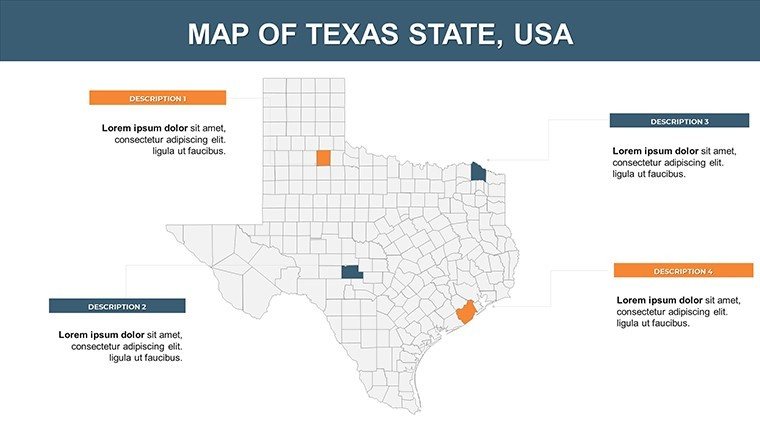
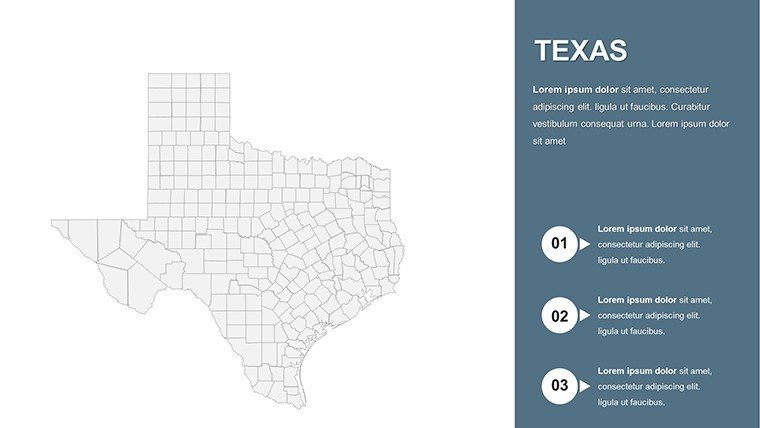
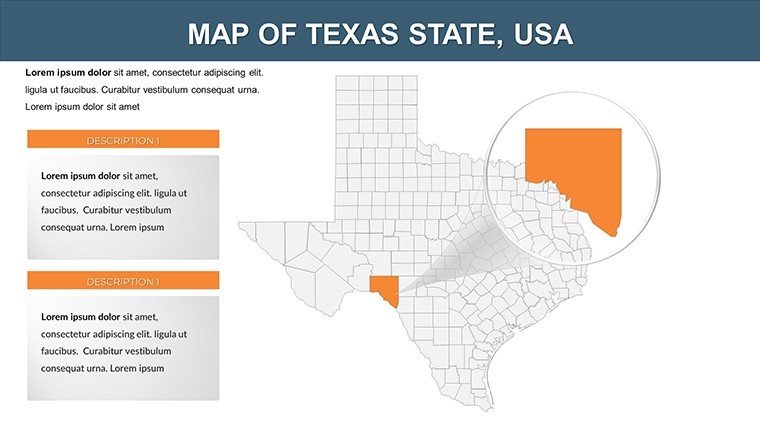
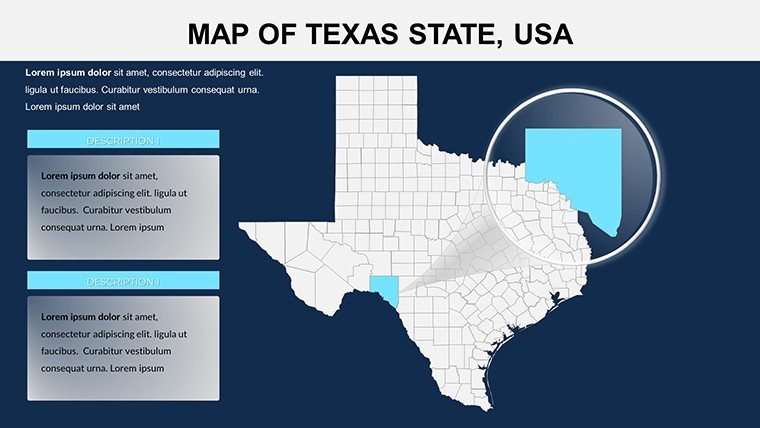
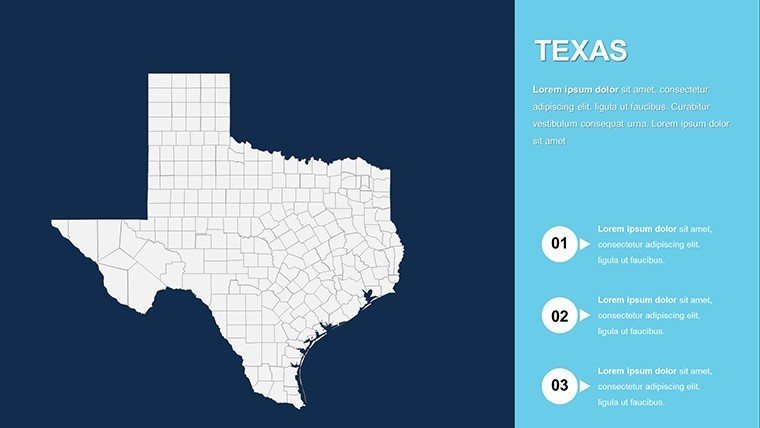
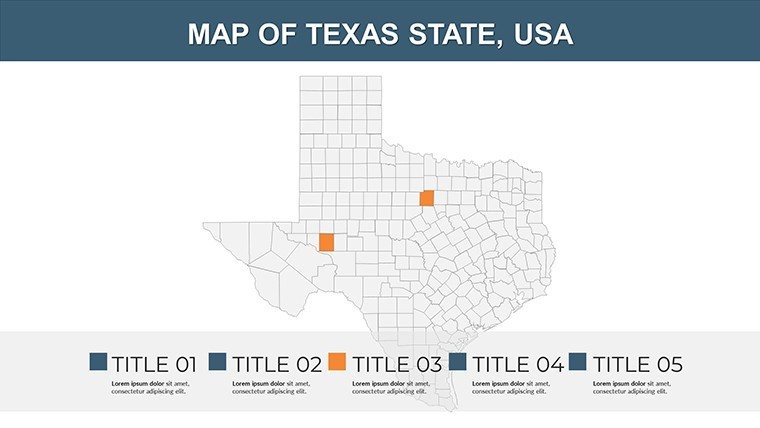
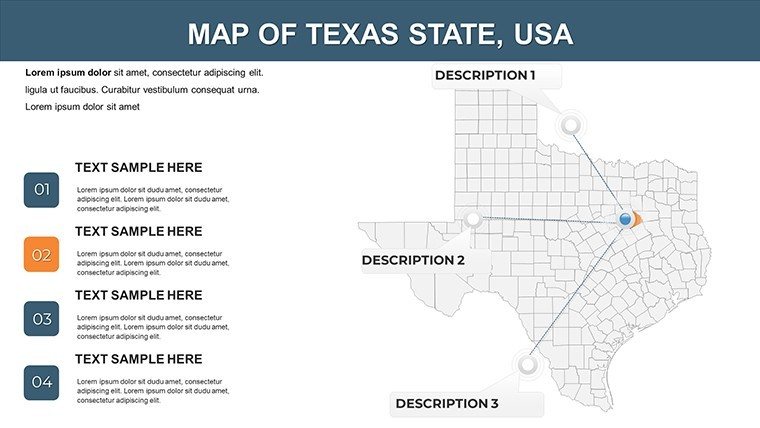
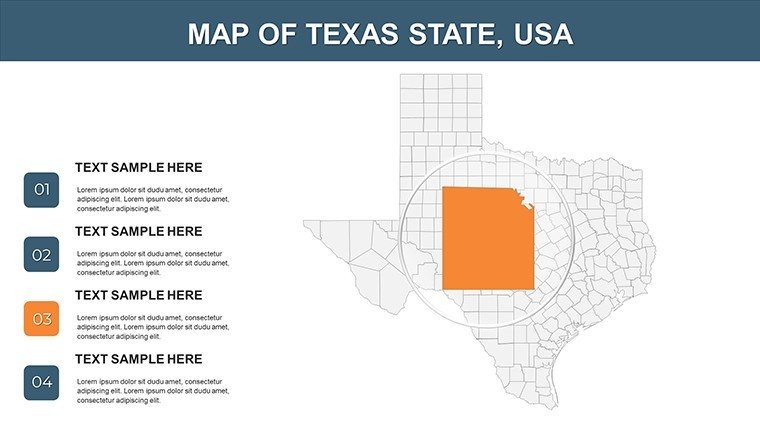
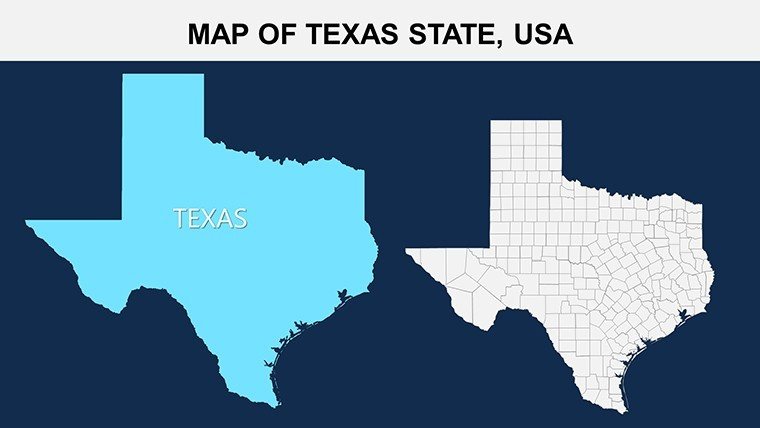
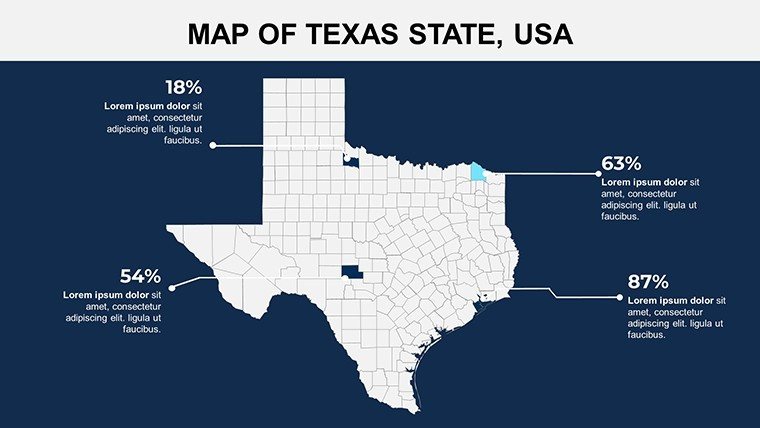
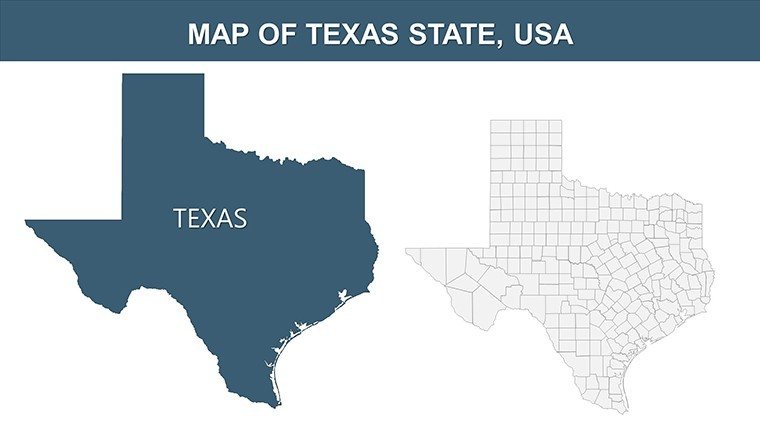
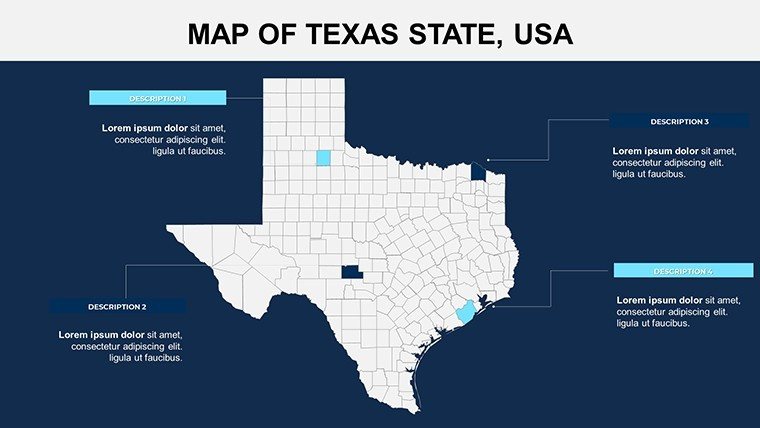
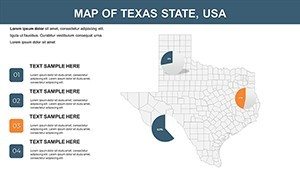
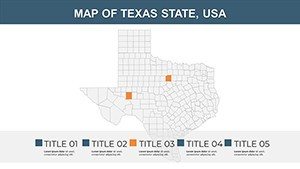
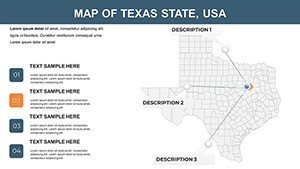
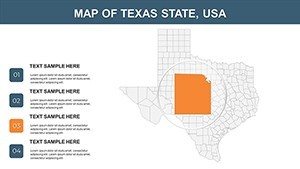
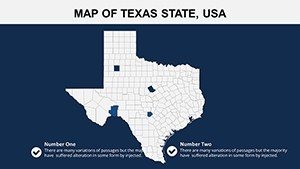
Spanning 28 slides, this template covers Texas from every angle. Slide 1 presents a full-state map with highways like I-35 highlighted, ready for your tweaks. Dive deeper with slide 4's regional breakdowns, labeling areas like the Hill Country or Big Bend.
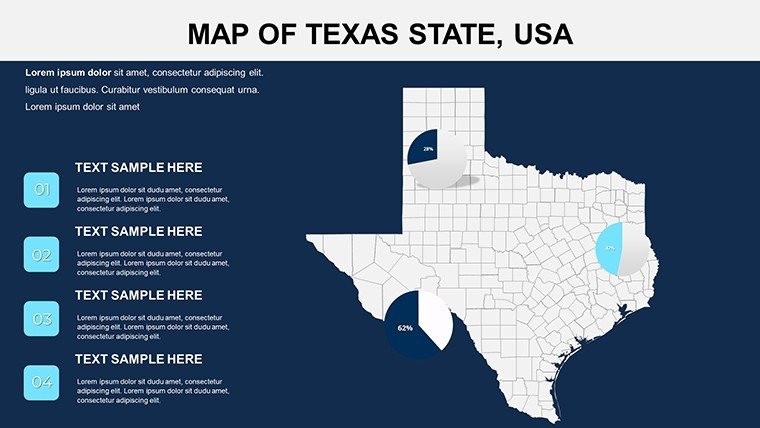
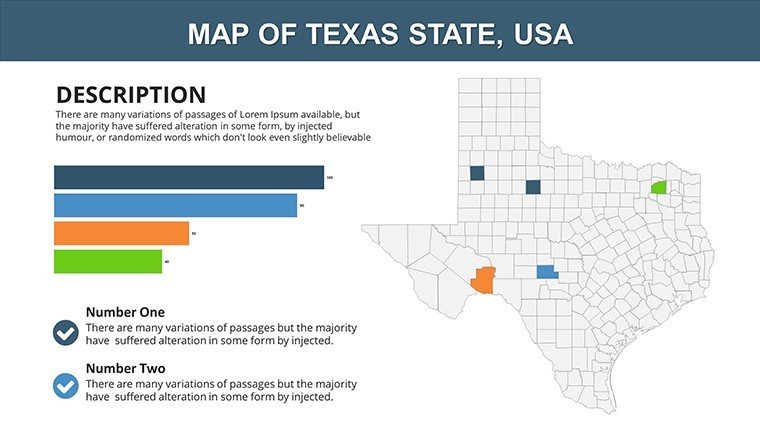
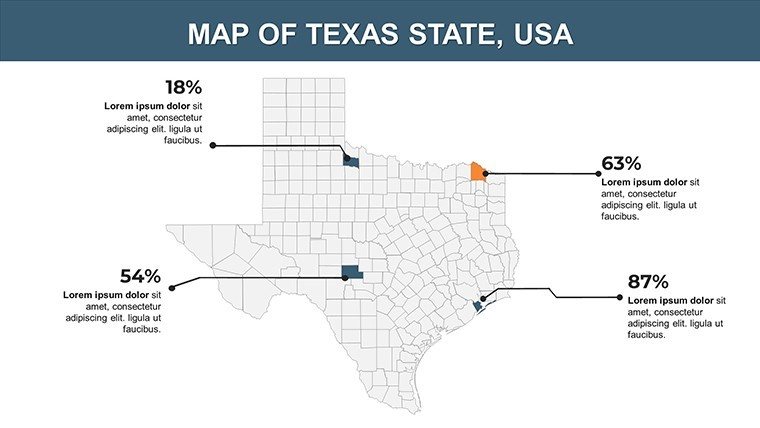
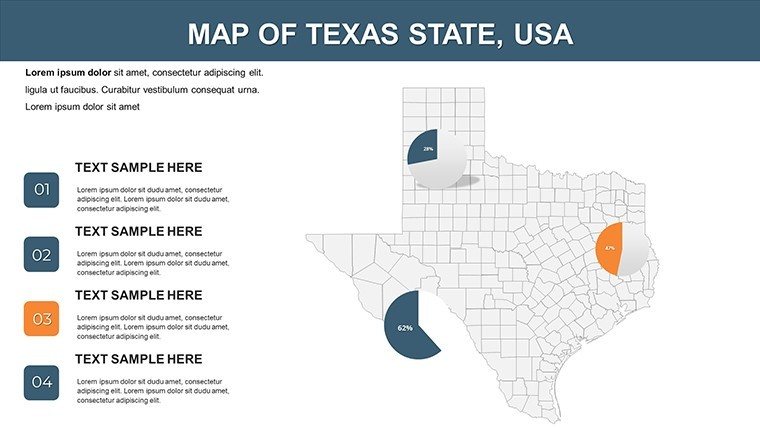
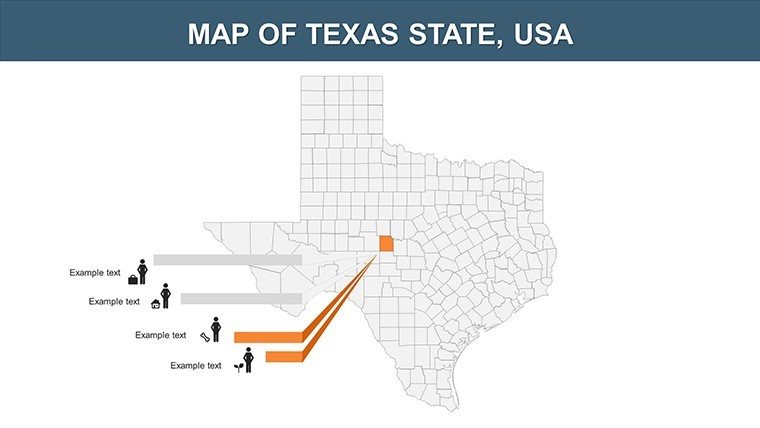
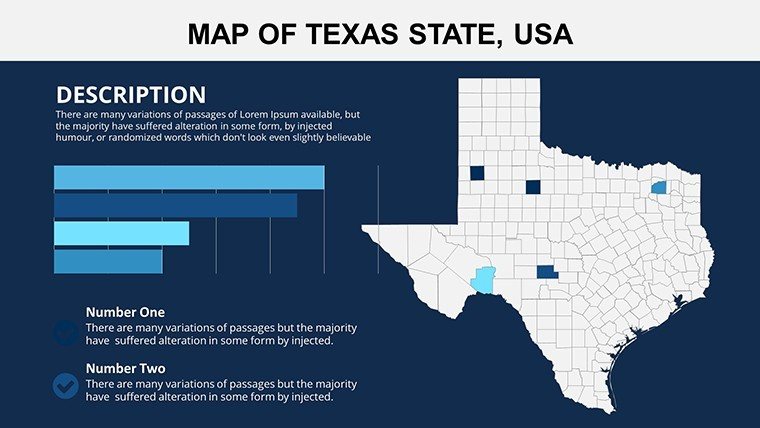
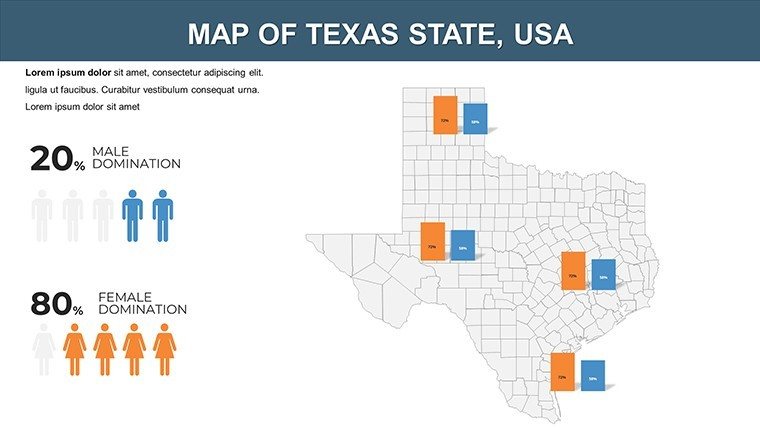
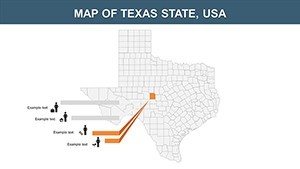
Customization reigns supreme: Change fonts to bold Texan styles, recolor to your scheme - perhaps burnt orange for UT Austin themes - or insert infographics on slide 10 for population data. Vector elements maintain sharpness at any size, unlike raster images that blur. Built-in charts on slides 15-20 let you import Excel data for bar graphs on GDP or pie charts for energy sectors.
Versatility extends to platforms: Fully compatible with multiple software, ensuring no reformatting woes in collaborative environments. Modern designs from expert creators add a sleek edge, perfect for high-stakes settings.
Powerful Benefits That Drive Results
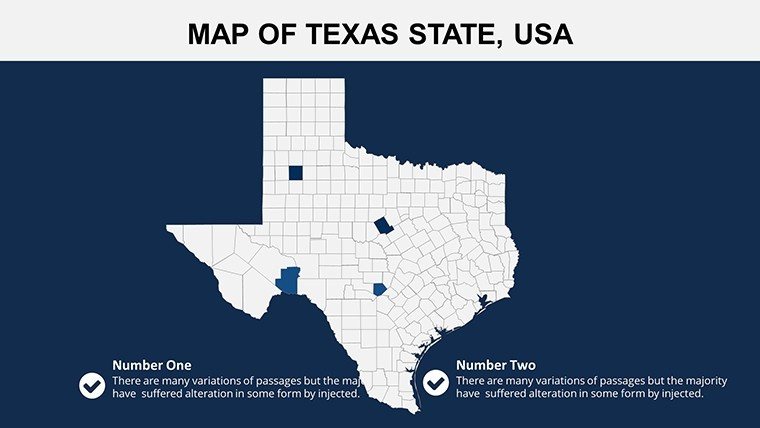
Benefits manifest in efficiency and engagement. Business pros can visualize market analyses on slide 7, boosting pitch success rates as seen in Forbes-featured case studies. Educators engage students with interactive history maps on slide 12, aligning with TEKS standards for deeper learning.
Researchers present findings with clarity, using infographics to simplify complex data like migration patterns. The template's visual prowess fosters better retention, with studies showing 65% recall from visuals versus text alone.
In-Depth Use Case: Building a Business Analysis Deck
Launch with slide 1: Brand the map overview. Segment economies on slide 5 with color-coded regions. Add charts on slide 18 from your datasets. Animate reveals on slide 22 for dramatic effect. Wrap with slide 28's infographic summary. This streamlined approach trumps native PowerPoint, saving design time.
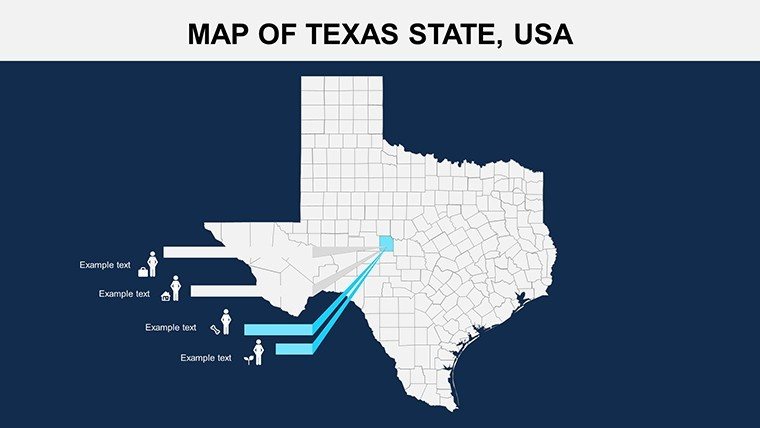
Unique icons like oil rigs or cowboy hats add thematic depth, enhancing narratives without extra sourcing.
Expansive Applications and Expert Advice
Apply to marketing reports mapping ad campaigns or environmental studies on Rio Grande watersheds. Tips: Layer data sparingly to avoid clutter. Use animations judiciously for emphasis. Internal links to state-specific templates enhance navigation. Alts like "Texas economic chart slide" aid SEO.
Harness Texas-sized potential - customize your template now.
Frequently Asked Questions
- How do I integrate data into the charts?
- Easily import from Excel; the template supports dynamic updates for real-time visuals.
- Compatible with Keynote?
- Yes, full compatibility ensures smooth use across Apple and Microsoft ecosystems.
- Ideal for research presentations?
- Absolutely, with infographics designed for complex data clarity.
- Download format?
- .pptx, ready for immediate editing.
- Any customization limits?
- None - unlimited edits to fit your needs.
- Can I add my own images?
- Yes, insert photos or icons effortlessly into any slide.