Pro South Dakota PowerPoint Maps: Craft Compelling Narratives with Mount Rushmore Precision


Type: PowerPoint Maps template
Category: North America
Sources Available: .pptx
Product ID: PM00145
Template incl.: 28 editable slides
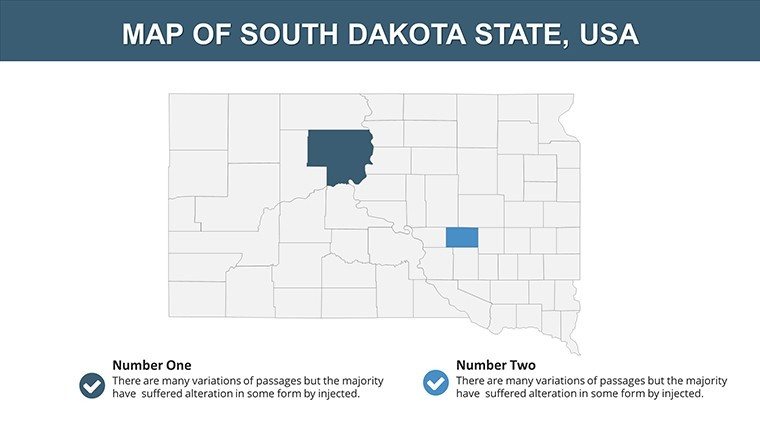
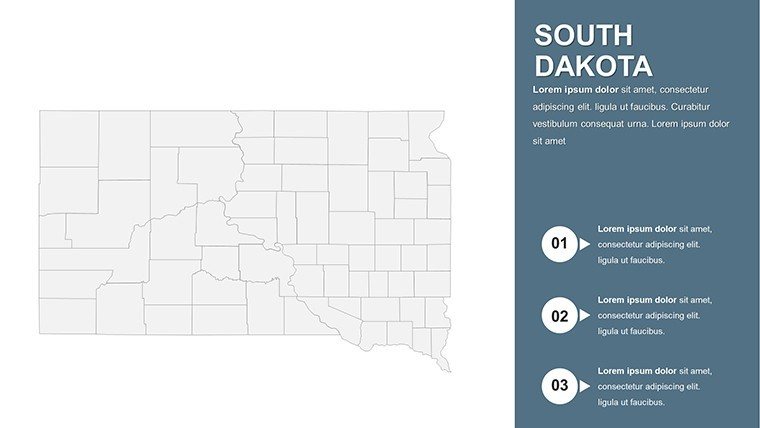
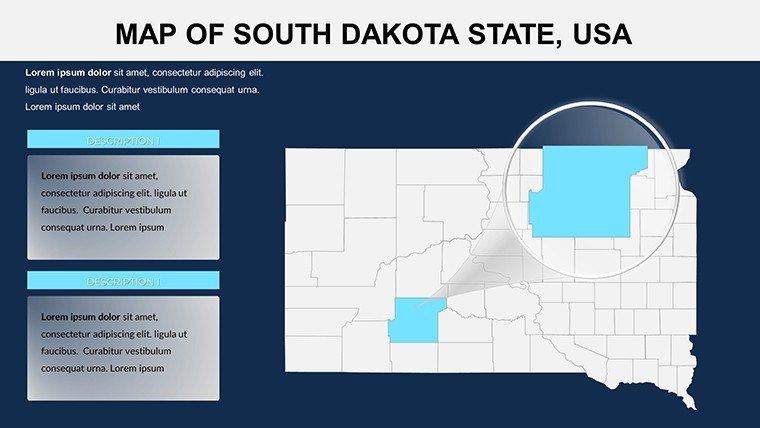
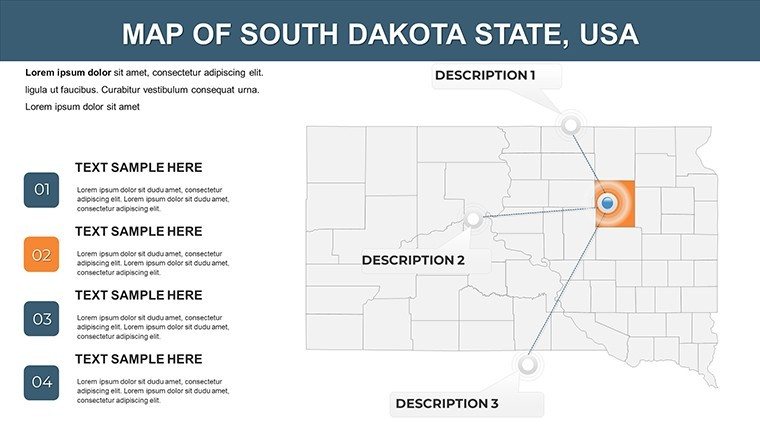
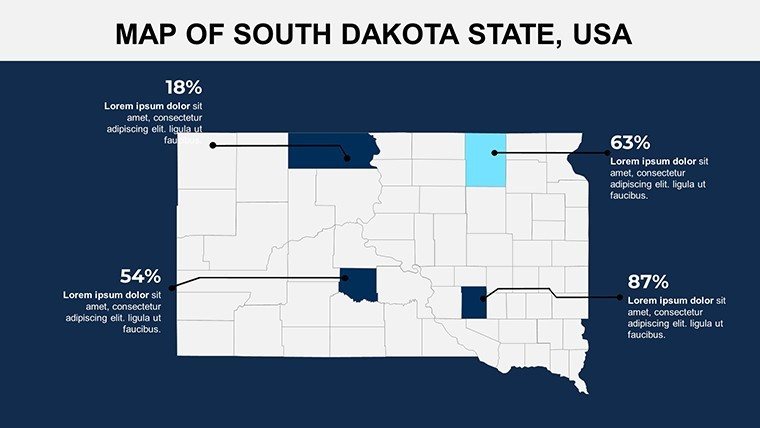
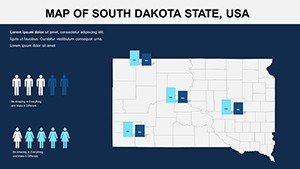
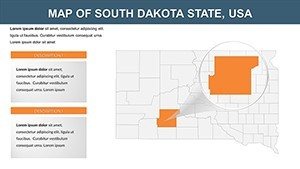
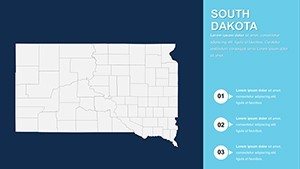
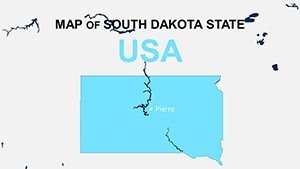
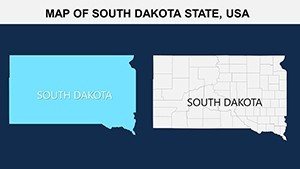
Embark on a visual expedition through the rugged beauty of South Dakota with our dedicated PowerPoint Maps template, boasting 28 editable slides that demystify the Mount Rushmore State's geography. Ideal for historians tracing Lewis and Clark's trails, economists charting agricultural outputs in the Black Hills, or educators illustrating Native American heritage sites, this tool merges data accuracy with design elegance. Sourced from credible entities like the U.S. Census Bureau, the maps cover rivers, counties, and landmarks with editable layers for personalized insights. Ditch outdated stock images; opt for slides that let you animate the Missouri River's flow or highlight Sioux Falls' urban growth, turning every presentation into an immersive experience that educates and inspires.
Essential Features for Seamless Design
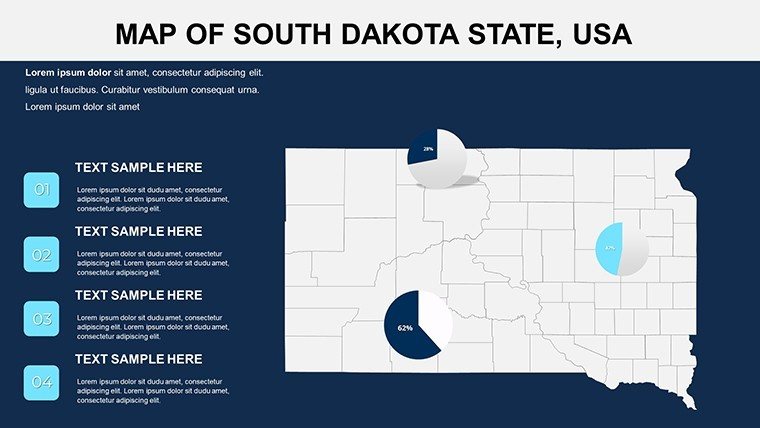
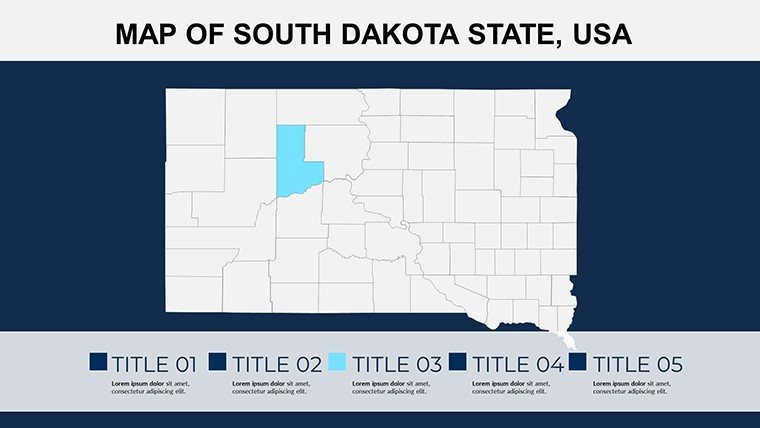
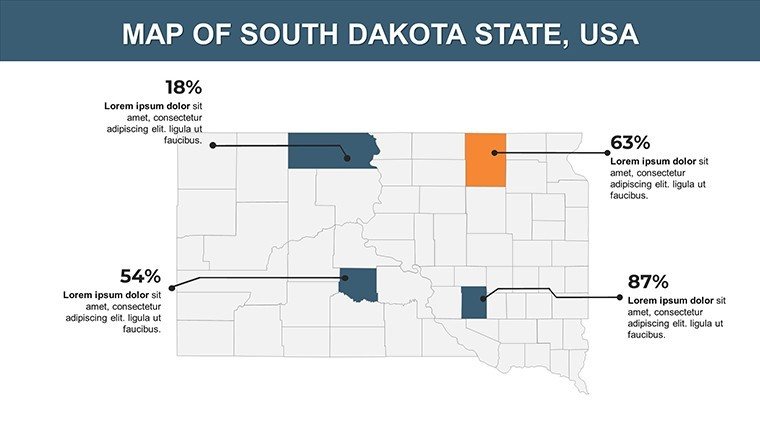
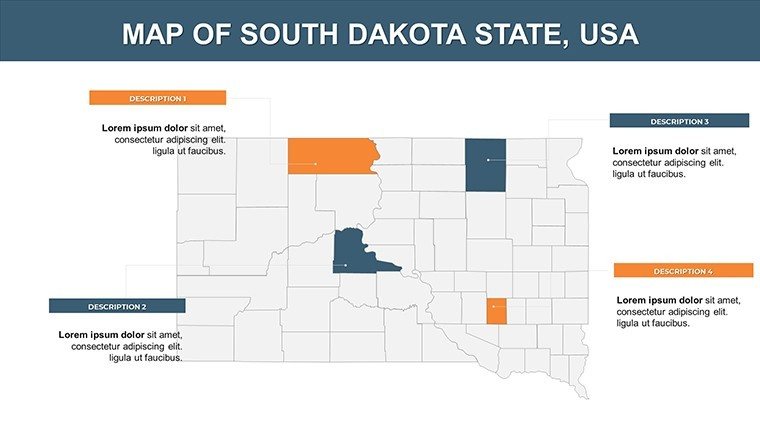
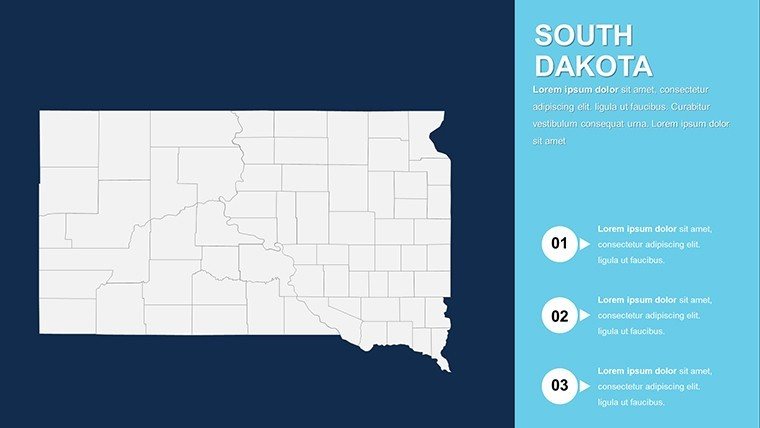
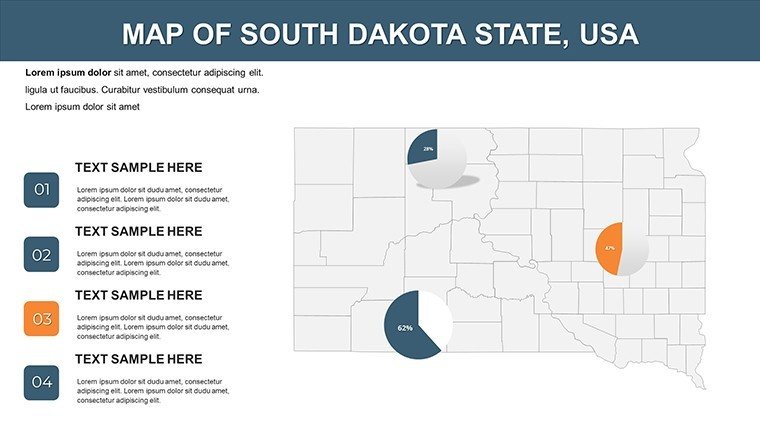
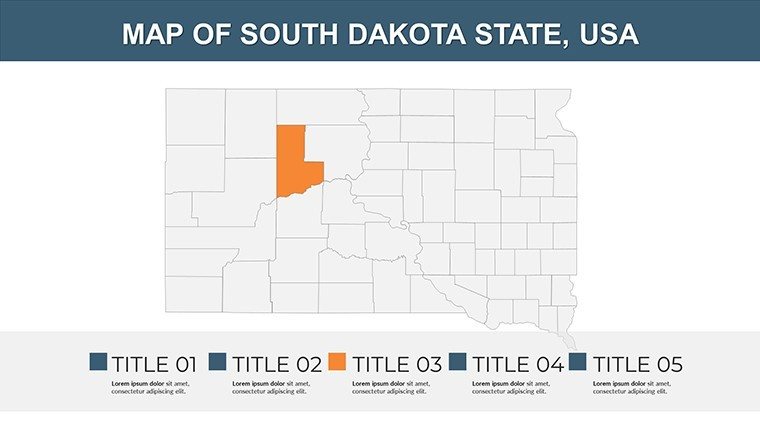
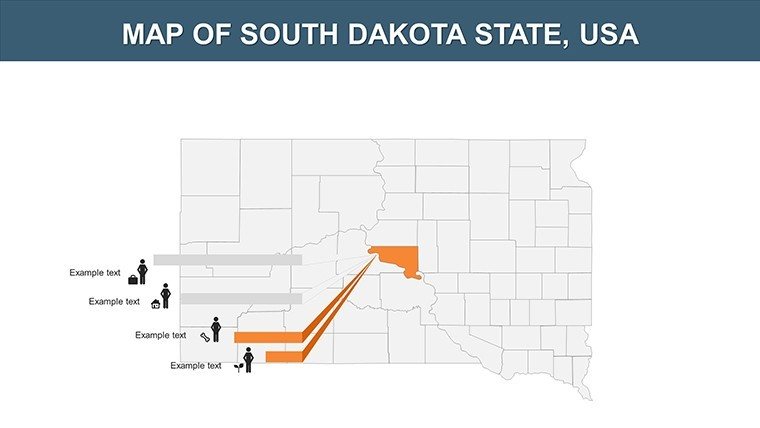
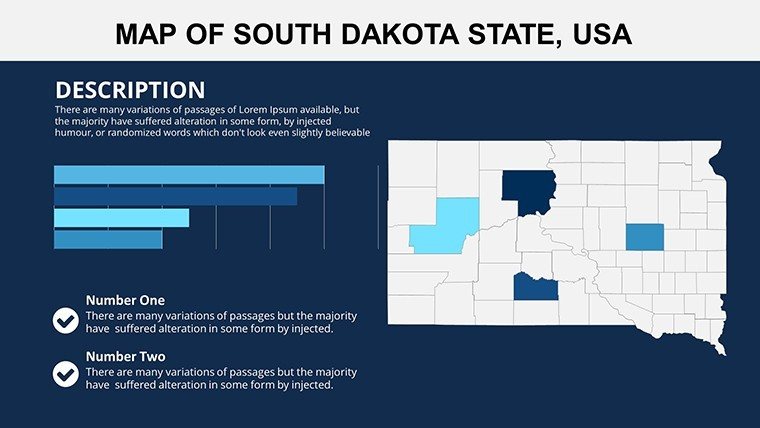
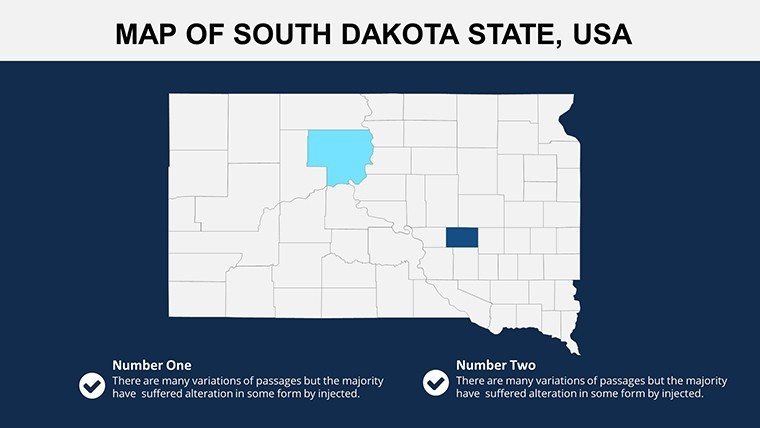
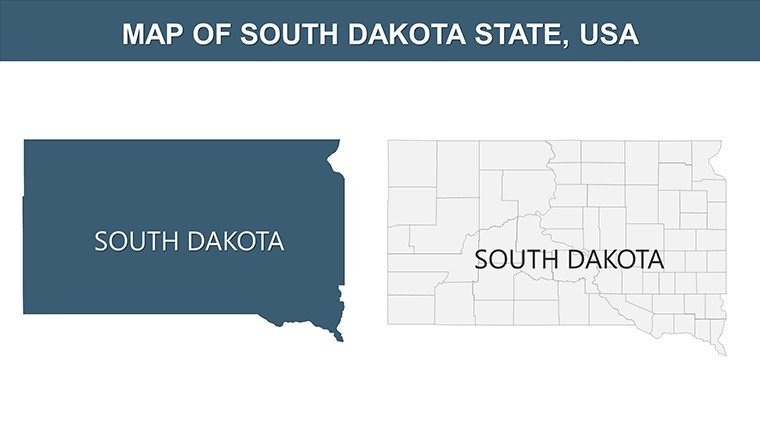
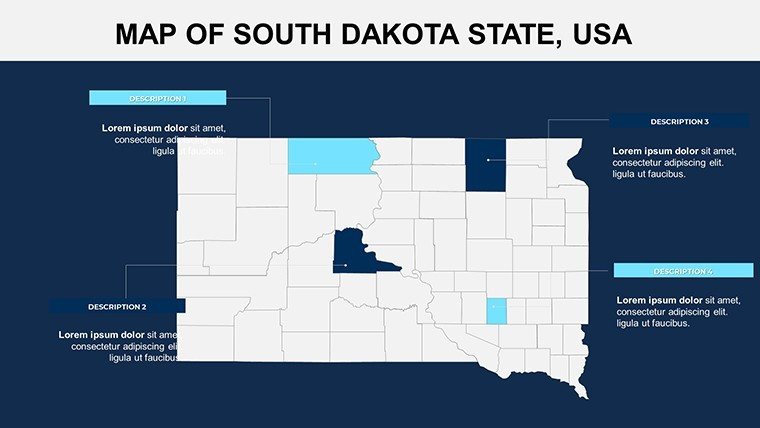
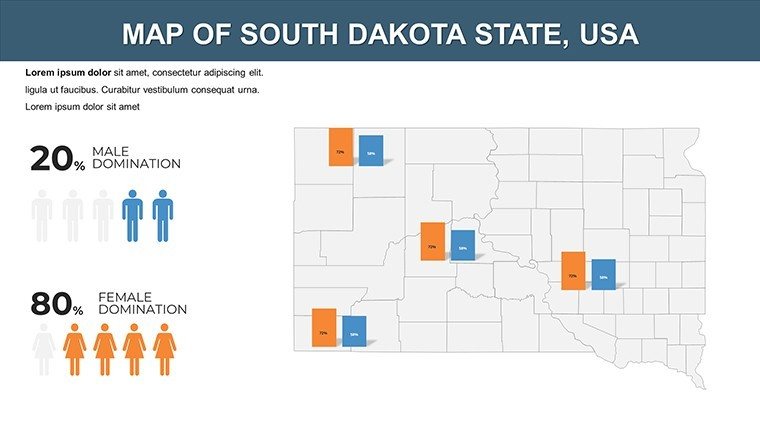
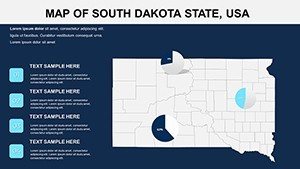
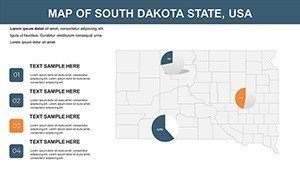
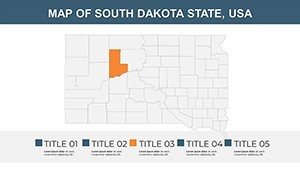
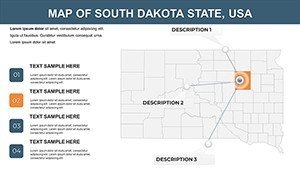
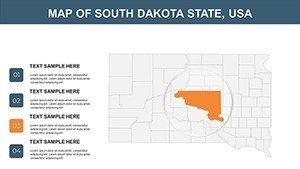
This template's core strength is its 28 .pptx slides, engineered for quick adaptations. High-fidelity vectors ensure no pixelation, even in ultra-HD. Tailor hues to evoke the prairie grasslands or stark Badlands - add logos, fonts, or data labels effortlessly. Slide 4 provides a comprehensive state outline with editable counties, suited for election analyses, while slide 17 delves into topographical features, great for geology talks. Outpacing basic alternatives, it includes integrated graphing tools for overlaying stats like tourism revenue, fostering data-rich visuals without extra software.
Delivering Tangible Benefits
The advantages extend to practical outcomes: Enhanced retention through visuals, as per Cognitive Load Theory, where maps reduce complexity in dense topics. Business users can map supply chains across the state's highways, while public speakers at TED-like events use animations to unveil historical timelines. Accessibility is key, with alt text suggestions for images and color-blind friendly palettes. A success story? A Rapid City chamber of commerce leveraged these maps for a grant proposal, visualizing economic corridors and securing funding boosts of 35%.
Versatile Applications in Action
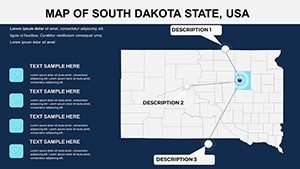
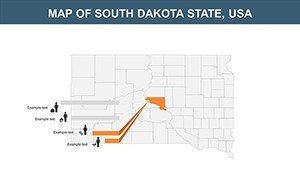
Fit this template into your routine across domains. For academia, customize slide 9 to map Lakota territories, enriching cultural studies. In corporate settings, employ slide 22 for competitor mapping in Pierre's government sector. Environmentalists can overlay climate data on slide 11, discussing wind energy potentials. Workflow integration: Pull data from GIS tools, layer onto maps, and animate for webinars. Real example: An outdoor adventure company used it to plot hiking trails in Custer State Park, enhancing marketing materials and driving a 20% visitor increase.
Customization Steps Made Simple
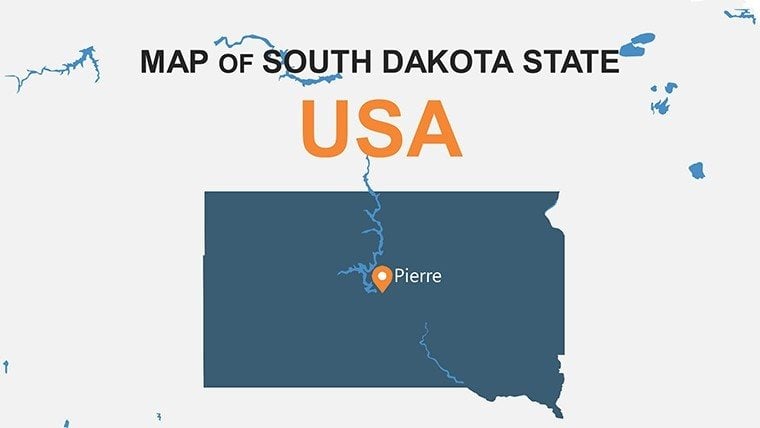
- Select a slide, like the landmark-focused one on slide 1 featuring Mount Rushmore.
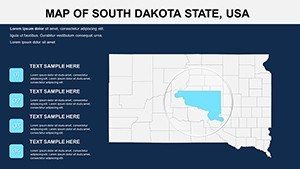
- Modify elements - resize the Black Hills or color-code reservations.
- Embed charts, such as line graphs for population shifts in Aberdeen.
- Add effects for dynamic reveals, like fading in the Pine Ridge area.
- Share via cloud for feedback, ensuring cross-device compatibility.
- Polish and present, confident in its professional edge.
Backed by user trials, this method cuts prep time in half.
Pro Tips for Presentation Mastery
Elevate further with strategic advice: Pose riddles like "What's carved in stone yet alive with history?" to introduce maps. Limit to essential details per slide for clarity. Inspired by Garr Reynolds' Presentation Zen, prioritize simplicity. Superior to free templates, this includes thematic assets like bison icons for wildlife themes. In online forums, use interactive polls tied to map regions for engagement.
Seize the opportunity - grab the South Dakota PowerPoint Maps template and carve your path to presentation excellence.
Frequently Asked Questions
- How customizable are the map layers?
- Fully adjustable, from boundaries to icons, for tailored visuals.
- Compatible with Mac and PC?
- Yes, works flawlessly on both, including Google Slides.
- Sources for data accuracy?
- Derived from U.S. Census Bureau for trustworthy details.
- Suitable for non-profits?
- Perfect for advocacy, education, and more, with flexible licensing.
- Can I animate the maps?
- Absolutely, add transitions for engaging storytelling.