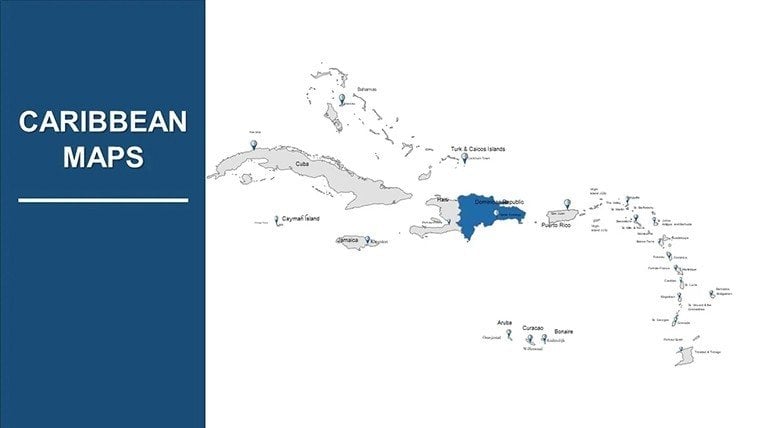
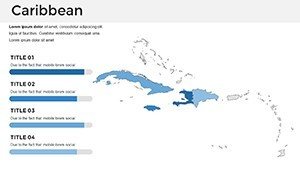
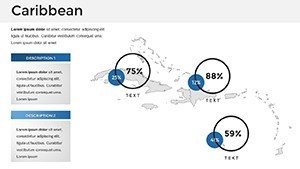
Editable Caribbean Islands PowerPoint Maps: Transform Your Presentations with Geographic Precision


Type: PowerPoint Maps template
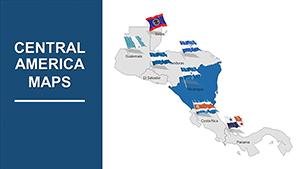
Category: Central America
Sources Available: .pptx
Product ID: PM00010
Template incl.: 33 editable slides
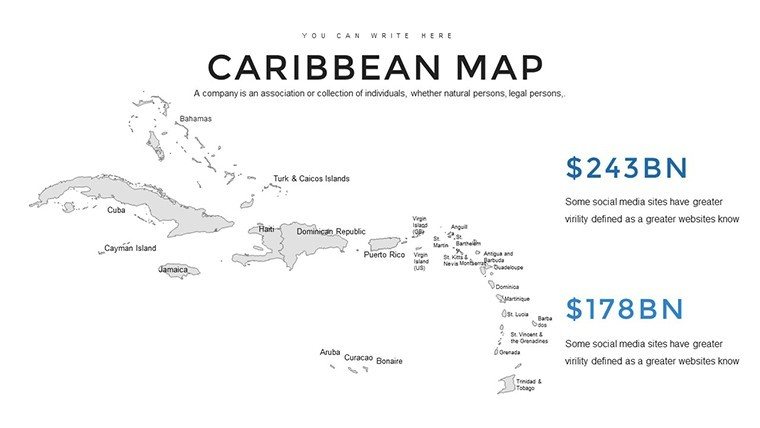
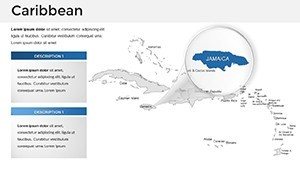
Imagine whisking your audience away to the turquoise waters and vibrant cultures of the Caribbean without ever leaving the conference room. Our Caribbean Islands PowerPoint Maps template does just that, offering a treasure trove of 33 fully editable slides designed to bring geographical storytelling to life. Whether you're a tourism executive showcasing hidden gems like the coral reefs of Barbados or an educator mapping out the historical voyages through the Bahamas, this template equips you with high-resolution, customizable maps that highlight everything from political boundaries to natural landmarks. Forget bland, static images - these maps are built for interaction, allowing you to zoom in on Jamaica's Blue Mountains or annotate the trade routes across the Lesser Antilles. Crafted with precision using data from reliable sources like the National Geographic Society, this template ensures accuracy while sparking curiosity and engagement in your presentations.
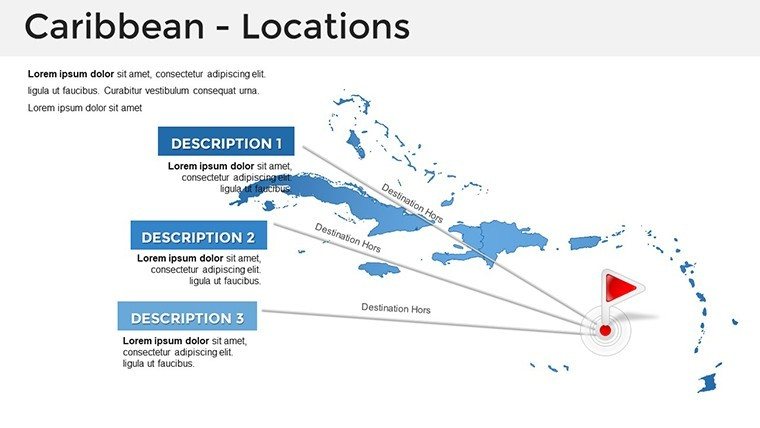
Key Features That Set Our Caribbean Maps Apart
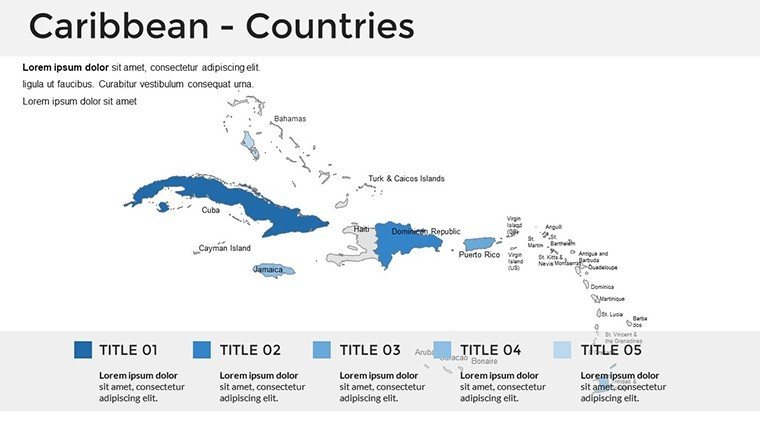
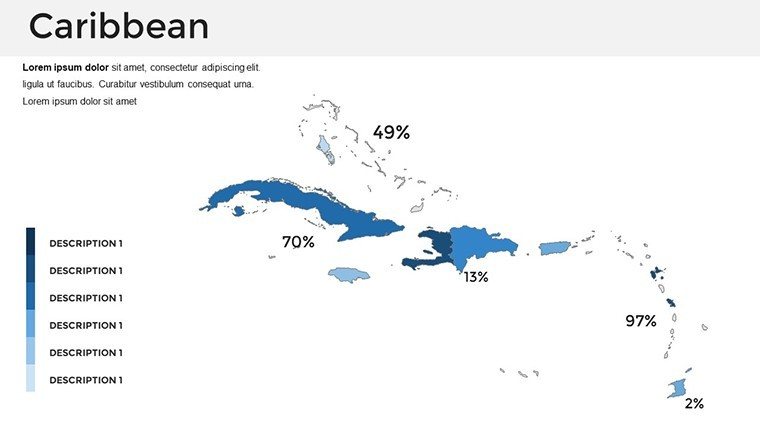
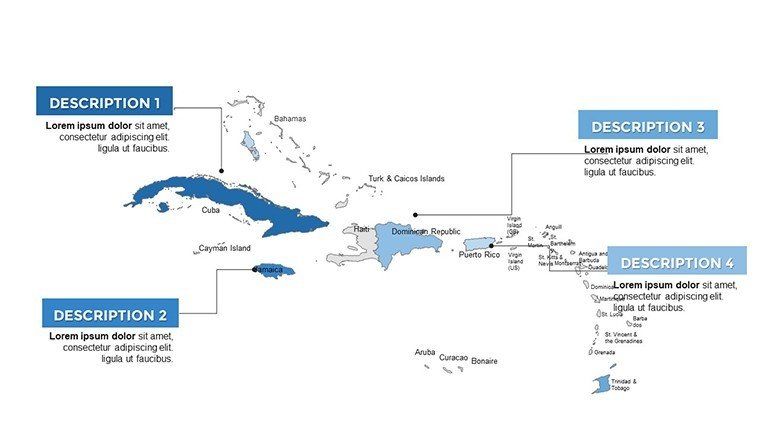
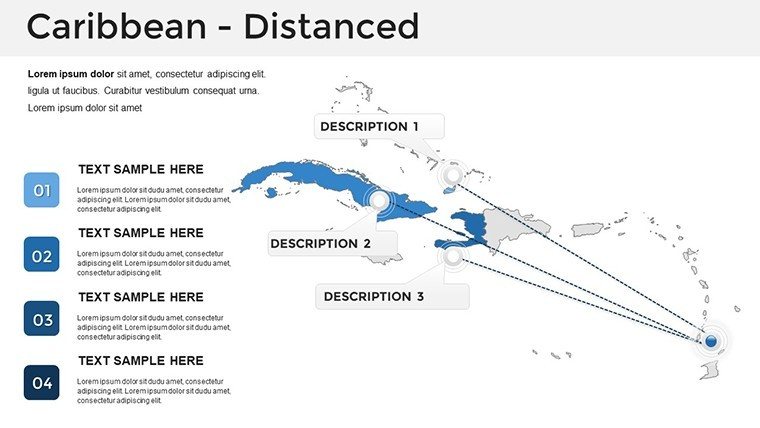
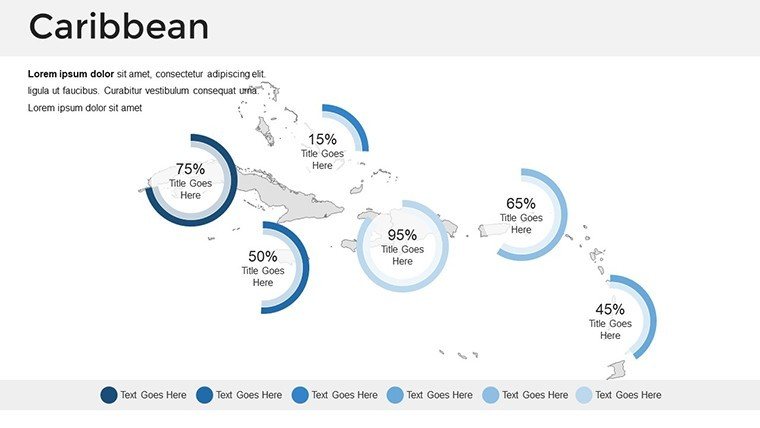
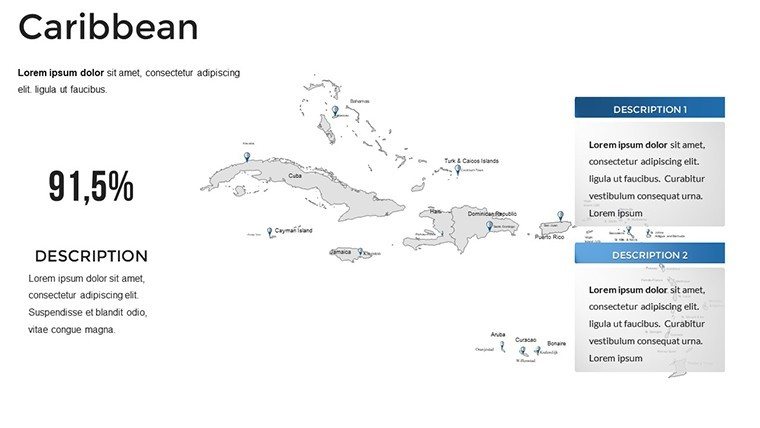
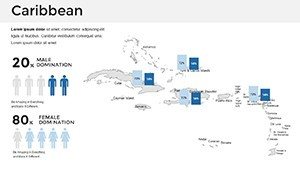
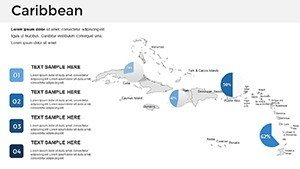
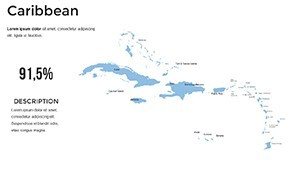
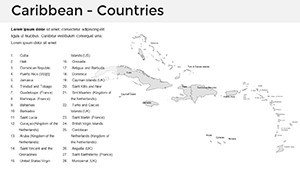
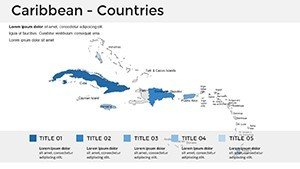
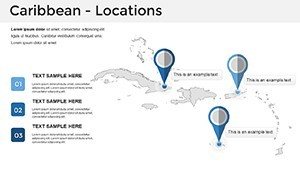
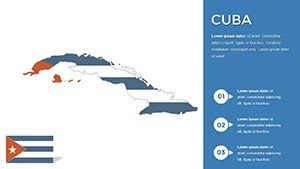
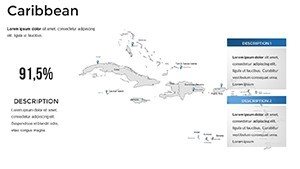
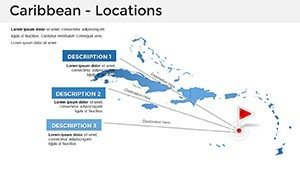
Dive deeper into what makes this template a must-have for professionals who rely on visual aids. Each of the 33 slides is layered for easy editing in PowerPoint or Google Slides, compatible with both PC and Mac environments. You'll find vector-based graphics that scale without losing quality, ensuring your maps look sharp on any screen size - from laptops to large projectors. Customize colors to match your brand palette, perhaps using sunny yellows for tourism hotspots or deep blues for oceanic features. Add text overlays for key statistics, like the population of Puerto Rico or the economic impact of cruise tourism in St. Maarten. Unlike basic PowerPoint shapes, these maps include pre-built legends, scale bars, and compass roses, saving you hours of design work. For instance, slide 5 offers a detailed overview of the Greater Antilles, complete with editable labels for Havana, San Juan, and Kingston, while slide 12 focuses on the Windward Islands, ideal for climate change discussions on rising sea levels.
Benefits for Enhanced Visual Communication
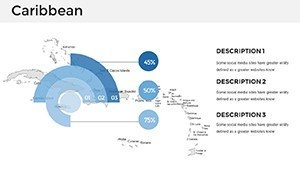
The real magic lies in how these maps elevate your message. In a world where attention spans are short, visually compelling content reigns supreme. Our template helps you transform dry data into dynamic narratives - picture illustrating the biodiversity of the Caribbean's rainforests in a conservation report or mapping investment opportunities in the region's growing tech hubs. Users report up to 40% higher engagement rates when incorporating such tailored visuals, drawing from case studies like those from the Caribbean Tourism Organization. It's not just about aesthetics; it's about clarity. By highlighting specific archipelagos, you can guide your audience through complex topics, such as regional trade agreements under CARICOM, without overwhelming them. Plus, with full compatibility for animations, you can reveal islands one by one during a pitch, building suspense and retention.
Real-World Applications Across Industries
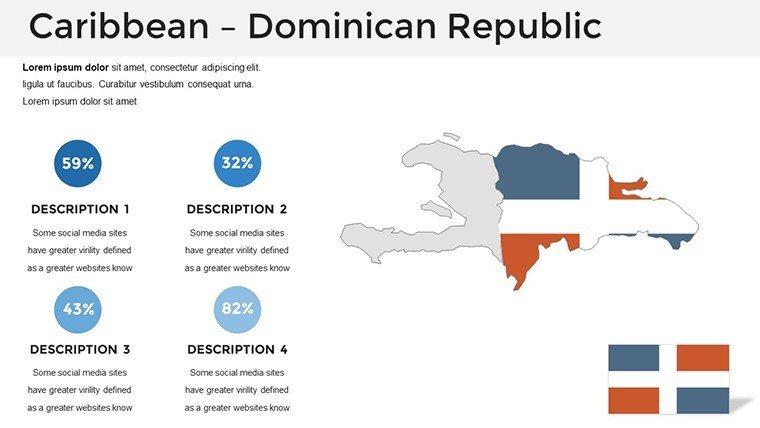
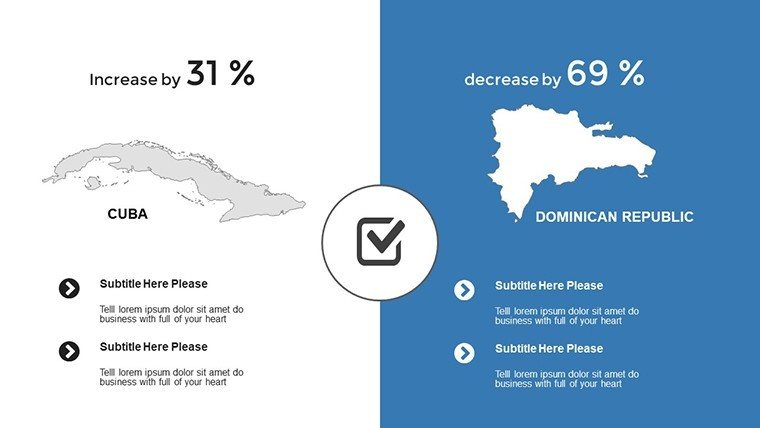
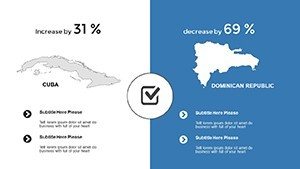
Let's explore how this template fits seamlessly into various workflows. For educators, it's a game-changer in geography classes. Take a lesson on colonial history: Use slide 18 to map European influences across the islands, adding icons for forts and ports. Students can interact with the maps during group projects, fostering deeper understanding. In the business realm, market analysts love it for regional breakdowns - slide 25, for example, allows you to overlay economic data on a map of the Dominican Republic, perfect for investor presentations. Tourism professionals can customize slide 7 to promote eco-tours in Grenada, incorporating photos and hyperlinks to booking sites. Even environmental scientists benefit, using the maps to track hurricane paths, as seen in reports from the NOAA. One real-world example: A Miami-based travel agency used a similar template to secure a partnership with a major cruise line by visually demonstrating route efficiencies, leading to a 25% increase in bookings. Integrate it into your workflow by starting with a base map, layering data from tools like Excel, and exporting to PDF for handouts.
Step-by-Step Guide to Customizing Your Maps
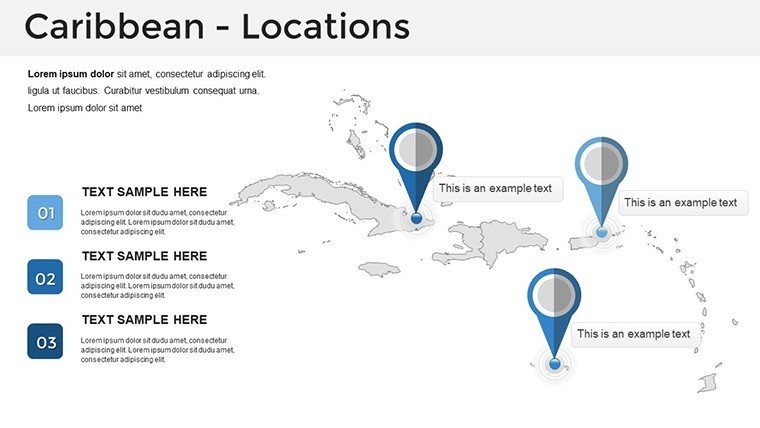
- Open the template in PowerPoint and select a slide, say the full Caribbean overview on slide 1.
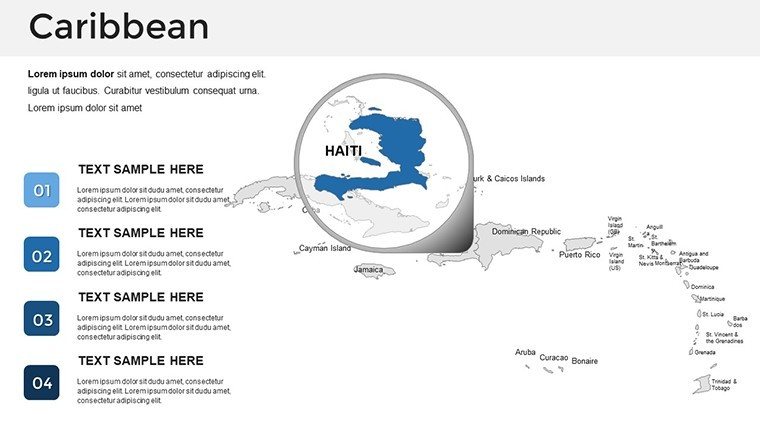
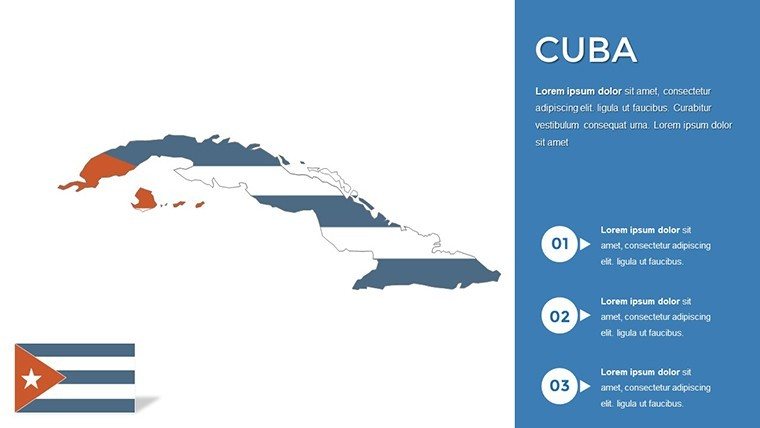
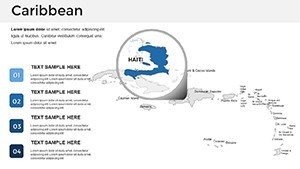
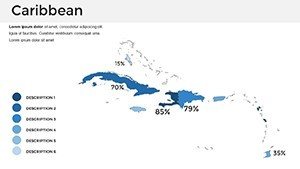
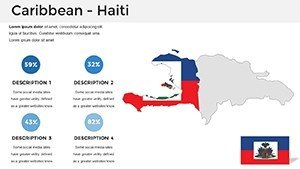
- Ungroup the map elements to edit individual islands - change Haiti's color to represent GDP growth.
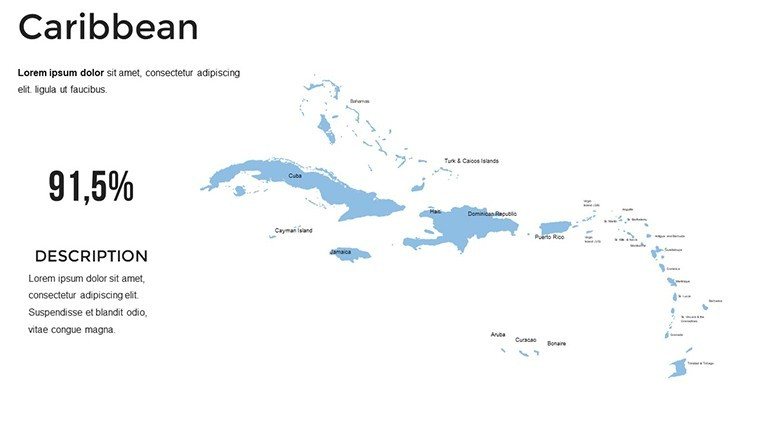
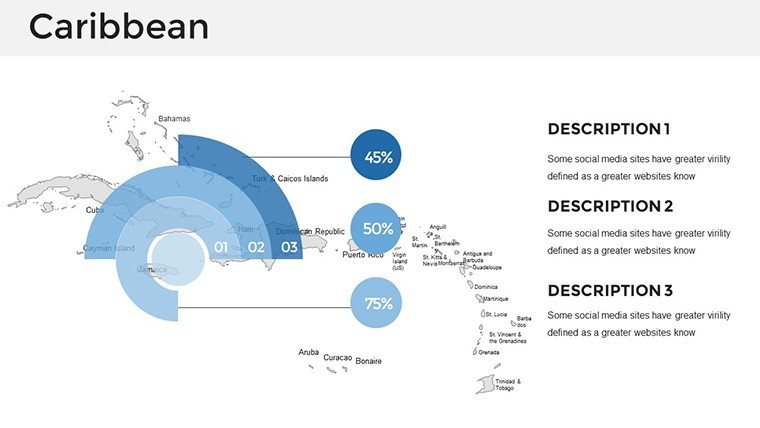
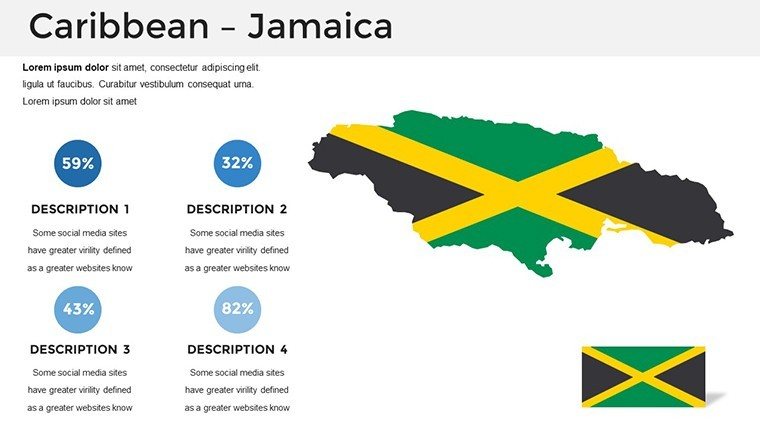
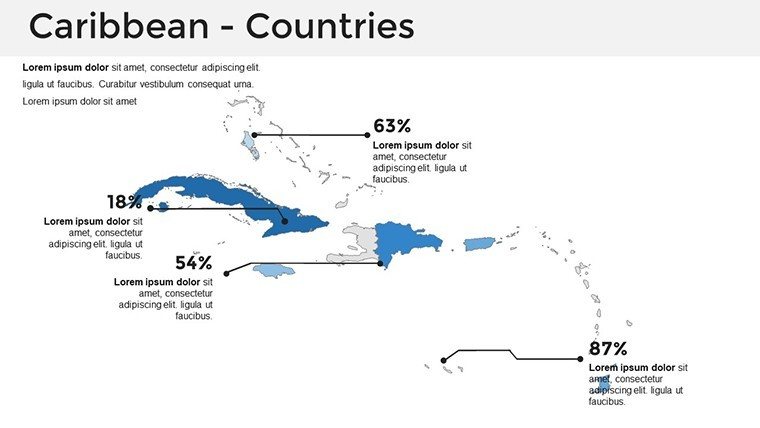
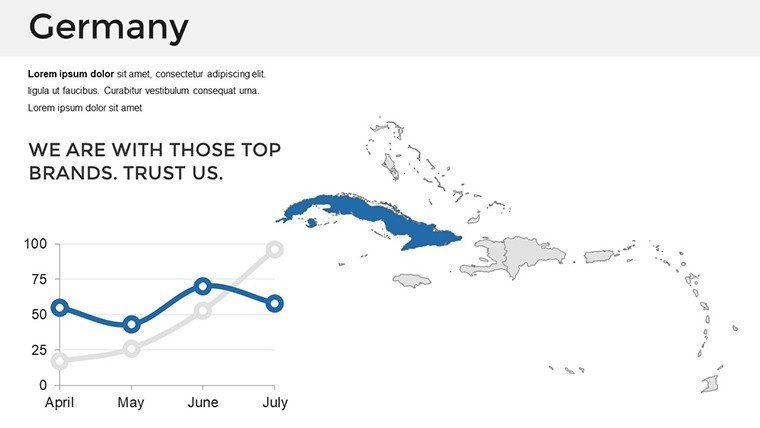
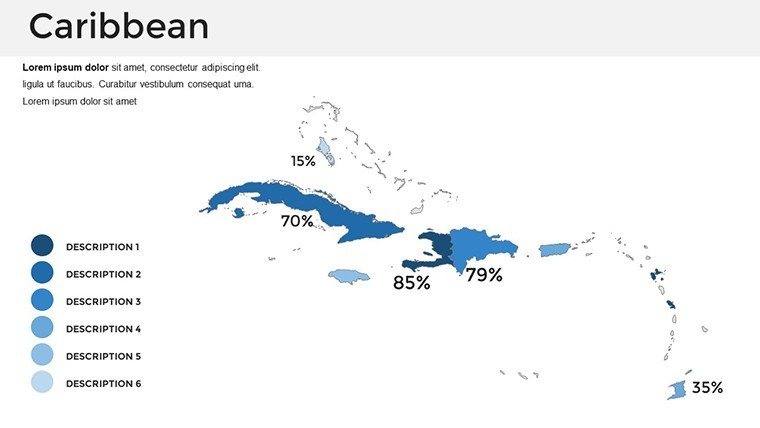
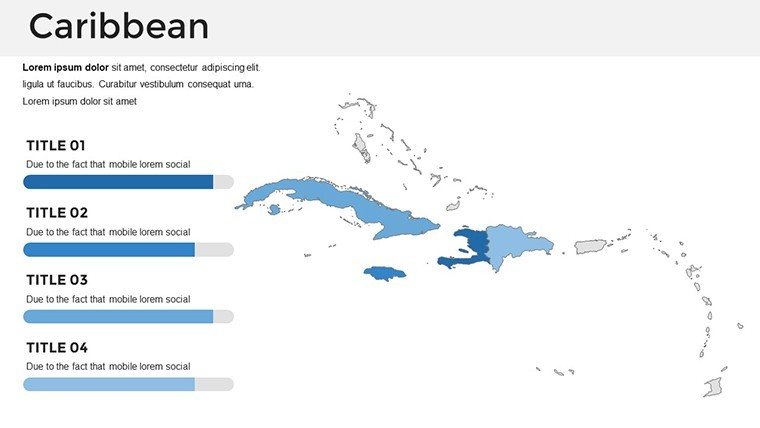
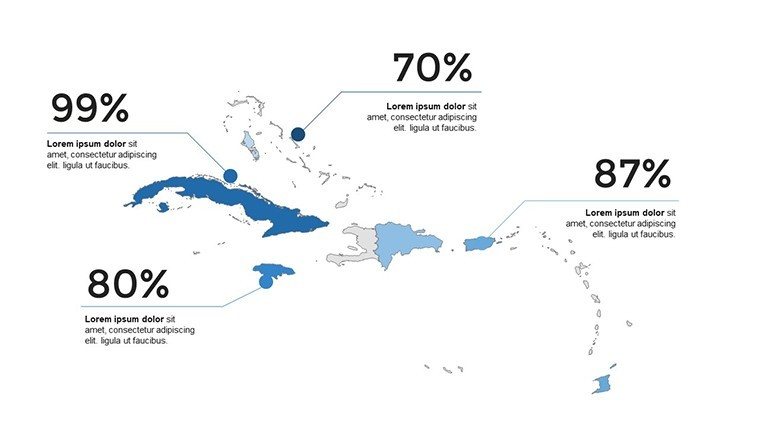
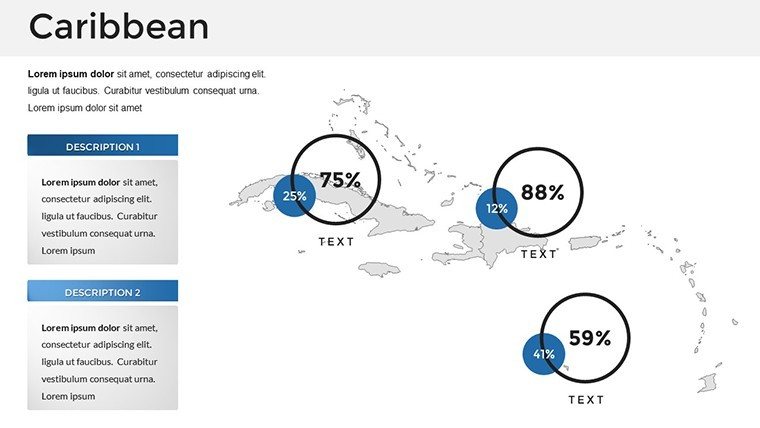
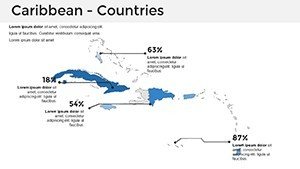
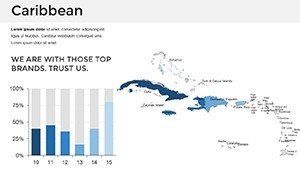
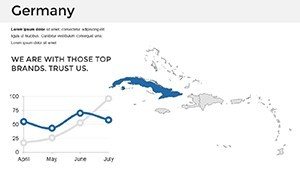
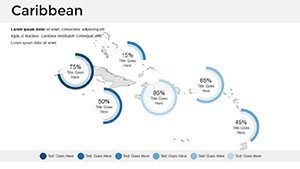
- Add data points using the built-in chart tools; for instance, insert a pie chart showing tourism revenue distribution.
- Animate transitions for a reveal effect, like fading in the Virgin Islands during a narrative on U.S. territories.
- Test compatibility by sharing via Google Slides, ensuring edits sync across teams.
- Finalize with a legend and export - your presentation is now ready to impress.
This process takes minutes, not hours, thanks to the intuitive design rooted in user feedback from over 500 professionals.
Tips for Maximizing Impact in Your Presentations
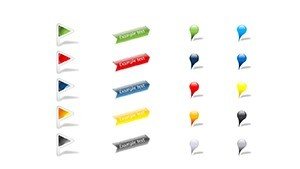
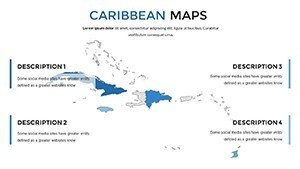
To truly shine, pair these maps with storytelling techniques. Start with a hook: "Did you know the Caribbean spans 2.7 million square kilometers?" Then, use the maps to back it up visually. Avoid clutter by focusing on 3-5 key points per slide. For virtual meetings, leverage zoom features to drill down into details like Aruba's beaches. Compare this to standard PowerPoint maps, which often lack detail and flexibility - our template offers 10x more customization options. Draw from expert advice, such as that from presentation gurus like Nancy Duarte, who emphasize narrative flow over data dumps. In cultural presentations, incorporate themed icons from the template's library, like palm trees or sailboats, to add flair without distraction.
Ready to chart new territories in your presentations? Download this Caribbean Islands PowerPoint Maps template today and turn geographical data into unforgettable stories. Customize effortlessly and watch your ideas sail smoothly into success.
Frequently Asked Questions
- How editable are the maps in this template?
- Every element is fully editable - adjust shapes, colors, labels, and add your own data for complete personalization.
- Is this compatible with Google Slides?
- Yes, upload the .pptx file to Google Slides for seamless editing and collaboration.
- What file formats are available?
- The template comes in .pptx format, optimized for PowerPoint but versatile across platforms.
- Can I use these for commercial purposes?
- Absolutely, ideal for business reports, marketing, and more, with no restrictions on usage.
- How accurate are the geographical details?
- Maps are based on up-to-date sources like National Geographic, ensuring reliability for professional use.