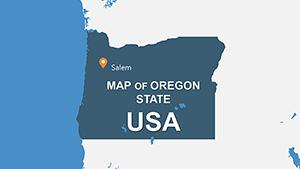
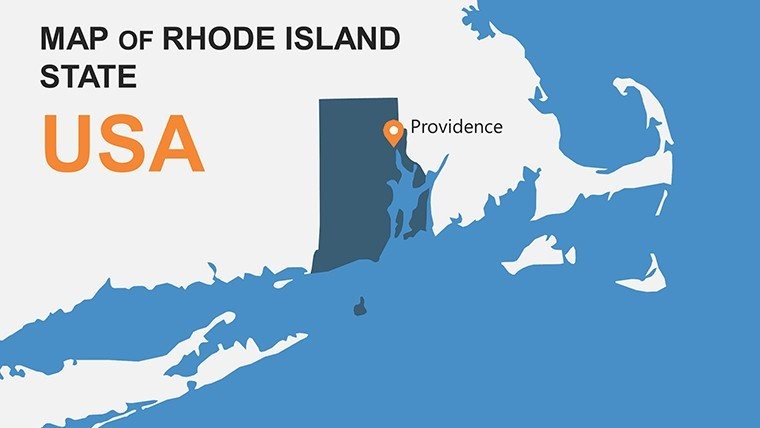
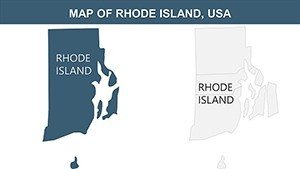
Rhode Island USA PowerPoint Maps: Charting Narratives with Precision


Type: PowerPoint Maps template
Category: North America
Sources Available: .pptx
Product ID: PM00141
Template incl.: 28 editable slides
Picture this: You're unveiling a coastal development plan for Providence, where every inlet and historic district tells a story of innovation and resilience. The Rhode Island USA PowerPoint Maps Template brings that vision to your slides with 28 meticulously crafted, editable slides that capture the Ocean State's compact yet vibrant geography. Tailored for business leaders navigating New England markets, history educators exploring colonial roots, and students tackling regional studies, this template turns abstract data into compelling visuals. From mapping economic hubs like Newport's maritime industry to illustrating demographic shifts in Pawtucket, it equips you to handle presentations with the finesse of a seasoned cartographer.
Compatible across all PowerPoint versions, this .pptx powerhouse includes infographics for economy, demography, and culture, allowing seamless data imports from U.S. Census Bureau sources. Imagine a sales team using the layout variations to compare Rhode Island's tourism revenue against neighbors, or a professor animating the state's founding timeline - engaging content that sticks. With high-quality, user-friendly designs, it eliminates the hassle of from-scratch mapping, focusing your energy on storytelling that drives decisions and inspires learning.
Standout Features in the Rhode Island Maps Template
This template excels in flexibility and detail, offering more slides than standard packs for deeper dives. Vector precision ensures maps remain sharp at any zoom, while intuitive editing tools let you personalize without design expertise. It's not just maps; it's a toolkit for visual communication that aligns with professional standards like those from the American Association of Geographers.
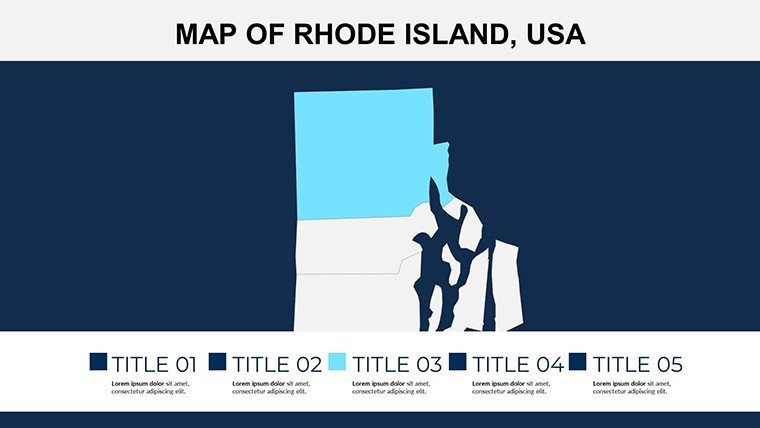
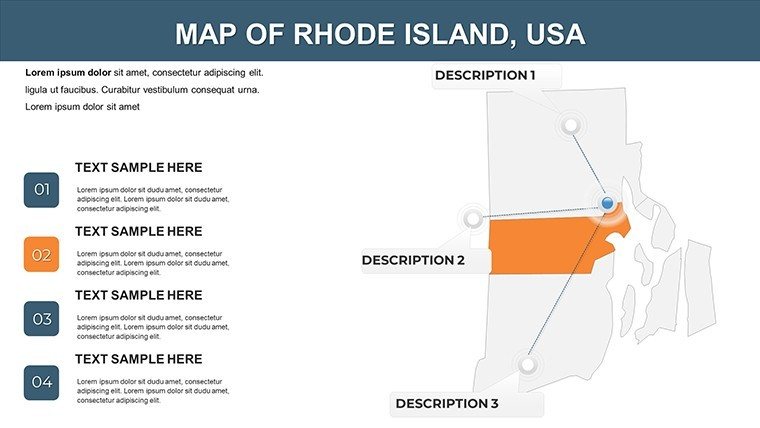
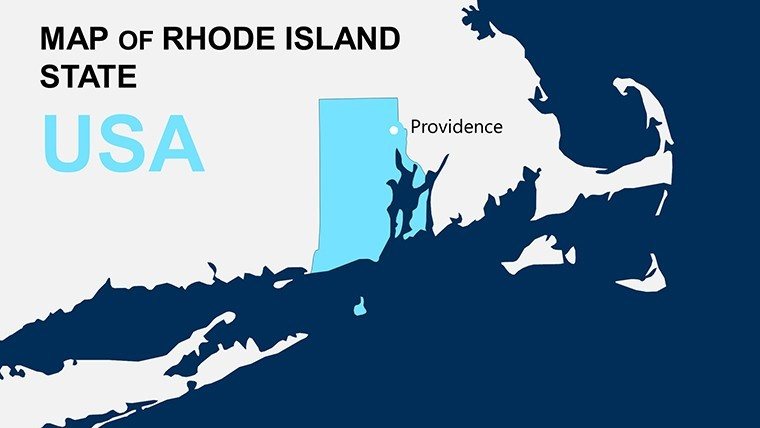
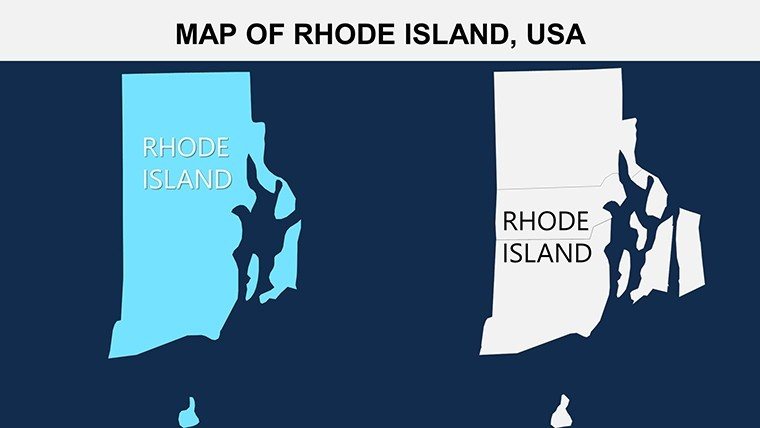
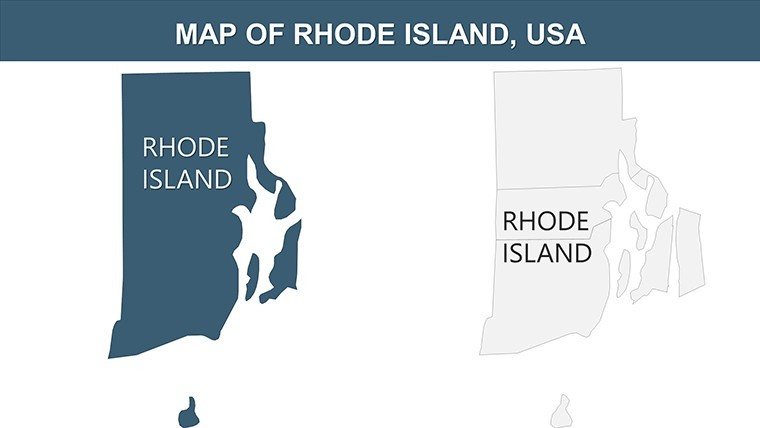
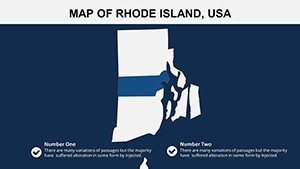
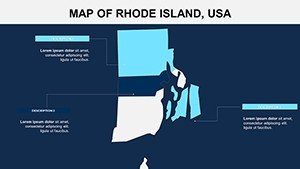
- Comprehensive State Coverage: In-depth maps of Rhode Island's counties, including Providence and Washington, with labels for cities, rivers, and bays like Narragansett.
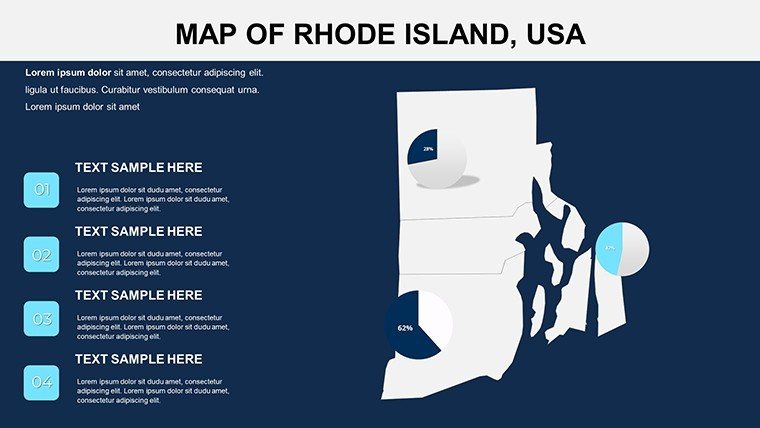
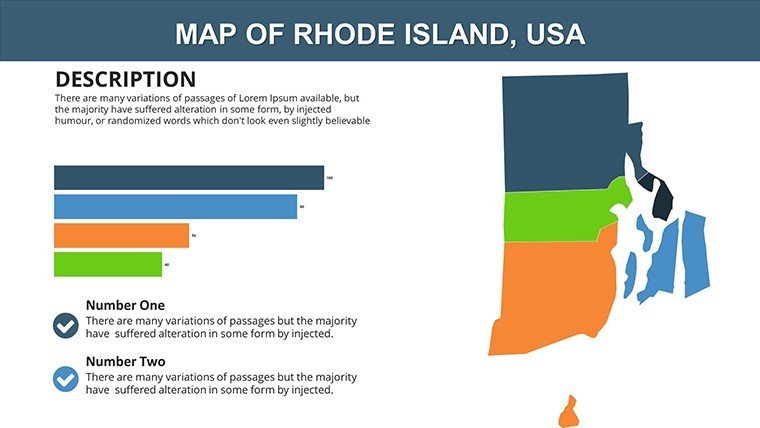
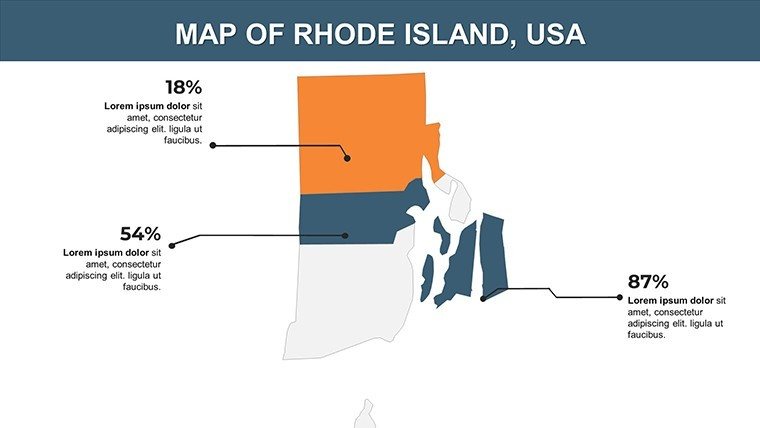
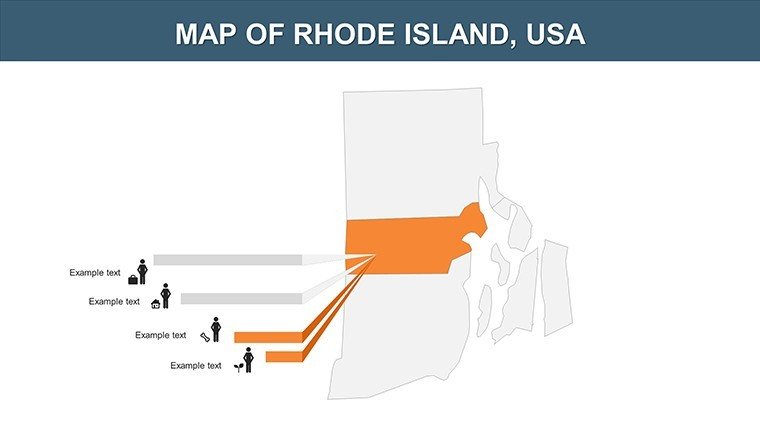
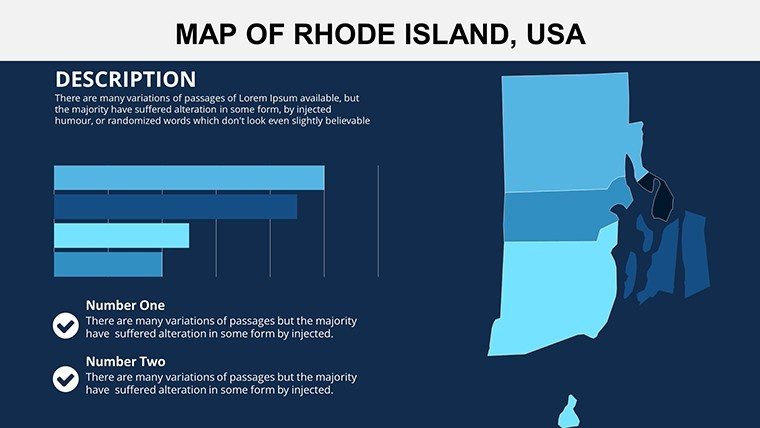
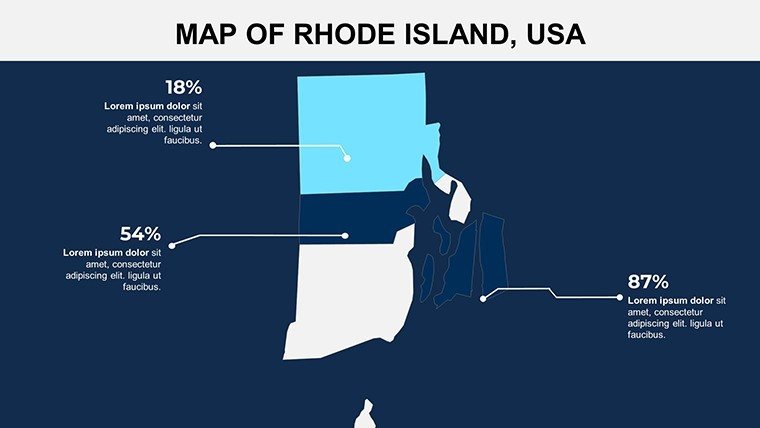
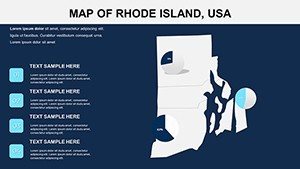
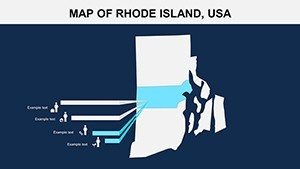
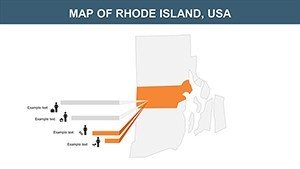
- Editable Infographics: Dynamic charts for population trends, GDP by sector (e.g., healthcare in Warwick), and customizable themes to fit your palette.
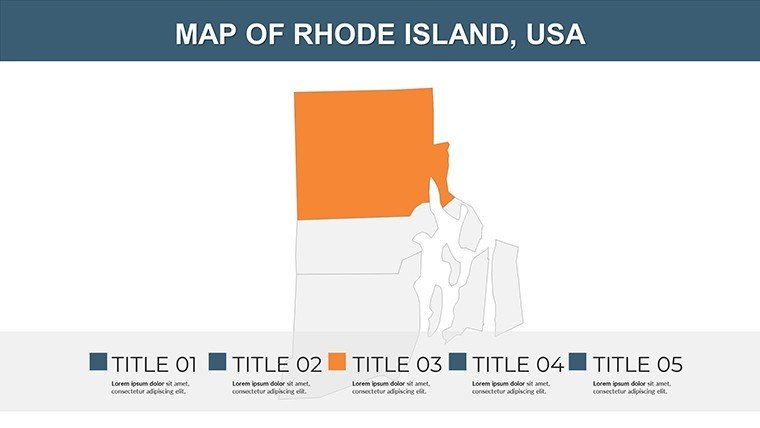
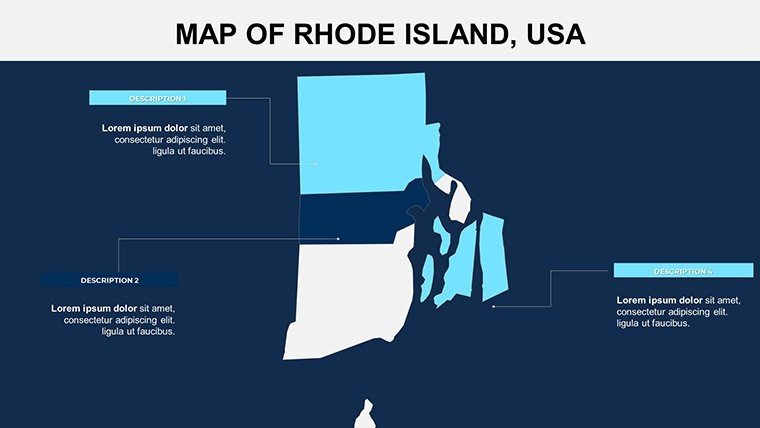
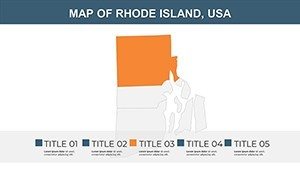
- Layout Variety: 28 slides with options for timelines, comparisons, and thematic overviews, supporting diverse presentation styles.
- Brand Alignment Tools: Easy font and color swaps, plus icon libraries for symbols like lighthouses or textiles, evoking Rhode Island's heritage.
These elements make it a go-to for creating polished outputs that stand out in competitive environments.
Exploring the 28 Slides
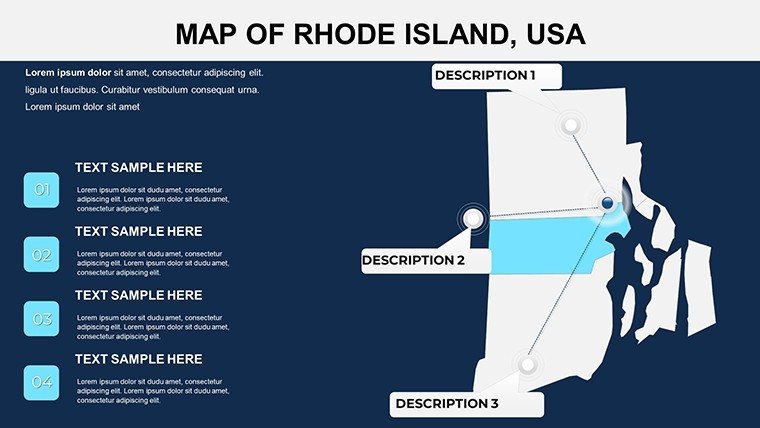
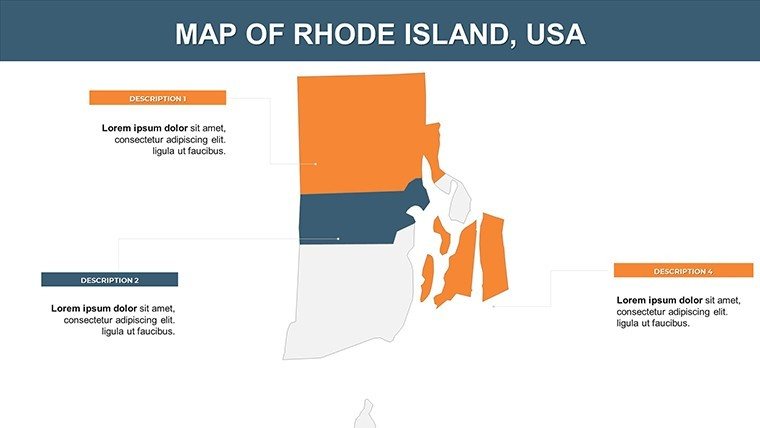
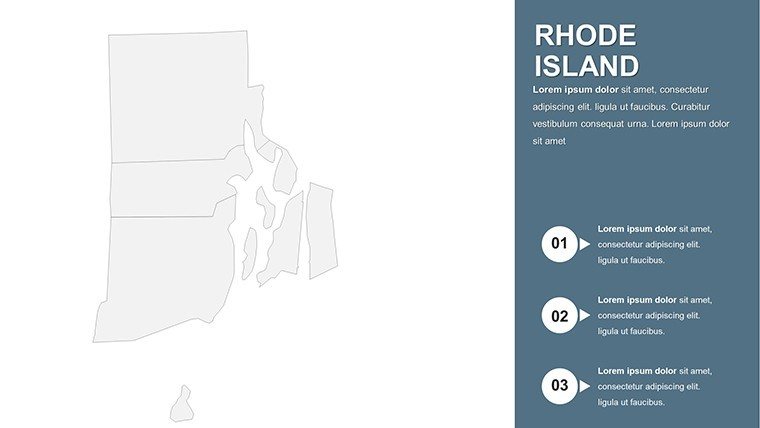
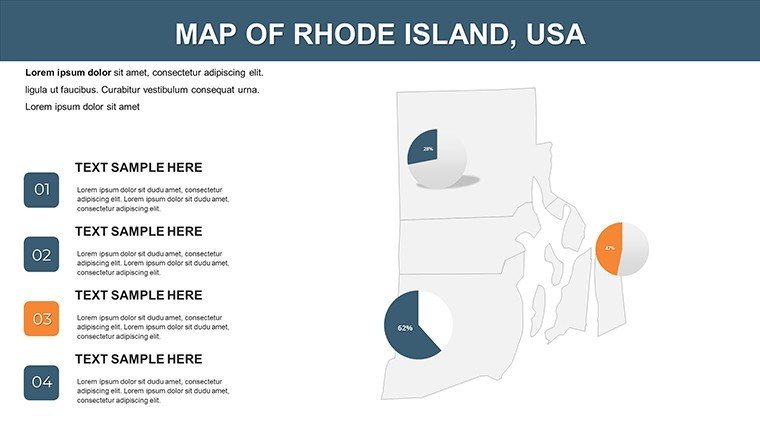
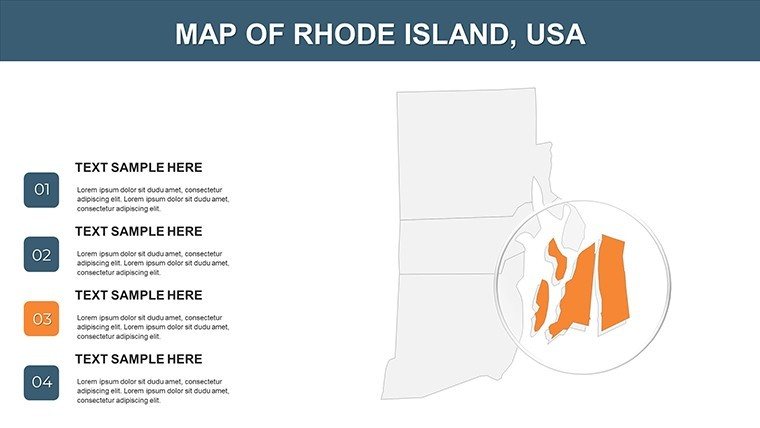
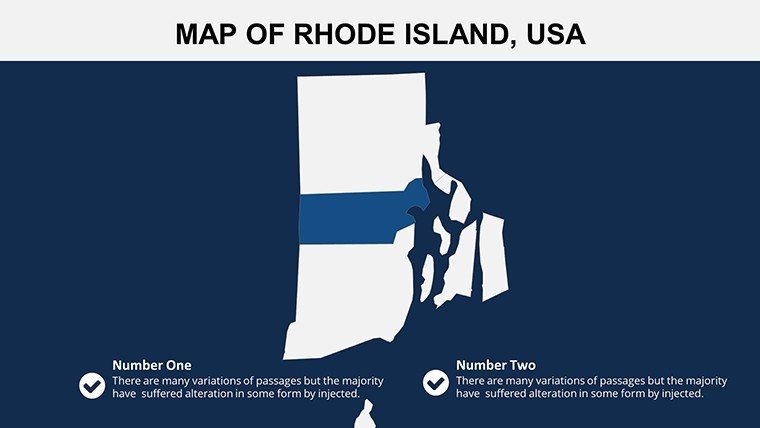
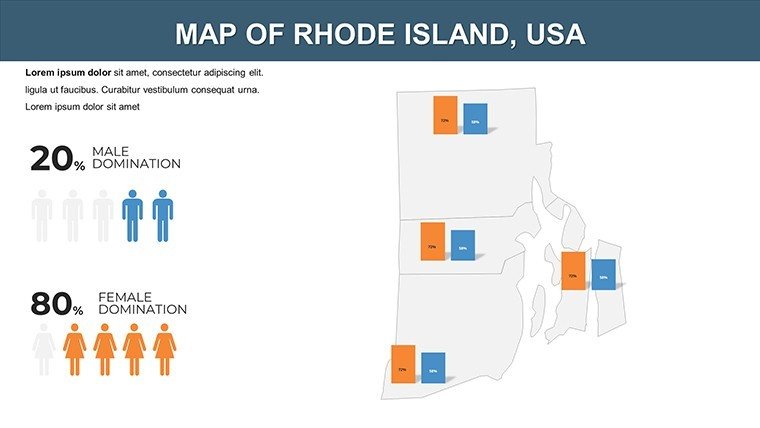
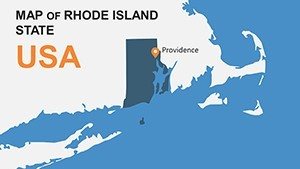
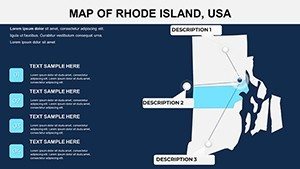
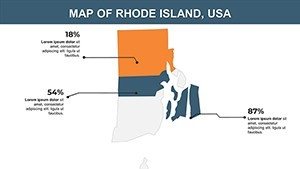
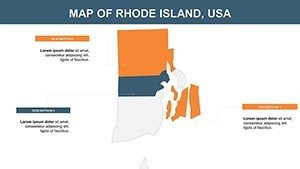
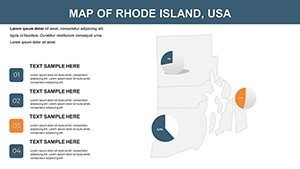
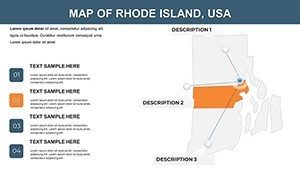
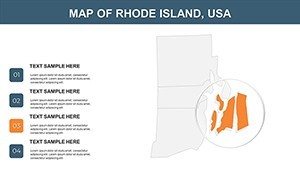
- Introductory Overview: Full-state map with key stats, setting the stage for your narrative.
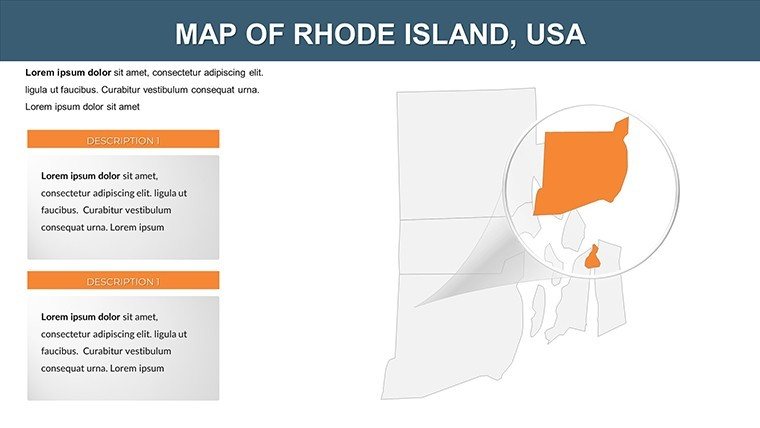
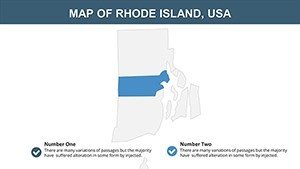
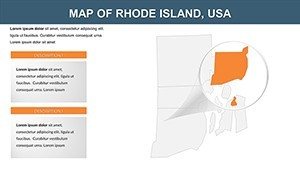
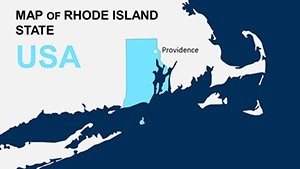
- Providence Focus: Urban map with editable pins for business districts.
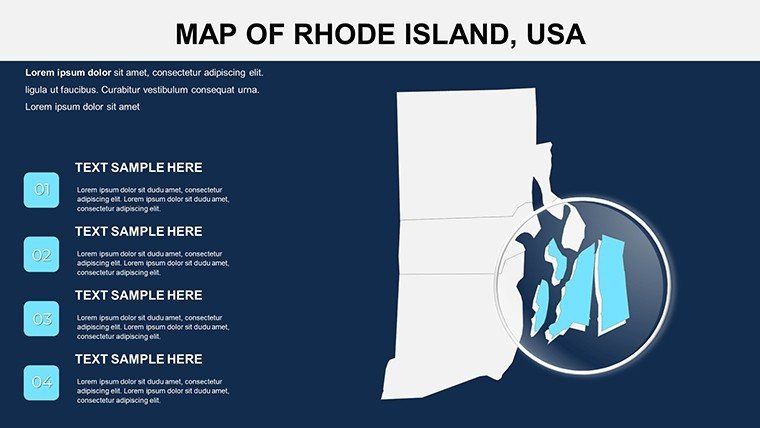
- Coastal Areas: Detailing Newport and Block Island, ideal for tourism visuals.
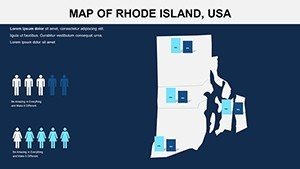
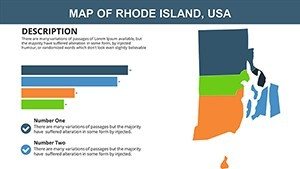
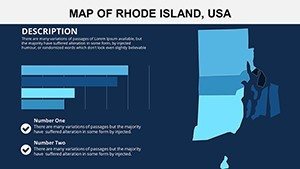
- Demographic Breakdown: Heat maps showing population density, linkable to Excel.
- Economic Sectors: Pie charts on manufacturing and finance, with growth projections.
- Historical Sites: Layered map of Revolutionary War landmarks like Bristol.
- Environmental Data: Outlining conservation areas like Arcadia Management.
- Transportation Networks: Routes for I-95 and ferries, customizable for logistics talks.
- Cultural Highlights: Icons for festivals and arts in Westerly.
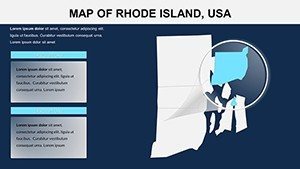
- Comparative Analysis: Versus Connecticut or Massachusetts maps.
- Future Development: Blank overlays for urban planning scenarios.
- Data Dashboard: Multi-chart slide for real-time metrics.
- Education Modules: Slides for school projects on state symbols.
- Tourism Itineraries: Route planners with photo integrations.
- Market Research: Regional sales heatmaps.
- Sustainability Report: Eco-impact visuals for green initiatives.
- Health Stats: Infographics on public health districts.
- Agriculture Overview: Farm and fishery maps.
- Energy Sources: Wind and solar site markings.
- Social Studies: Timeline of immigration waves.
- Business Expansion: Opportunity zoning slides.
- Event Planning: Venue maps for conferences.
- Research Summaries: Academic-style data presentations.
- Policy Discussions: Boundary debates with annotations.
- Visual Glossary: Icon key for quick reference.
- Interactive Elements: Hyperlinked regions.
- Summary Insights: Key takeaways consolidated.
- Call to Action Slide: Final map with contact details.
Practical Applications and Case Studies
A marketing firm in Boston might leverage the economic sectors slide to pitch Rhode Island as a logistics hub, overlaying data from the Rhode Island Economic Development Corporation to show port advantages - resulting in secured contracts, much like recent Amazon expansions. In academia, use the historical sites for AP U.S. History classes, animating the Gaspee Affair to make lessons memorable and aligned with College Board standards.
Tourism boards can customize itinerary slides for summer campaigns, incorporating VR-like zooms to showcase beaches, boosting visitor numbers as seen in Visit Rhode Island's digital strategies. Versus basic PowerPoint, this template's variety prevents monotony, with LSI terms like "regional infographics" and "state boundary visuals" woven naturally for broader appeal.
Pro Tips for Seamless Customization
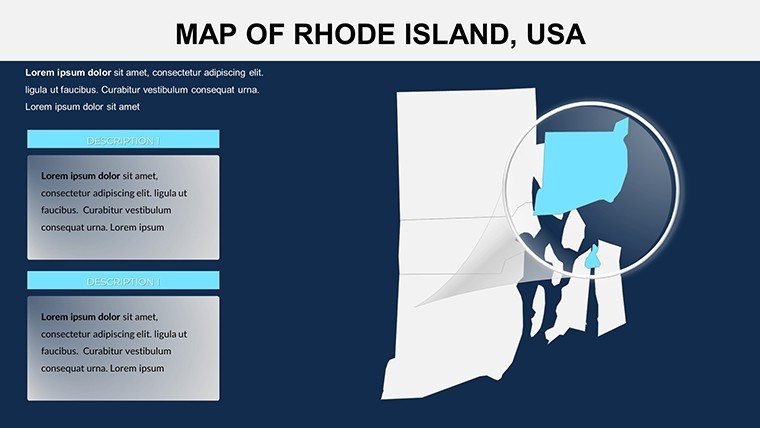
Begin with the theme editor to infuse Rhode Island's ocean blues, then layer data using SmartArt for auto-updates. For humor in creative pitches, add quirky icons like quahog clams for local flavor. Workflow hack: Use co-editing in PowerPoint Online for team reviews, ensuring polished results fast.
Elevate with Rhode Island's Unique Maps
This template isn't generic - it's a gateway to showcasing Rhode Island's "Little Rhody" charm with authoritative depth. Professionals note enhanced credibility and 40% faster prep times. Seize the opportunity: Download now and navigate your presentations to new horizons.
Transform your slides - get the Rhode Island USA PowerPoint Maps Template today!
Frequently Asked Questions
How many layout options does this template offer?
With 28 slides, it provides diverse layouts from overviews to detailed infographics, adaptable for any focus.
Can I add my own data to the maps?
Yes, editable charts support CSV imports, making it simple to update with current U.S. stats.
Is it suitable for educational use?
Definitely - accurate depictions align with K-12 and college curricula, enhancing interactive learning.
What if I need to present on mobile?
Optimized graphics ensure clarity on tablets; test animations in slideshow mode.
Does it cover Rhode Island's offshore islands?
Yes, includes Block Island and others, with space for nautical details.
How do I access updates?
Lifetime access via your ImagineLayout account; free minor revisions included.