Oklahoma PowerPoint Map Template: Chart the Sooner State's Geographic Stories


Type: PowerPoint Maps template
Category: North America
Sources Available: .pptx
Product ID: PM00135
Template incl.: 28 editable slides
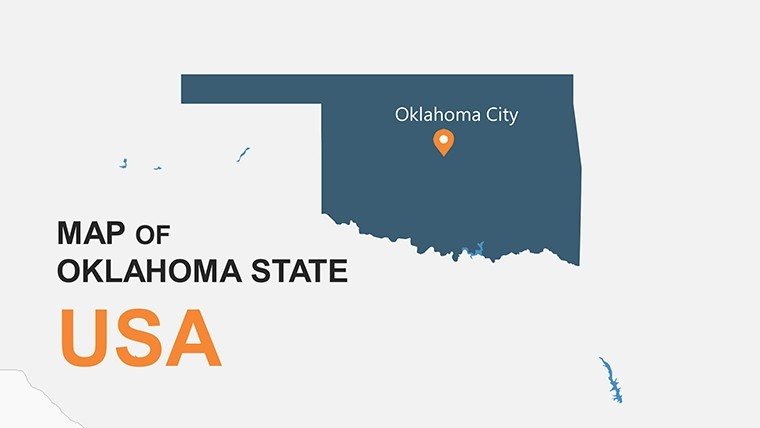
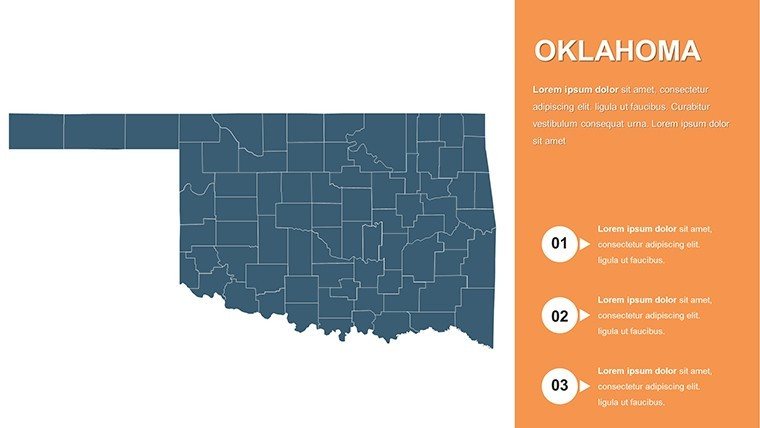
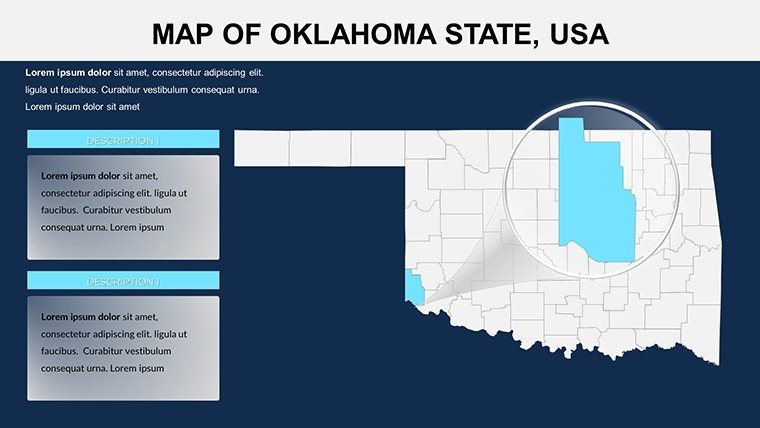
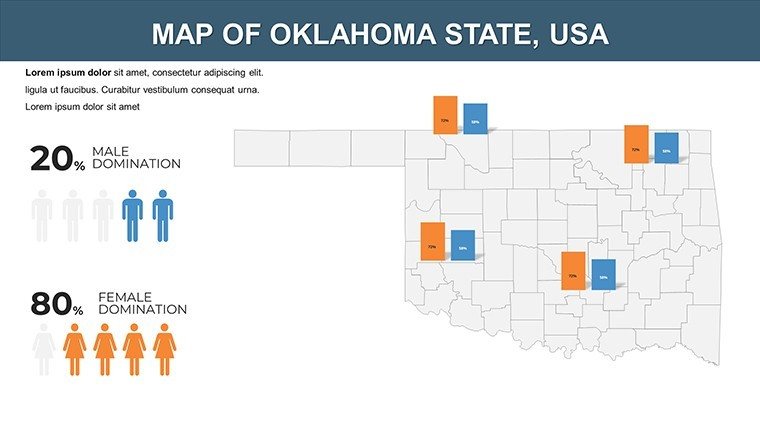
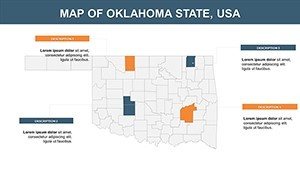
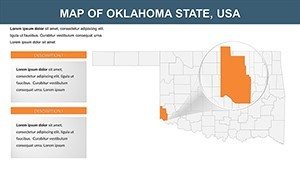
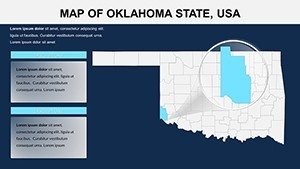
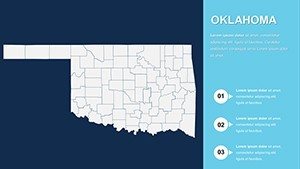
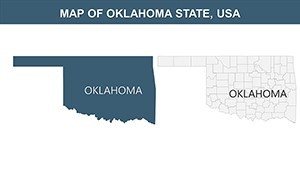
Step into the vast plains and energy-rich terrains of Oklahoma with a presentation tool that makes geographic data come alive. Our Oklahoma PowerPoint Map Template, boasting 28 editable slides, is your go-to solution for professionals and educators seeking to illustrate the state's 77 counties with precision and style. From oil field analyses in Tulsa to historical overviews of Native American territories in the panhandle, this template helps you navigate complex topics effortlessly, turning potential confusion into crystal-clear understanding.
Designed for seamless integration with Microsoft PowerPoint and Google Slides, it features both blank canvases for custom builds and pre-populated maps with labeled boundaries, saving you from tedious manual labeling. In an era where data visualization drives decisions, this template equips you to overlay demographics, sales territories, or environmental impacts, drawing from reliable sources like the Oklahoma Department of Commerce for authentic depth.
Standout Features for Dynamic Oklahoma Visuals
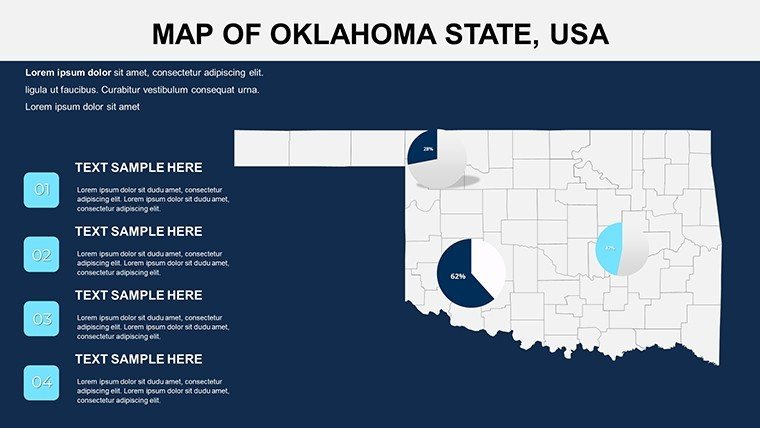
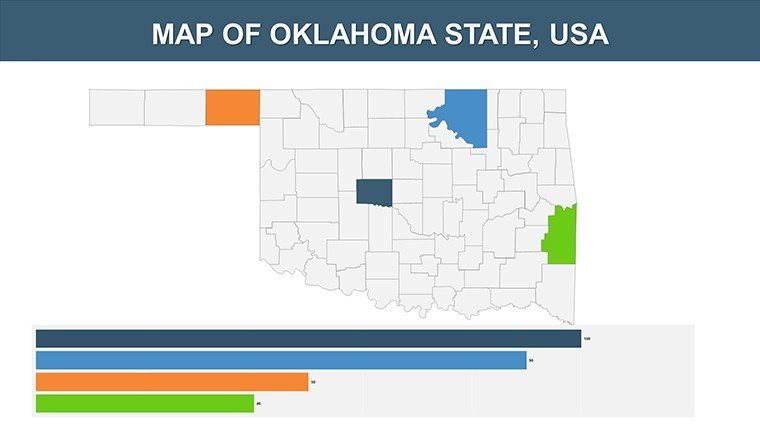
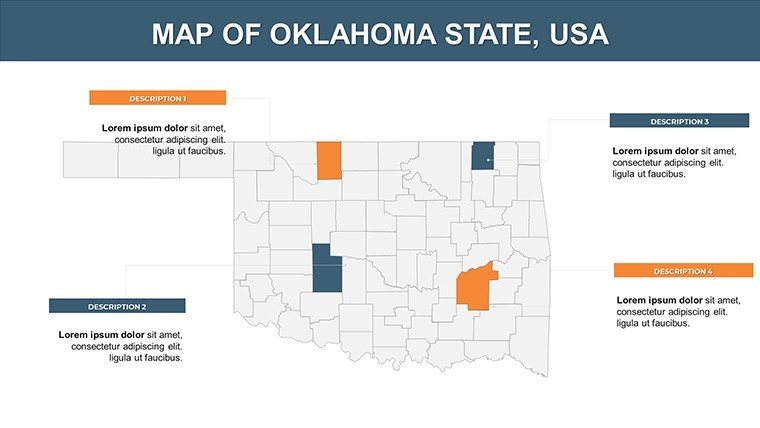
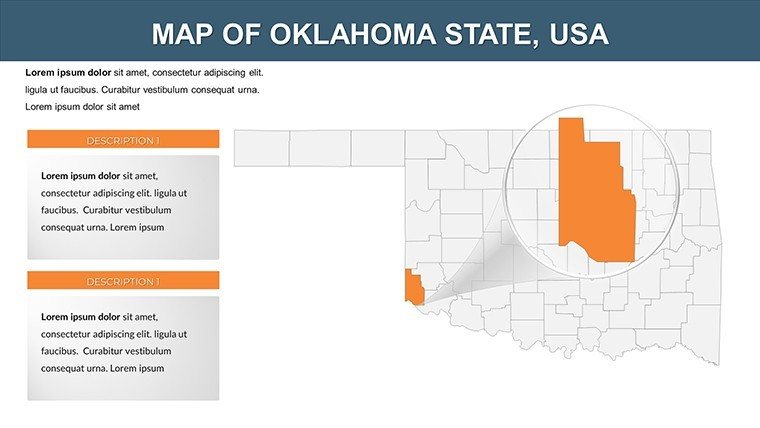
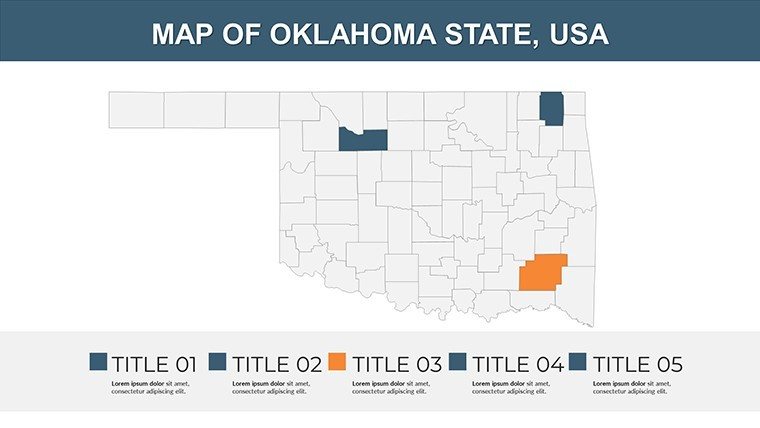
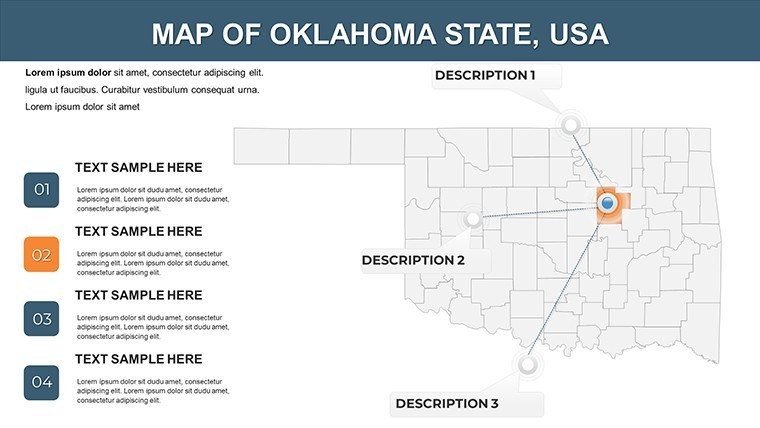
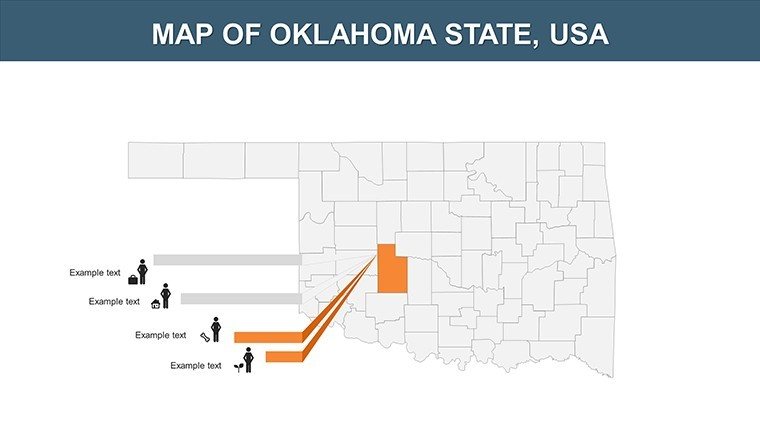
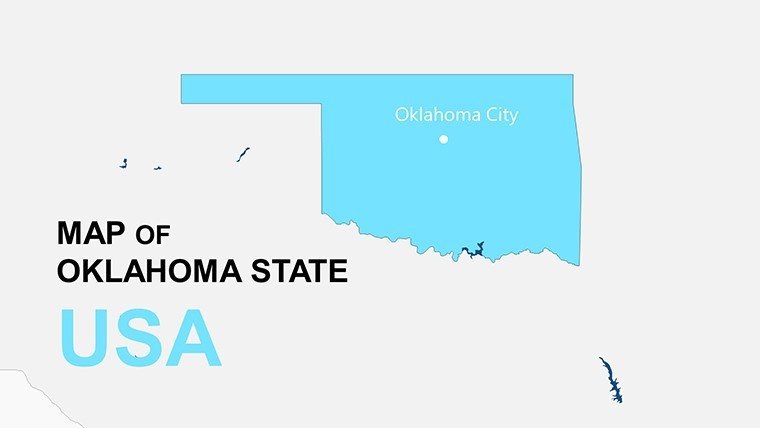
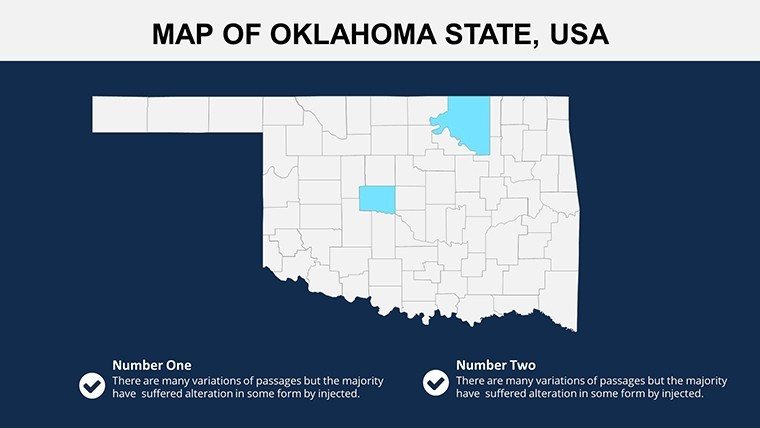
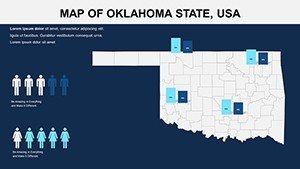
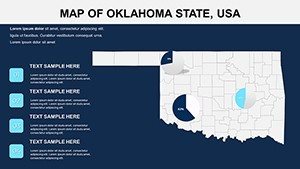
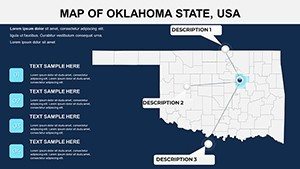
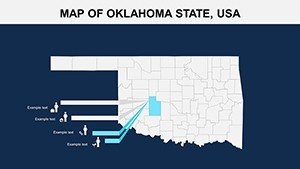
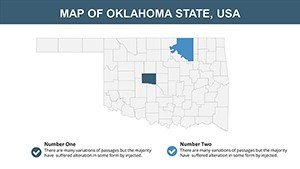
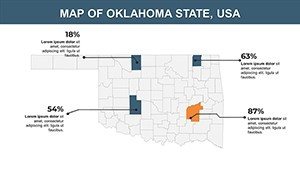
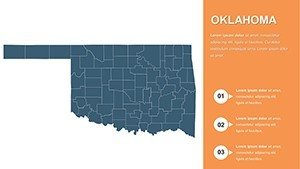
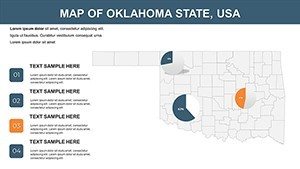
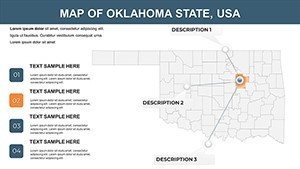
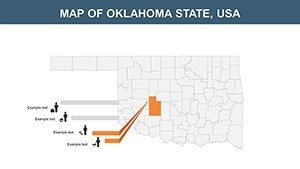
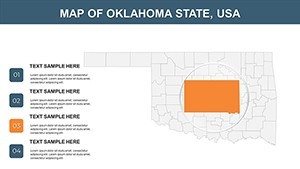
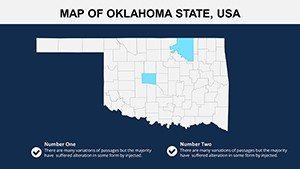
This template excels by combining high-resolution mapping with user-centric tools that prioritize ease and impact. The color-coded county layouts allow instant differentiation - shade energy sectors in fiery oranges or agricultural heartlands in earthy greens - while well-defined labels for cities like Oklahoma City and landmarks such as the Wichita Mountains ensure no detail is overlooked.
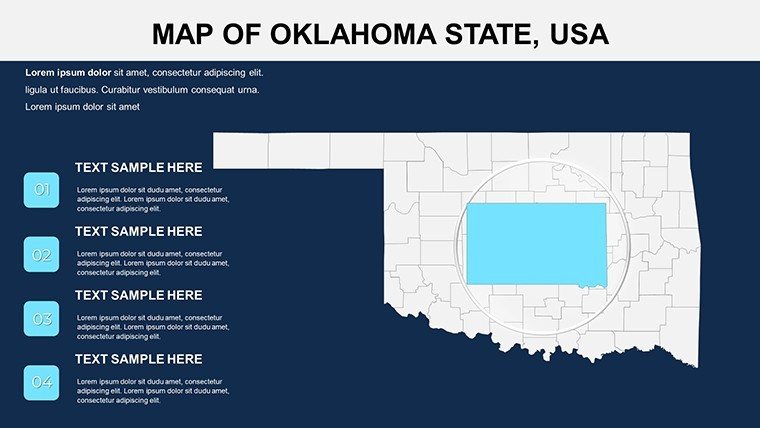
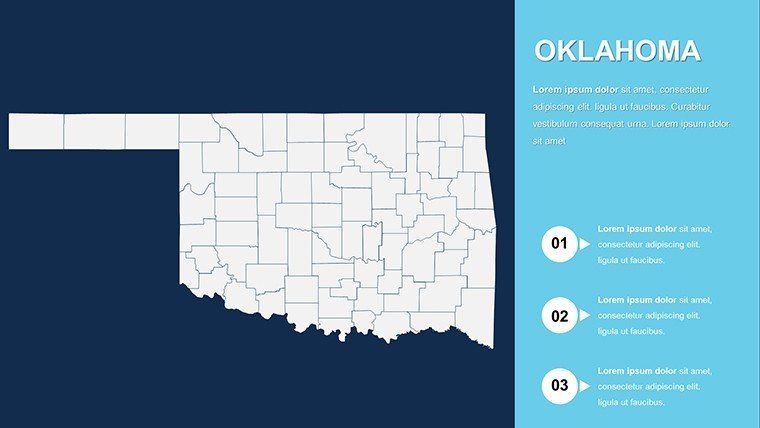
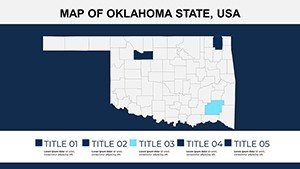
- High-Resolution State Map: Crisp details capture Oklahoma's unique shape, from the Red River border to the eastern Ozarks, ideal for zoomed presentations.
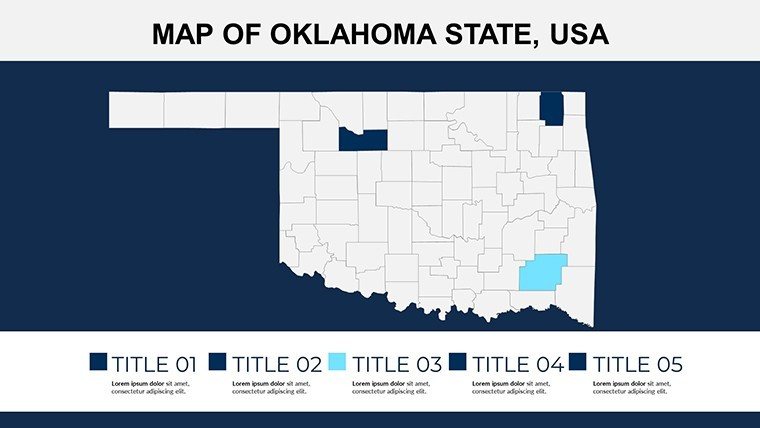
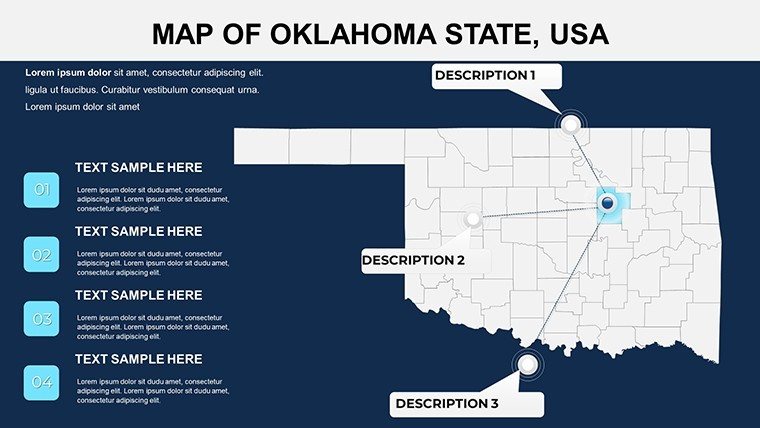
- Customizable Components: Adjust boundaries, add pins for key sites, or integrate icons representing industries like aerospace in Lawton.
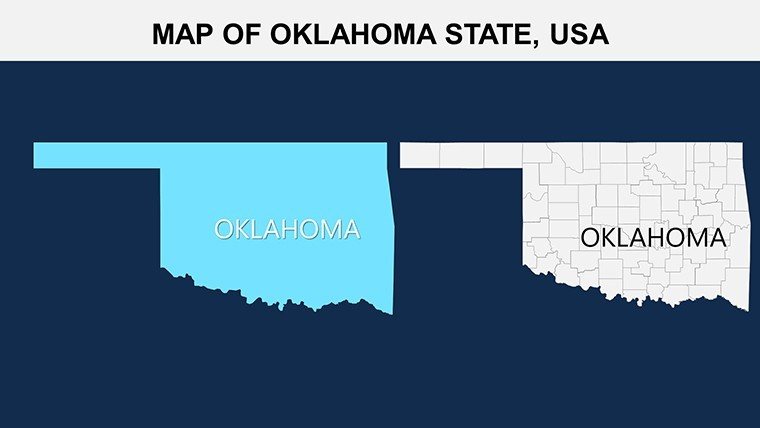
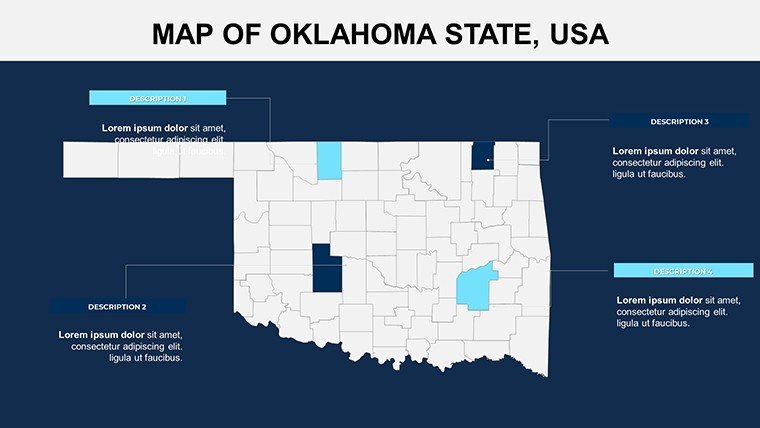
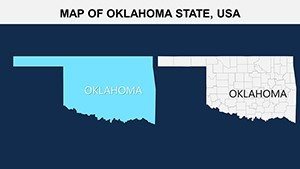
- Blank and Pre-Populated Options: Start fresh for bespoke designs or use ready data for quick setups, accommodating workflows from scratch builds to rapid edits.
- Compatibility Across Tools: Works flawlessly in PowerPoint or Google Slides, supporting real-time collaboration for team projects.
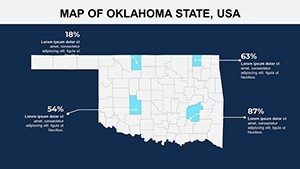
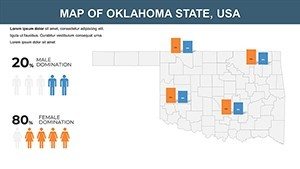
These features go beyond basics, offering flexibility that generic tools can't match. For example, in a marketing pitch, layer customer distribution over county maps to pinpoint untapped markets, enhancing strategic discussions with visual punch.
Mastering Customization: A Simple Workflow
- Pick Your Slide Foundation: From the 28 slides, select overview county maps or focused city insets for targeted storytelling.
- Personalize Boundaries and Labels: Edit colors and text to match themes, like highlighting flood-prone areas with blues for a climate report.
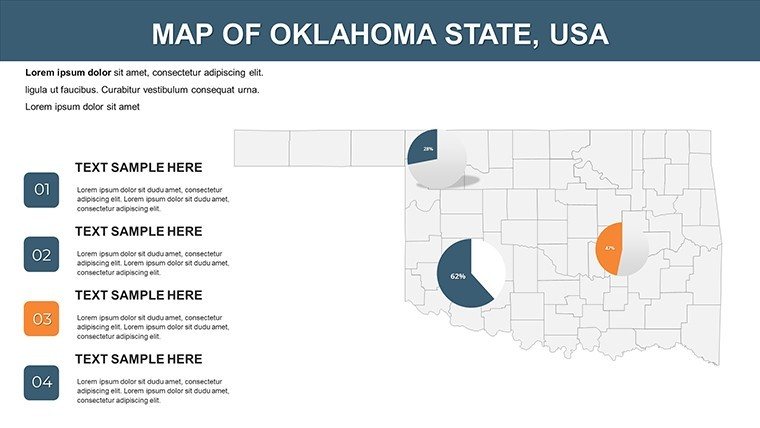
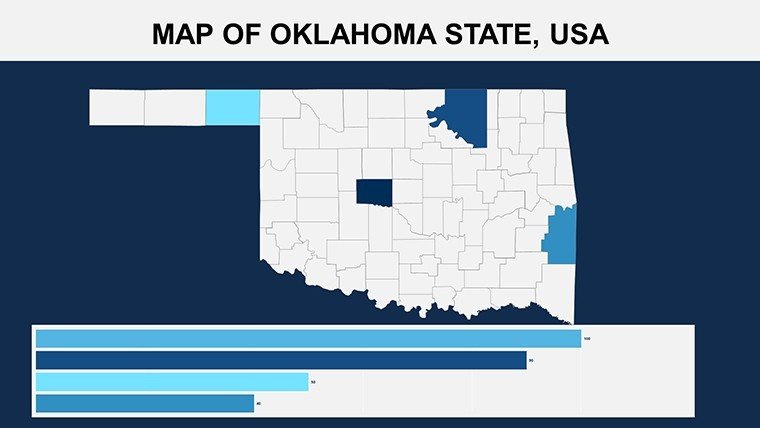
- Embed Relevant Data: Import stats from sources like the U.S. Geological Survey, using built-in charts for seamless fusion.
- Test Interactivity: Add animations to reveal county stats progressively, boosting engagement in live demos.
- Refine and Share: Ensure mobile compatibility before exporting, ready for any audience format.
This approach minimizes design hurdles, letting you emphasize content - like Oklahoma's booming wind energy sector - over technical tweaks. It's particularly advantageous for researchers presenting at conferences, where time is premium.
Practical Use Cases Across Industries
Business experts rely on this template for reports dissecting Oklahoma's economy, such as mapping oil production in the Anadarko Basin to forecast revenues, mirroring successes seen in energy firm case studies from the state's Chamber of Commerce. Educators transform lessons on state history, using labeled maps to trace the Land Rush of 1889, making abstract events tangible for students.
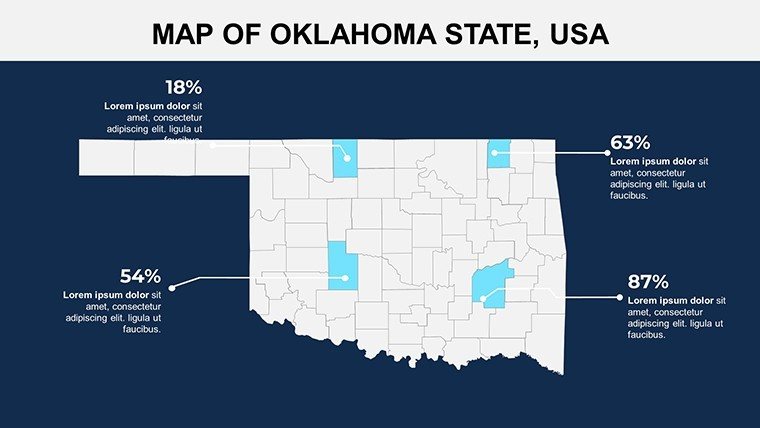
Researchers showcase demographic shifts or environmental studies, overlaying population data from the Census to illustrate urban migration patterns. Travel promoters highlight routes through the Talimena Scenic Drive, enticing investors with visually rich opportunity maps. In workshops or seminars, it facilitates discussions on policy impacts, like water rights in the arid west, fostering informed dialogues.
The template's clarity aids retention, as visual aids can increase comprehension by 65%, per educational research from the Journal of Geography. It's a versatile asset that adapts to your narrative, ensuring every presentation lands with authority.
Advantages Over Standard Mapping Software
While tools like Google Maps offer basics, they lack the editable depth for professional slides. This template provides tailored Oklahoma focus, with LSI elements like geographic infographics and scalable vectors, optimizing for both on-screen and print use. It solves common issues like data misalignment, delivering polished results that build trust.
Embrace the template's potential to make your Oklahoma insights shine - download it today and plot your path to persuasive presentations.
Elevate Your Slides - Act Now!
Ready to make Oklahoma's geography work for you? Secure this PowerPoint Map Template and infuse your next session with professional mapping magic. Your audience will thank you.
Frequently Asked Questions
What makes this Oklahoma template unique?
It covers all 77 counties with color-coded, labeled maps, including blank and pre-filled versions for ultimate flexibility.
Can I add my own data to the slides?
Yes, the editable format supports easy integration of custom charts, stats, and images via simple drag-and-drop.
Is it suitable for educational purposes?
Perfectly, with tools to illustrate history, geography, and economics in engaging ways for classrooms.
How many slides does it include?
28 fully editable slides, ranging from full-state overviews to detailed county focuses.
Does it work on Mac?
Yes, fully compatible with PowerPoint on Mac and Windows, plus Google Slides for cross-platform use.
Are there any usage restrictions?
No, once downloaded, use it freely for personal, educational, or commercial projects.