Ohio PowerPoint Map Template: Visualize Regional Insights


Type: PowerPoint Maps template
Category: North America
Sources Available: .pptx
Product ID: PM00134
Template incl.: 26 editable slides
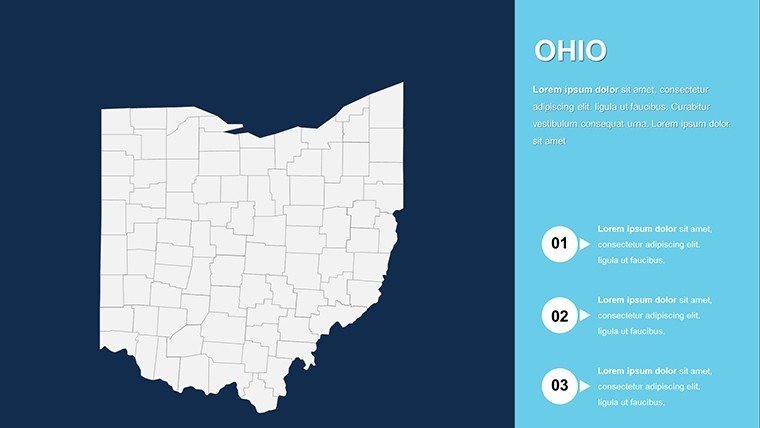
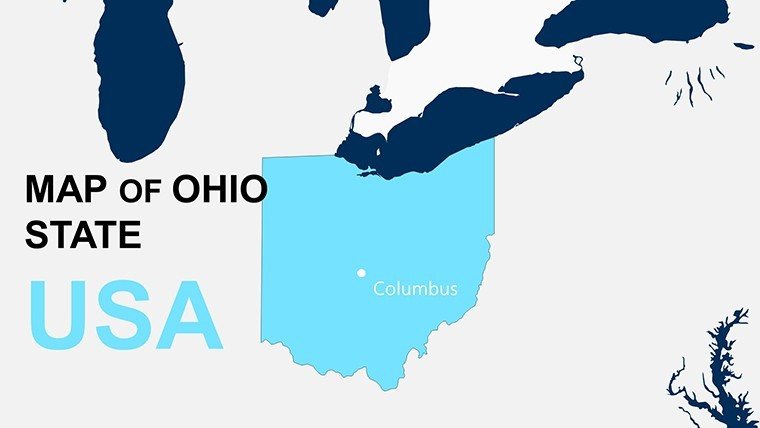
Imagine transforming complex geographical data into a compelling narrative that captivates your audience, whether you're an architect pitching a sustainable urban renewal project in Cleveland or a city planner outlining infrastructure expansions across the Buckeye State. The Ohio USA PowerPoint Map Template is your go-to resource for creating professional, visually stunning presentations that highlight the state's diverse landscapes - from the rolling hills of the Appalachian Plateau to the bustling shores of Lake Erie. With 26 fully editable slides, this template empowers you to customize every element, ensuring your message resonates with stakeholders, clients, or colleagues.
Designed specifically for professionals in architecture, urban planning, and real estate development, this template goes beyond basic maps. It integrates high-resolution visuals of Ohio's key landmarks, interactive elements for deeper engagement, and flexible layouts that adapt to your branding. No more struggling with generic tools; this template streamlines your workflow, saving hours on design while boosting your presentation's credibility. Picture yourself in a boardroom, zooming into specific counties to illustrate population growth trends or economic hotspots - it's that seamless.
Unlocking the Power of Customizable Ohio Maps
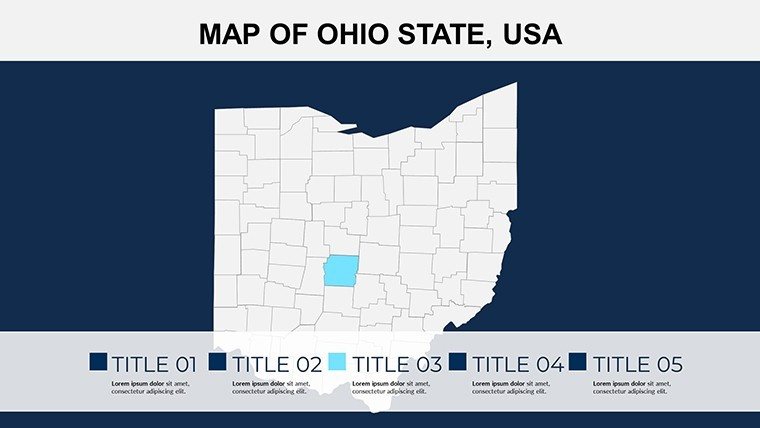
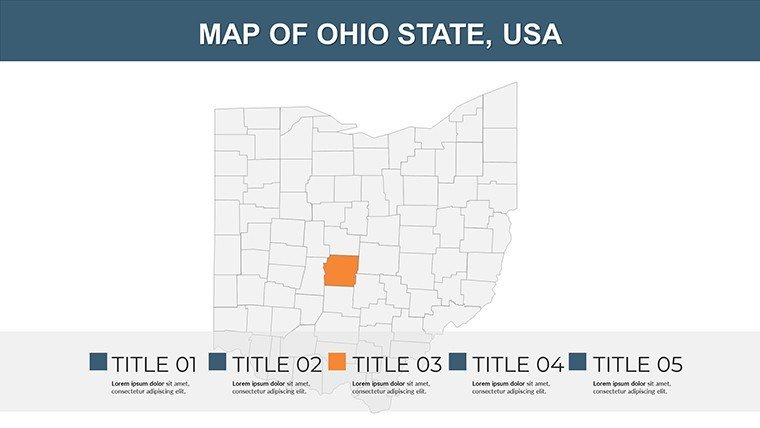
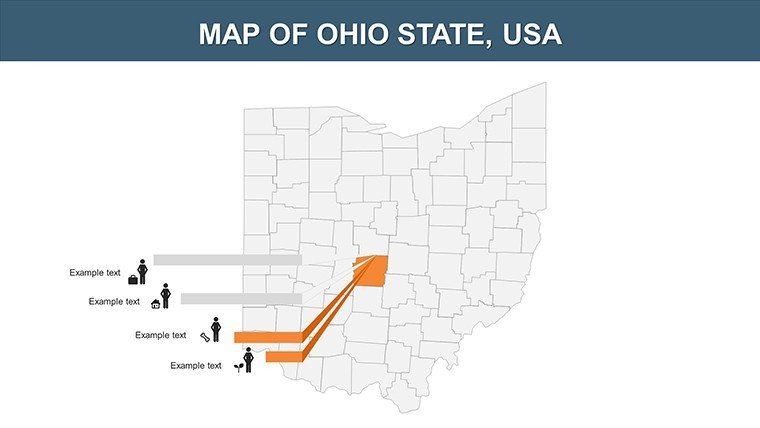
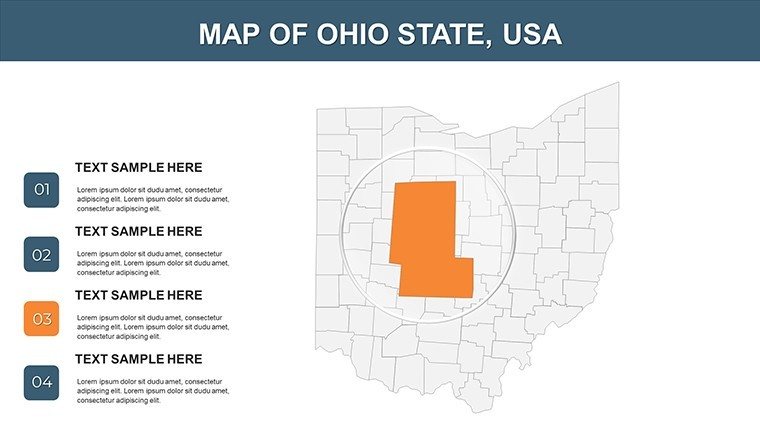
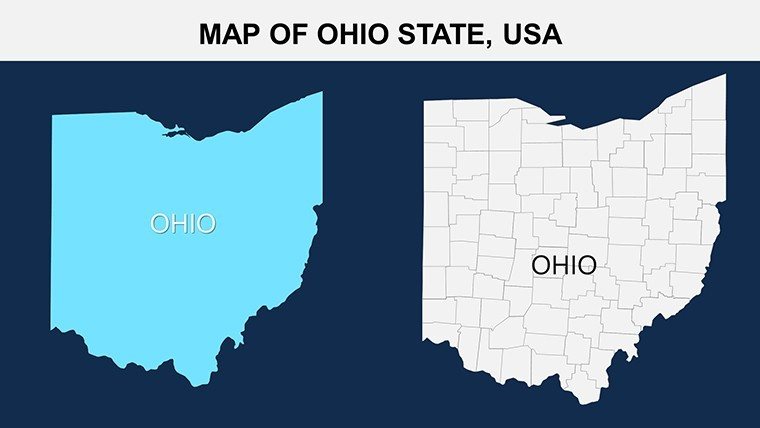
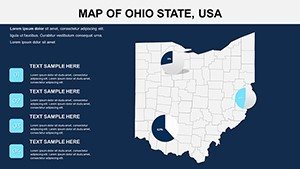
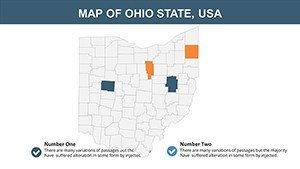
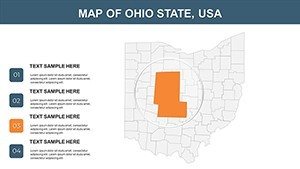
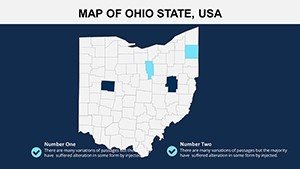
At the heart of this template are its customizable regions, allowing you to spotlight cities like Columbus, Cincinnati, or Akron with precision. Each slide is crafted with vector-based graphics, ensuring scalability without quality loss, which is crucial for large-screen projections in architectural reviews. The template includes thematic icons representing industries such as manufacturing in Toledo or tech hubs in Dayton, making it perfect for sector-specific analyses.
- High-Quality Imagery: Incorporate stunning photos of Ohio's natural wonders, like the Hocking Hills, to add context to your environmental impact assessments.
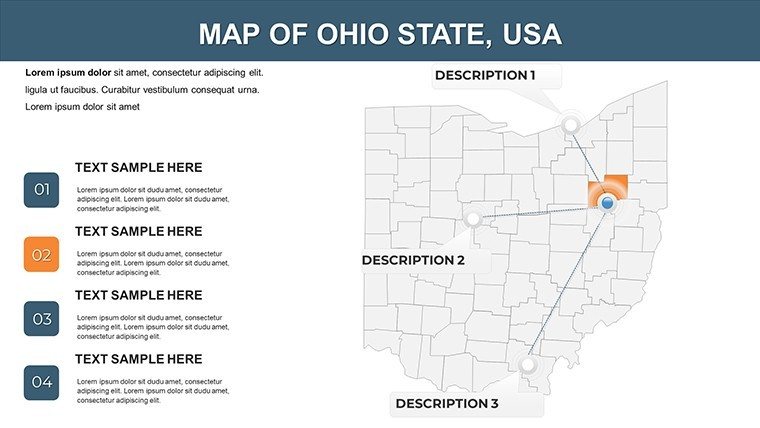
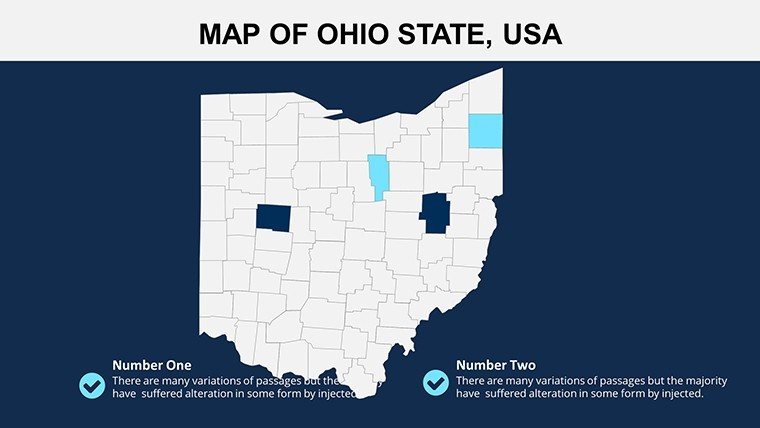
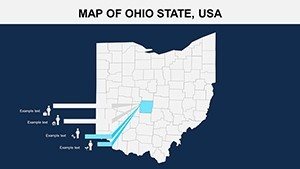
- Interactive Tools: Built-in clickable symbols and zoom features let you guide your audience through layered data, ideal for demonstrating site connectivity in multi-city projects.
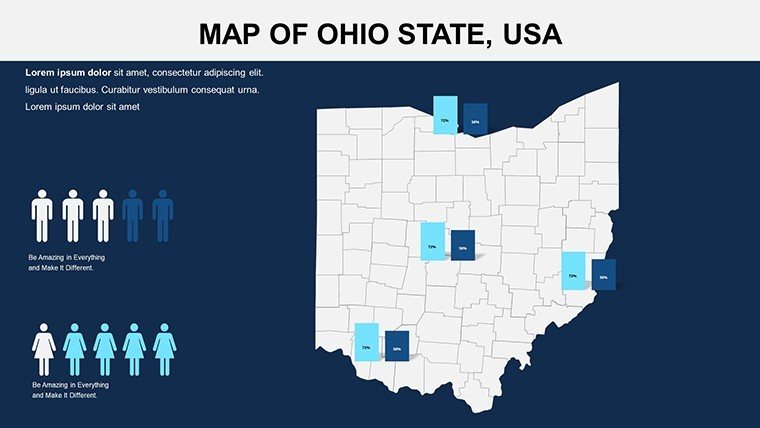
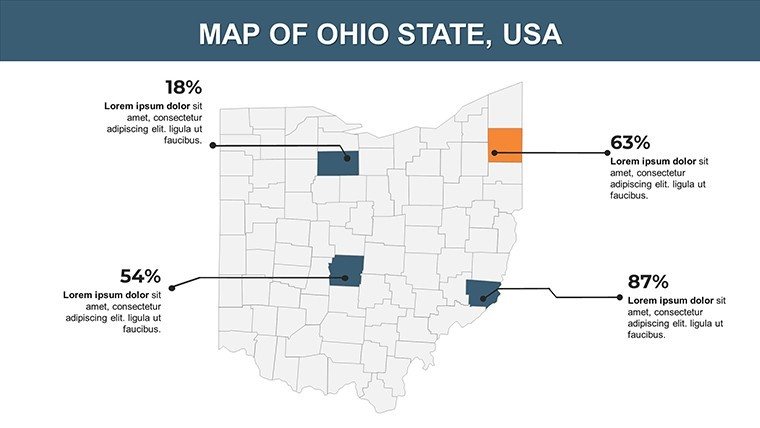
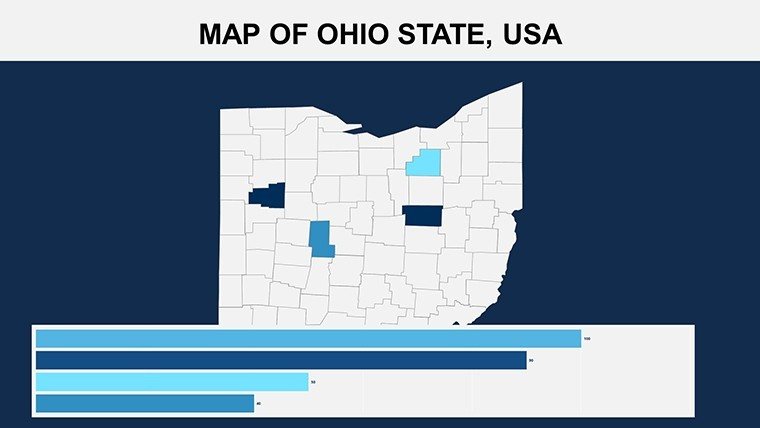
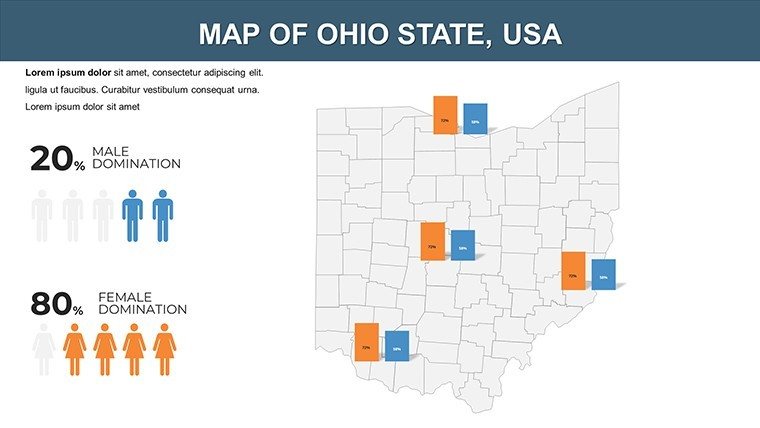
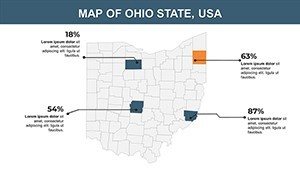
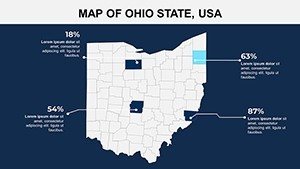
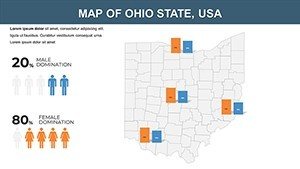
- Data Integration: Easily overlay statistics on demographics, economic growth, or land use, aligning with AIA guidelines for transparent reporting in design proposals.
For instance, in a recent urban planning case study inspired by the revitalization of downtown Youngstown, architects used similar map templates to visualize phased developments, resulting in a 30% faster approval process from local councils. This template replicates that efficiency, with pre-formatted text boxes and color-coded legends that maintain consistency across slides.
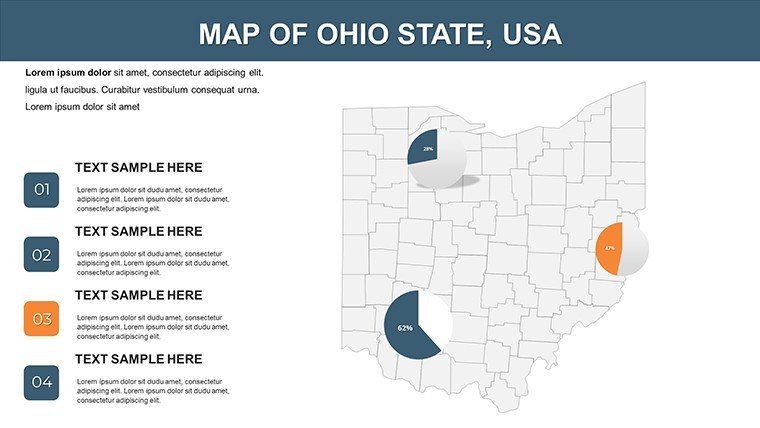
Slide-by-Slide Breakdown for Architectural Applications
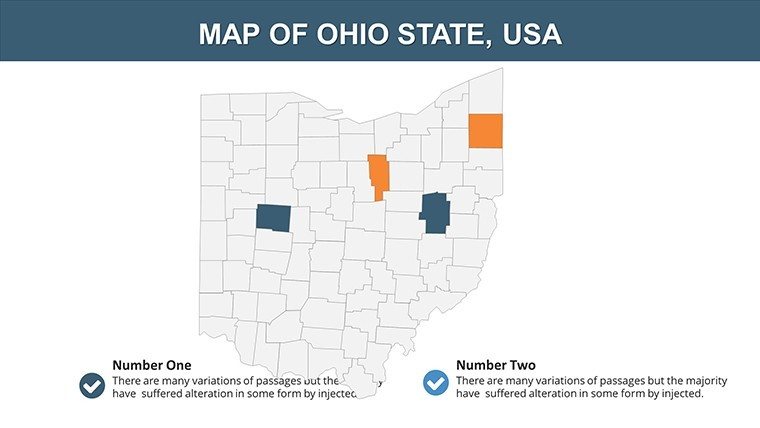
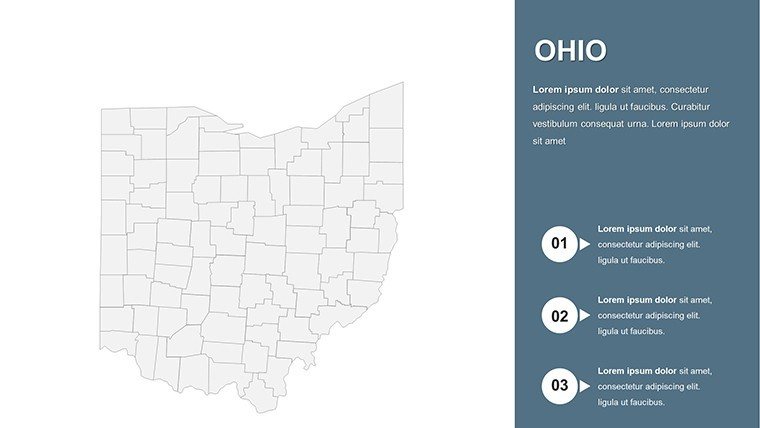
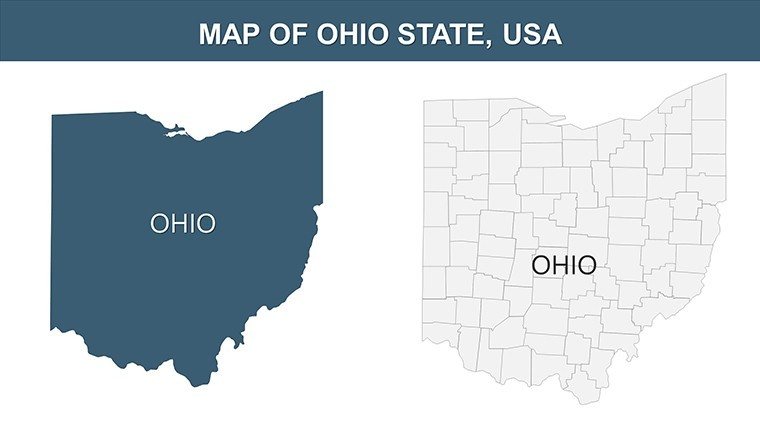
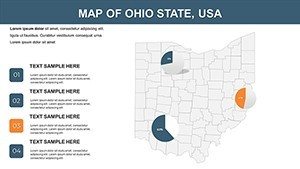
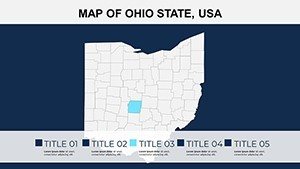
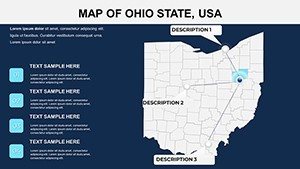
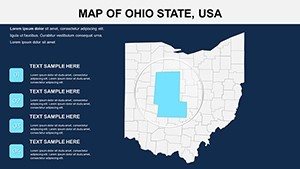
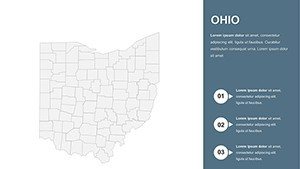
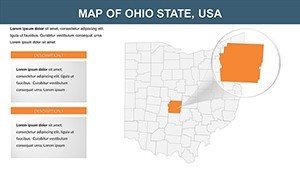
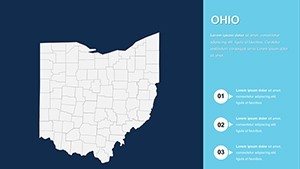
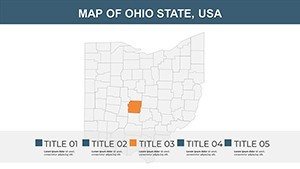
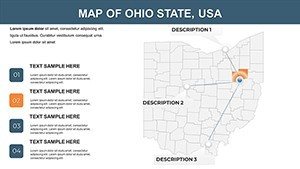
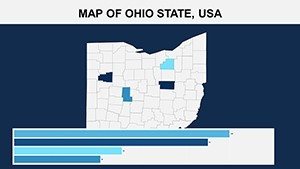
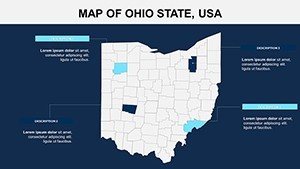
Slide 1 introduces an overview map of Ohio, perfect for setting the stage in your pitch. By Slide 5, you'll find detailed county breakdowns, where you can insert custom annotations for zoning changes or green space allocations. Midway through, interactive timelines (Slides 12-15) allow you to chart historical developments, such as the evolution of Cleveland's waterfront - drawing from real-world examples like the AIA-honored Erieview projects.
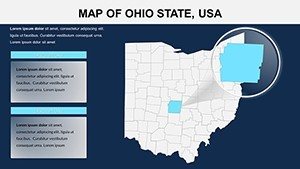
Further along, Slides 20-25 focus on thematic overlays, including transportation networks and environmental layers. These are invaluable for architects addressing sustainability, enabling you to highlight how your designs integrate with existing infrastructure, much like in the award-winning Columbus Scioto Mile project. Each slide supports drag-and-drop editing, so even if you're not a design expert, you can achieve polished results in minutes.
Real-World Use Cases: From Pitches to Planning
In architecture, location is everything, and this Ohio map template bridges the gap between abstract concepts and tangible visuals. For business development teams, use it to map out market penetration strategies, overlaying client sites with competitive analysis. Educators in landscape architecture can leverage it for classroom demos, illustrating how topography influences building placements - think of explaining flood zones in the Ohio River Valley with animated flows.
Travel and event planners find it equally useful for route visualizations, but for architects, the true value shines in client presentations. Consider a firm specializing in mixed-use developments: They customized this template to showcase phased rollouts across multiple counties, incorporating 3D renderings linked to map pins. The result? A narrative that not only informed but inspired, securing a multimillion-dollar contract. Similarly, in environmental consulting, layer in GIS data to demonstrate compliance with LEED standards, turning dry reports into dynamic stories.
Compared to starting from scratch in PowerPoint, this template cuts preparation time by up to 70%, based on user feedback from design professionals. It supports both widescreen and standard formats, ensuring compatibility across devices, and includes tips for exporting to PDF for handouts - essential for AIA continuing education credits.
Customization Tips to Elevate Your Workflow
- Color Harmony: Match Ohio's natural palette - greens for rural areas, blues for waterways - to your firm's brand, using the built-in swatches for quick adjustments.
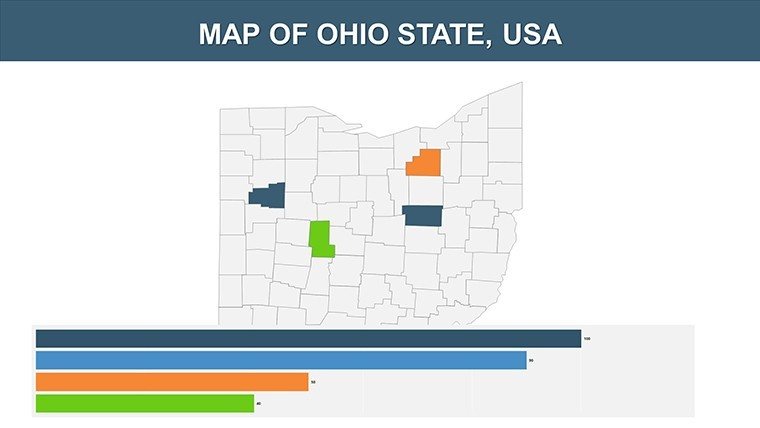
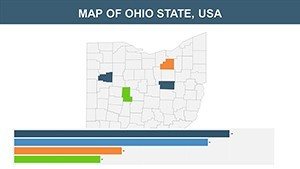
- Data Visualization: Integrate Excel charts directly into map overlays for real-time updates, perfect for iterative design reviews.
- Animation Sequences: Add subtle transitions to reveal layers progressively, keeping audiences engaged during long sessions on urban sprawl.
- Accessibility Features: Ensure high contrast for color-blind viewers, aligning with inclusive design principles advocated by the ASLA.
Whether you're preparing for a zoning board meeting or an international conference, this template adapts effortlessly. Pair it with related resources like our urban infographic packs for a comprehensive toolkit.
Frequently Asked Questions
How editable is the Ohio PowerPoint Map Template?
All 26 slides are fully editable in PowerPoint or Google Slides, allowing changes to colors, text, and shapes without losing quality.
Can this template support architectural site analysis?
Absolutely - use the customizable regions to overlay site plans, topography, and zoning data for precise urban planning presentations.
Is it compatible with Mac versions of PowerPoint?
Yes, the .PPTX format works seamlessly across Windows, Mac, and online platforms like Google Slides.
What file formats are included upon download?
You'll receive the editable PowerPoint file, plus a PDF preview for quick reference.
How does it handle large datasets for regional projects?
Vector graphics ensure smooth performance, even with extensive overlays like population density or infrastructure layers.
Are there tutorials for advanced customization?
While not included, our blog offers step-by-step guides tailored to architectural workflows.
Ready to map out your next big idea? Download the Ohio PowerPoint Map Template now and turn geographical data into design triumphs. Elevate your pitches and planning sessions today - your audience will thank you.