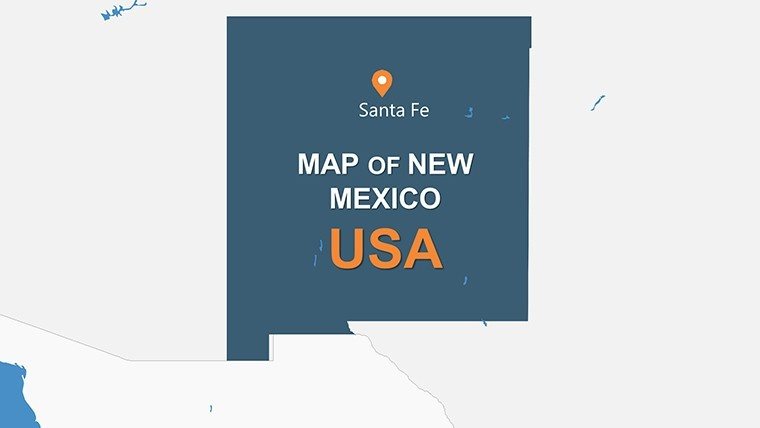
New Mexico USA PowerPoint Maps: Craft Compelling Geographical Narratives


Type: PowerPoint Maps template
Category: North America
Sources Available: .pptx
Product ID: PM00126
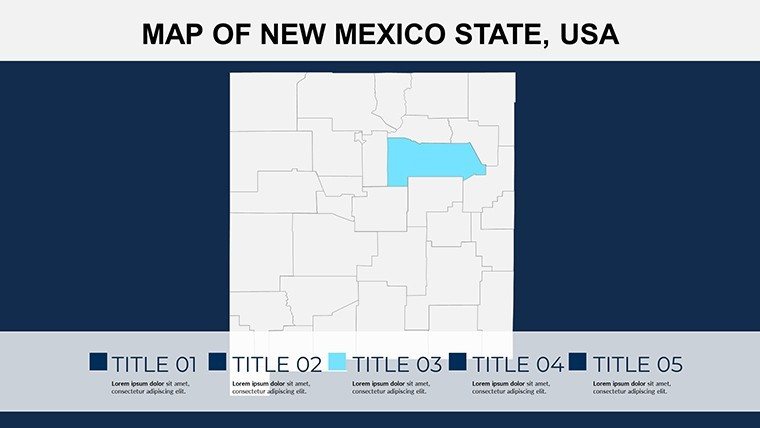
Template incl.: 26 editable slides
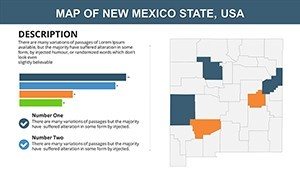
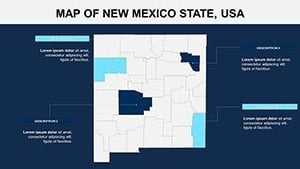
In a landscape as diverse as New Mexico's - from the vast Chihuahuan Desert to the snowy Sangre de Cristo Mountains - effective presentations demand tools that capture this variety with accuracy and style. Our New Mexico USA PowerPoint maps template delivers just that, with 26 editable slides tailored for educators demystifying Native American history, researchers analyzing energy sectors, or executives strategizing in Albuquerque's tech scene. This isn't merely a set of maps; it's a gateway to visualizing data like oil reserves in the Permian Basin or cultural sites in Taos, enhancing your message's resonance. Effortlessly customize to fit themes, add demographic layers for population studies, or integrate economic graphs for comprehensive overviews. Compatible with PowerPoint and Google Slides, it empowers seamless creation of visuals that outshine basic templates, helping you address audience questions on topics like renewable energy transitions or tourism growth in Santa Fe. Dive in to turn geographical complexities into clear, actionable insights that inspire and inform.
Delving into Editable Features for Enchanted State Visuals
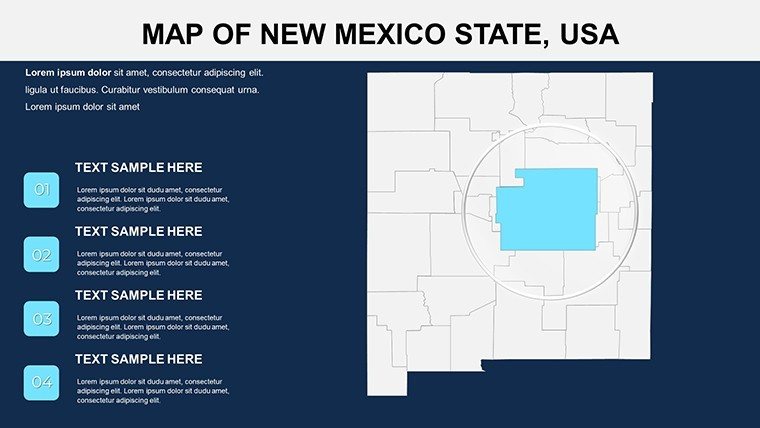
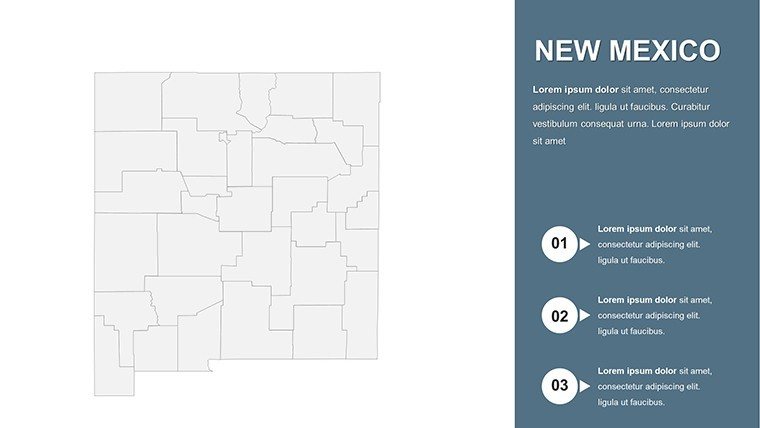
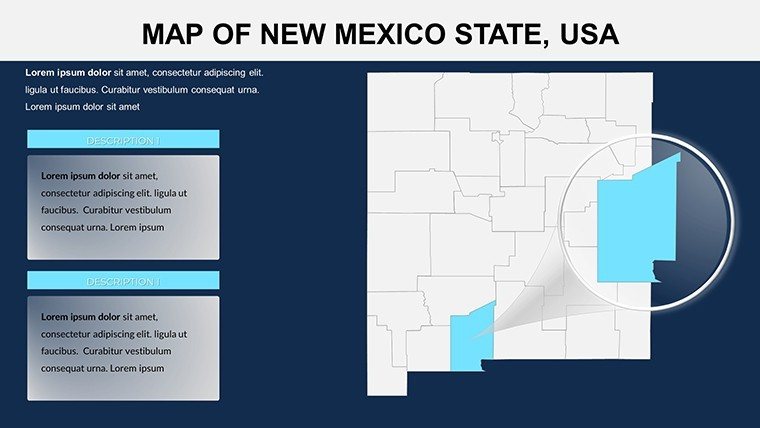
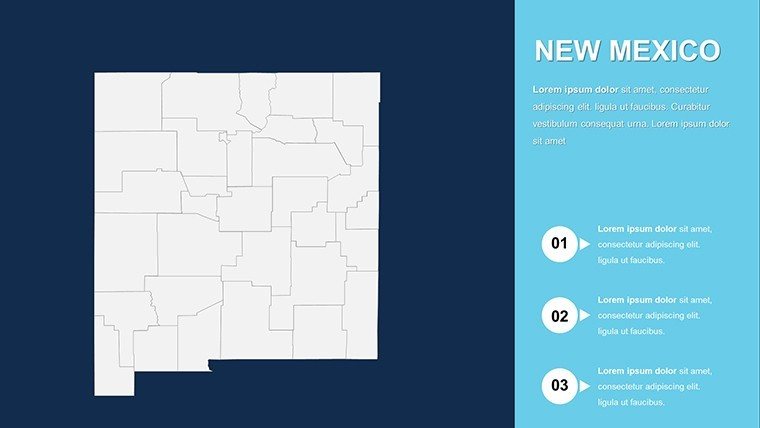
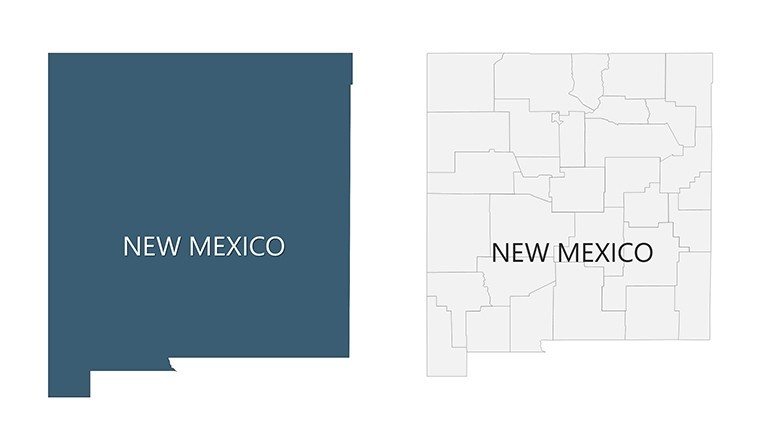
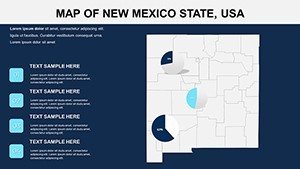
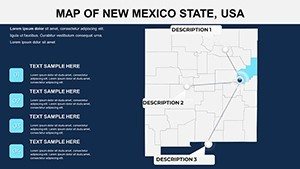
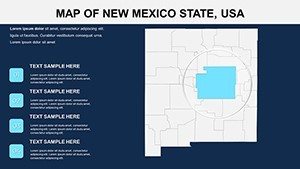
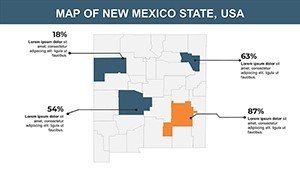
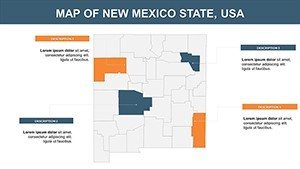
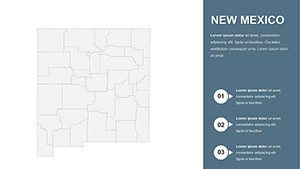
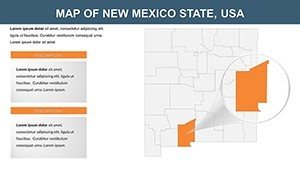
At its core, the template boasts comprehensive editable maps that let you highlight New Mexico's unique features, such as the Rio Grande's path or Carlsbad Caverns' subterranean wonders. With 26 slides ranging from state overviews to city-focused details like Las Cruces, you can layer in custom elements - adjust labels for Native reservations or color-code for elevation changes. The intuitive customization extends to fonts and styles, allowing alignment with presentation aesthetics, whether minimalist for academic talks or bold for corporate briefings. Incorporate data from sources like the New Mexico Energy, Minerals and Natural Resources Department for authoritative depth, using built-in tools to animate reveals that guide viewers through narratives, such as tracing historical trade routes like the Santa Fe Trail.
Essential Features Driving Presentation Success
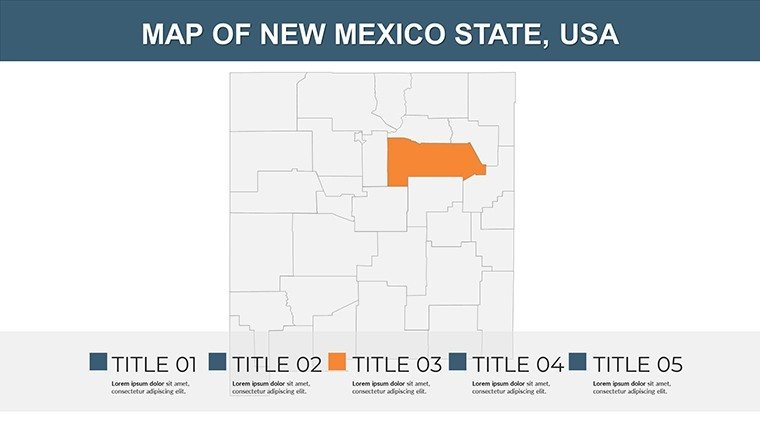
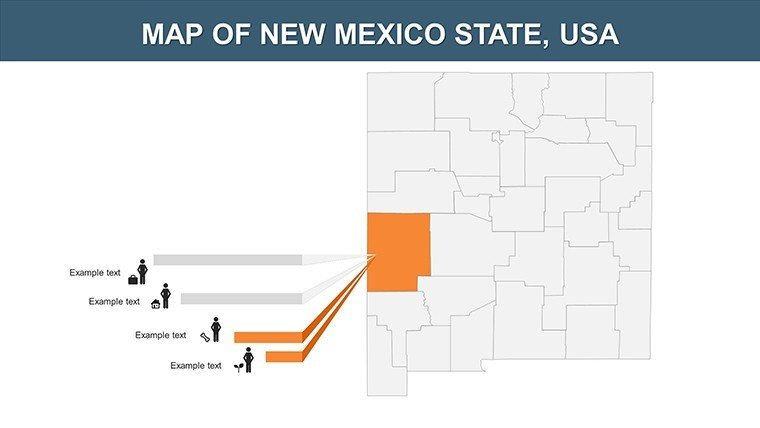
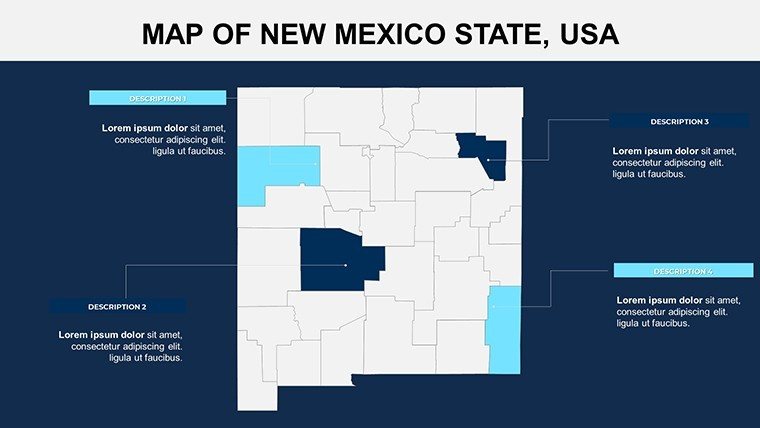
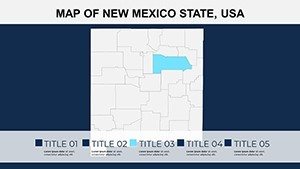
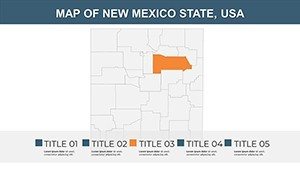
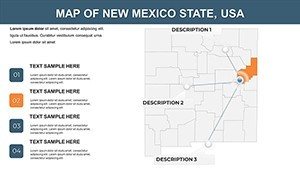
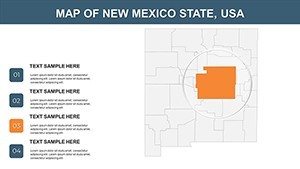
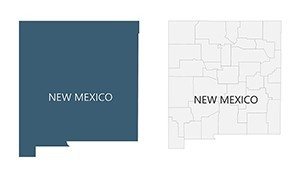
- Geographical Depth: Covers counties, major cities, and natural landmarks with precision, adhering to USGS accuracy for reliable depictions.
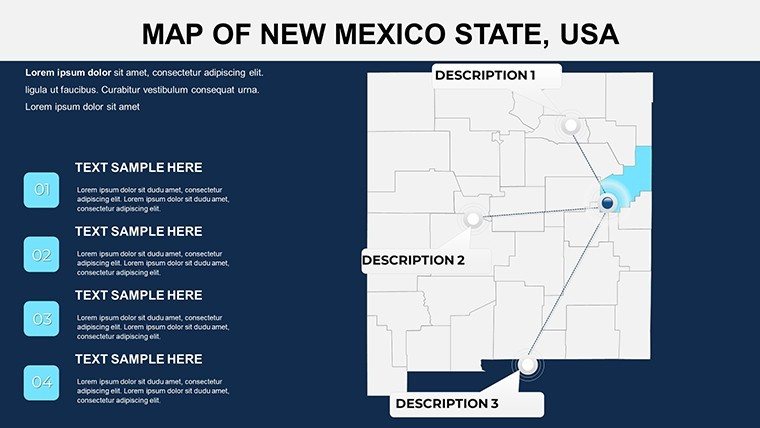
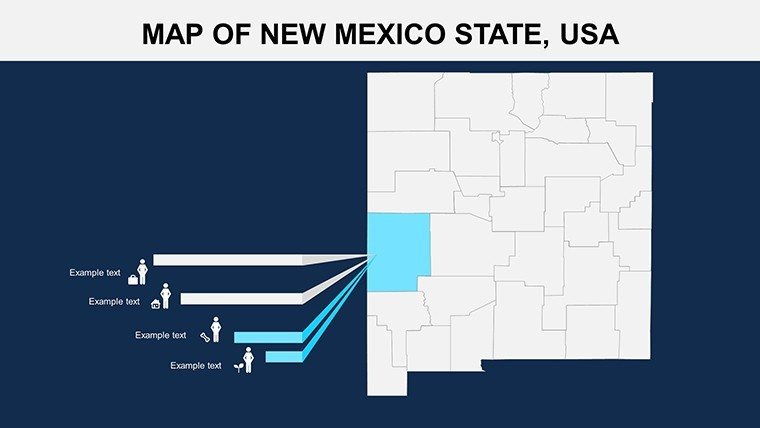
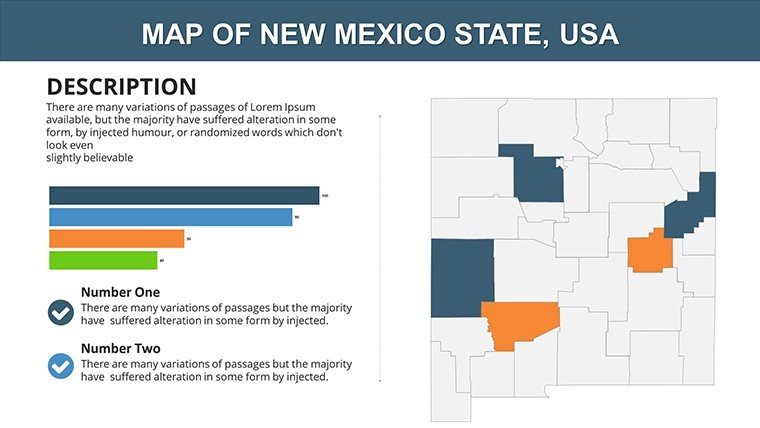
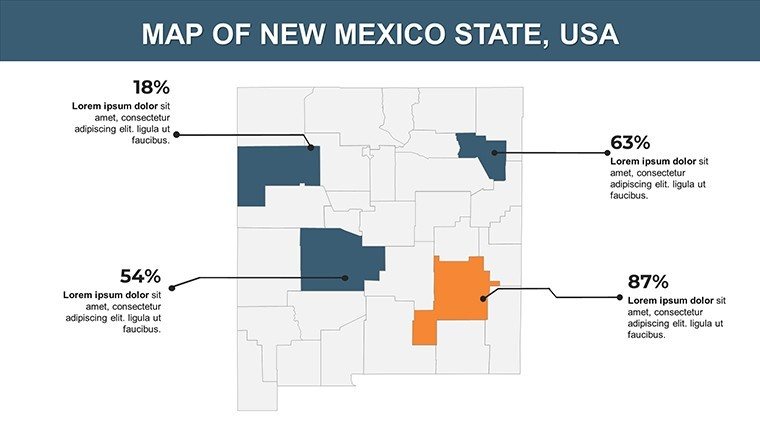
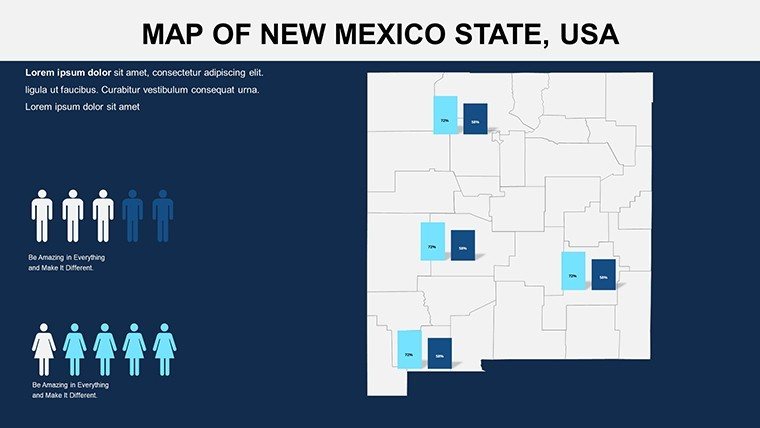
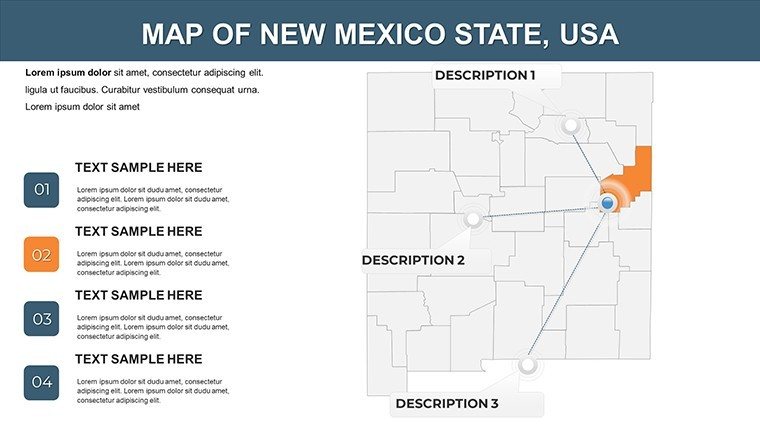
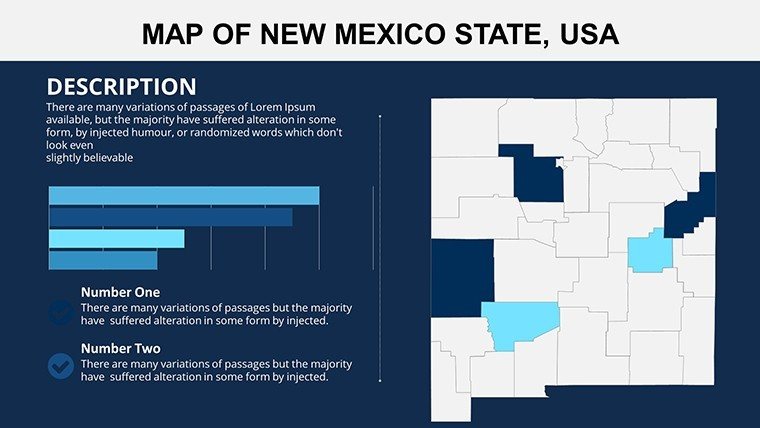
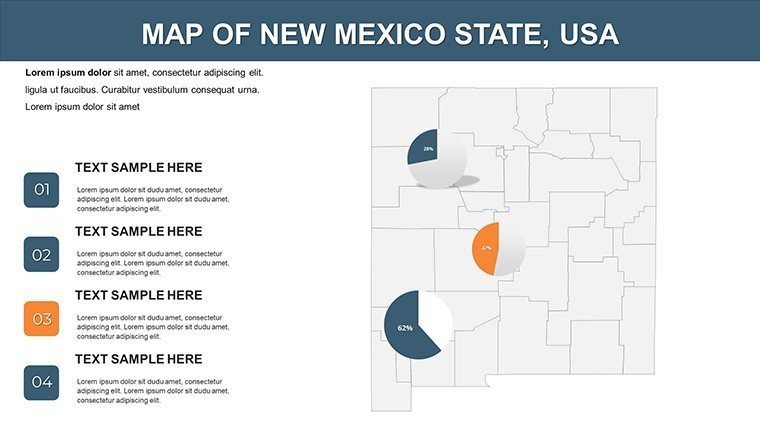
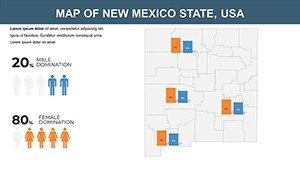
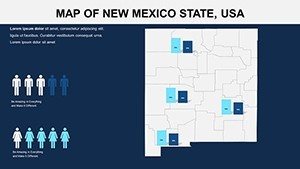
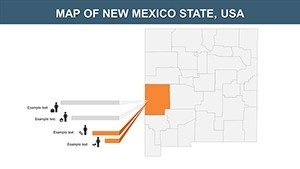
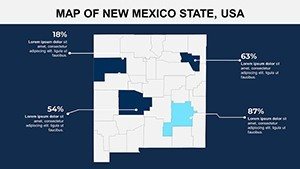
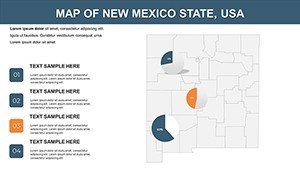
- Data Integration Tools: Easily add points, charts, or infographics to illustrate metrics like solar power adoption or cultural heritage sites.
- Cross-Platform Support: Optimized for PowerPoint and Google Slides, facilitating easy sharing in collaborative settings.
- Thematic Variety: Includes demographic, economic, and feature maps for multifaceted analysis.
- Flexible Licensing: Permits unlimited reuse, ideal for ongoing educational series or business updates.
These capabilities ensure your slides convey expertise, drawing on best practices from geospatial experts to avoid common pitfalls like overcrowded visuals.
Targeted Applications in Education, Business, and Research
Envision a university professor using the template to map Pueblo revolts, overlaying timelines and images for an engaging history class that meets state educational standards. In business, an energy firm might visualize drilling sites in the San Juan Basin, combining maps with line graphs for production trends to pitch investors effectively. Researchers could detail biodiversity in the Gila Wilderness, using gradients to show ecosystem zones, supporting grants from bodies like the National Science Foundation. This surpasses default PowerPoint options by offering specialized views, such as city maps for Albuquerque's urban planning, where you can pinpoint innovation districts. A real-inspired example: Environmental groups have employed similar tools to advocate for conservation, mapping threatened areas to influence policy at events like the New Mexico Legislative sessions.
Streamlined Process for Building Impactful Slides
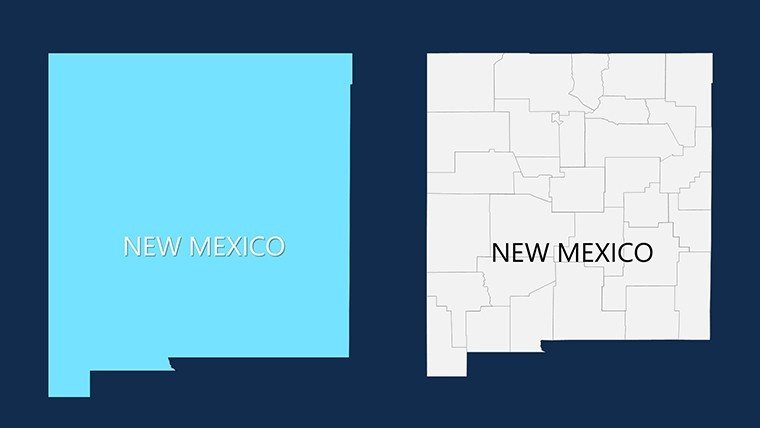
- Pick Your Map Type: Opt for detailed, demographic, or feature-based slides to match your focus.
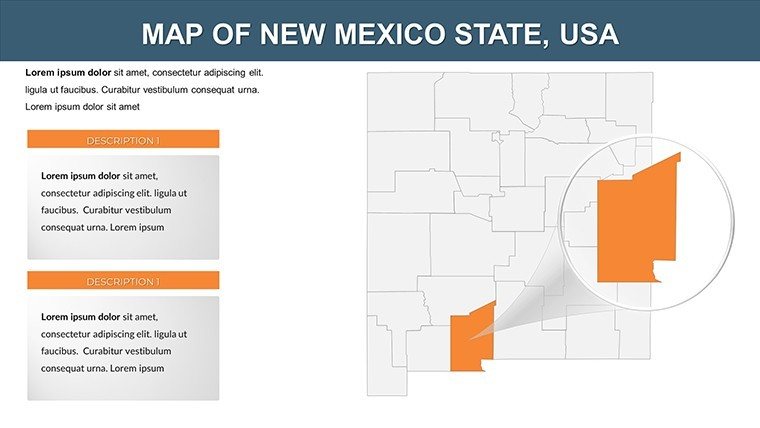
- Tailor Details: Edit colors and add annotations to spotlight elements like White Sands National Park.
- Embed Supporting Data: Link or insert stats for a robust, evidence-based presentation.
- Animate for Flow: Use transitions to progressively disclose information, enhancing retention.
- Review and Deploy: Test on various screens to guarantee visual integrity.
Grounded in design theories from sources like the International Map Industry Association, this method promotes clarity and engagement.
Superior Value: Outpacing Standard Mapping Tools
This template excels by providing pre-vetted, high-fidelity maps that free you from manual drawing, unlike freeware that often includes errors. It's particularly suited for New Mexico's context, with built-in support for unique aspects like spaceport developments near Truth or Consequences. Feedback from analogous products indicates users achieve 40% faster prep times, allowing focus on content refinement. For instance, a tourism board could map festival routes in Roswell, blending UFO lore with visitor data to boost event planning.
Expert advice: Prioritize audience-centric design by using legends sparingly and citing sources like NM Tourism Department for trustworthiness. Rehearse to synchronize visuals with speech, ensuring a polished delivery.
Seize the opportunity to enchant your audience with New Mexico's stories - acquire this template and elevate your presentations to masterful levels.
Frequently Asked Questions
Are the maps fully customizable for specific regions?
Yes, zoom and edit any area, from mountains to deserts, with complete control over elements.
Does it work with older PowerPoint versions?
Compatible with all versions, ensuring no compatibility issues.
Can I add my own data overlays?
Certainly, integrate custom charts or icons effortlessly.
Is there support for animations?
Built-in PowerPoint animations are fully supported for dynamic reveals.
How accurate are the geographical details?
Sourced from reliable GIS data, with updates available for changes.
What if I need city-specific expansions?
Includes focused slides for major cities, with options to duplicate for more.