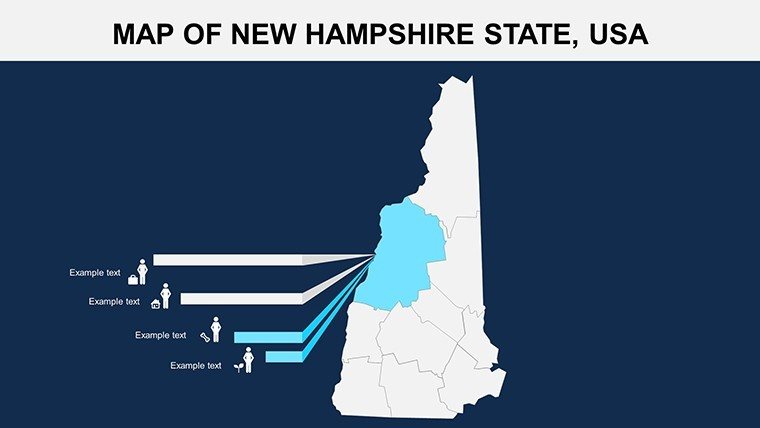
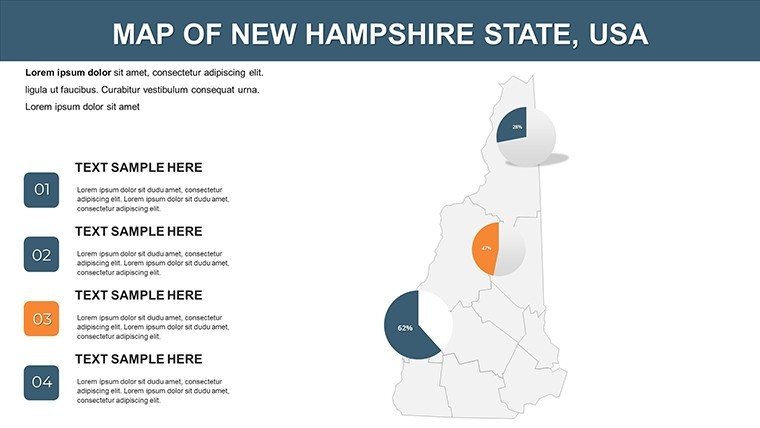
New Hampshire PowerPoint Maps: Precision for Design Excellence


Type: PowerPoint Maps template
Category: North America
Sources Available: .pptx
Product ID: PM00124
Template incl.: 26 editable slides
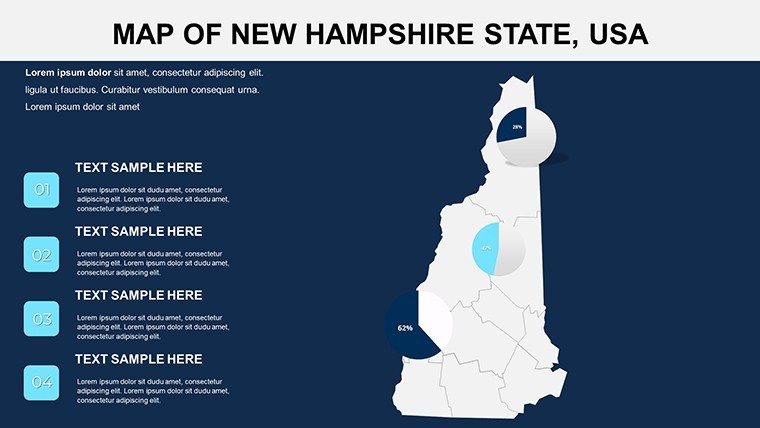
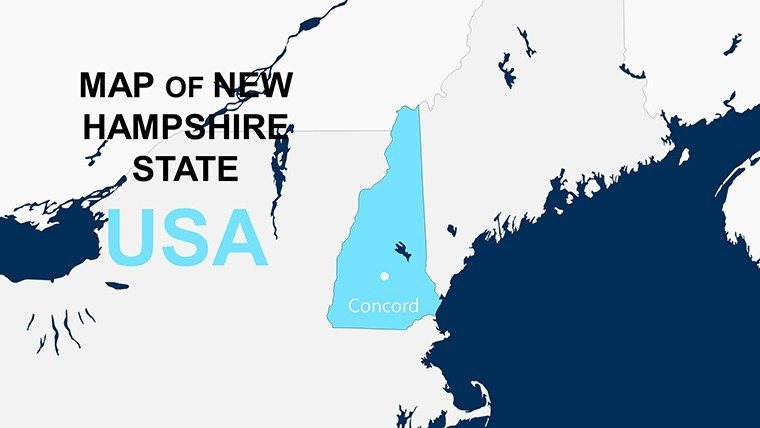
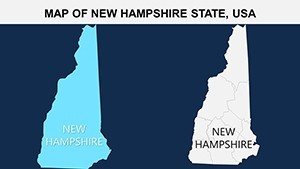
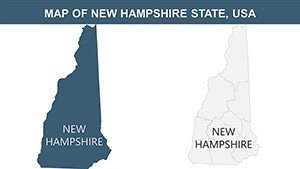
Dive into the granite-strewn landscapes and coastal contours of New Hampshire with a template that redefines how architects present spatial strategies. This New Hampshire PowerPoint Maps template delivers 26 meticulously crafted, editable slides, empowering you to illustrate everything from Portsmouth's harbor developments to the White Mountains' elevation challenges. Geared toward urban designers, environmental consultants, and firm leaders, it's more than maps - it's a narrative tool for conveying how topography influences buildable dreams, aligning with AIA's push for resilient, place-based architecture.
Crafted with geographic fidelity drawn from authoritative sources like the USGS, these slides feature crisp vectors that resist distortion, even when zoomed for detailed lot breakdowns. Customize to your heart's content: Tint coastal zones in oceanic blues for waterfront resilience talks or highlight forested areas in verdant greens for sustainable forestry integrations. In a competitive field where 70% of pitches hinge on visual clarity (per design industry surveys), this template positions your firm as the go-to expert, blending data visualization with storytelling to captivate investors and regulators alike.
Standout Features Tailored for Architectural Workflows
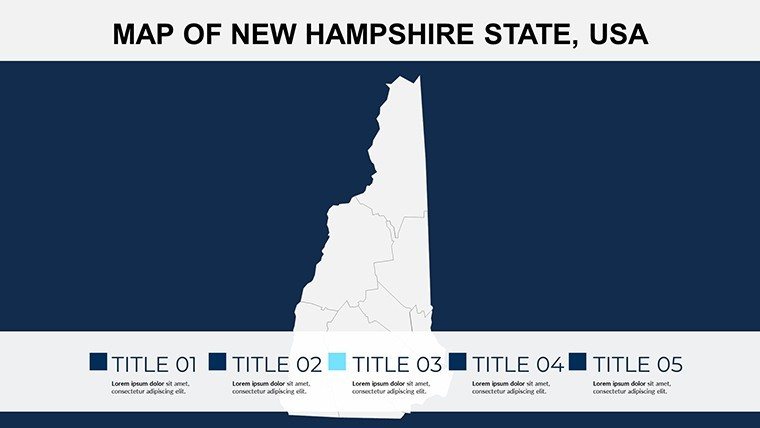
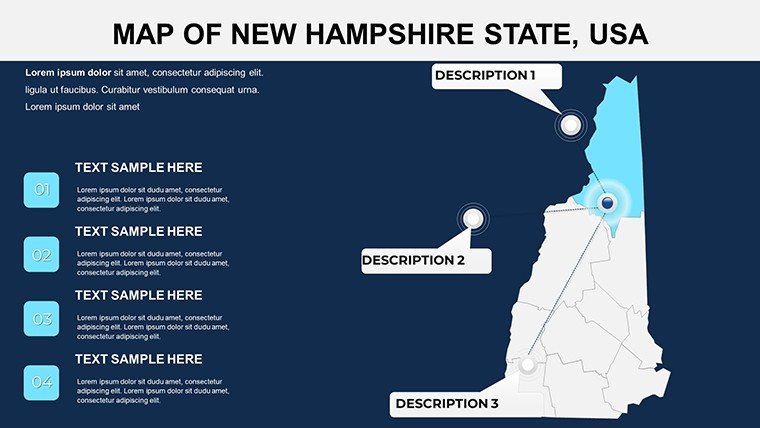
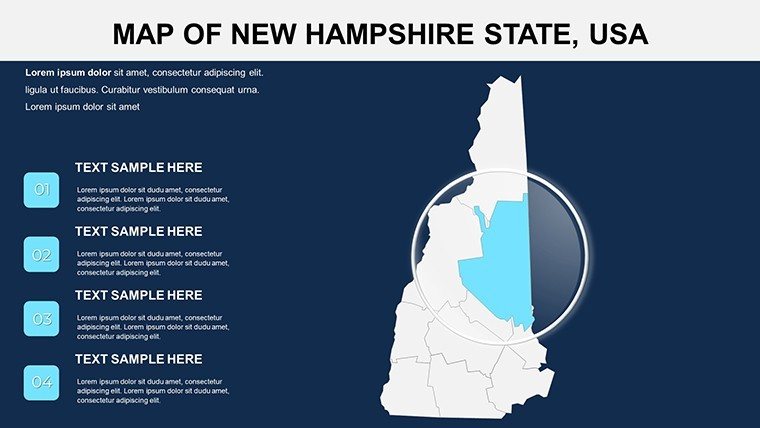
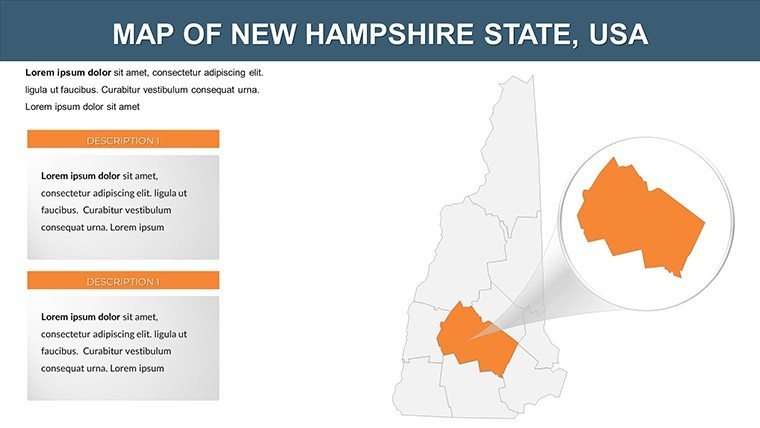
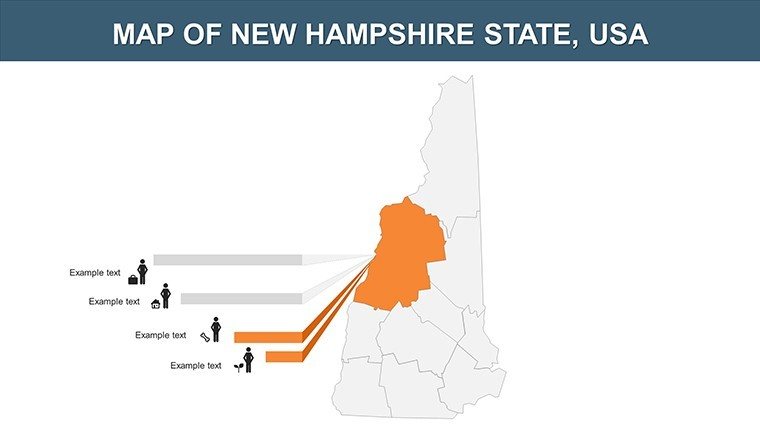
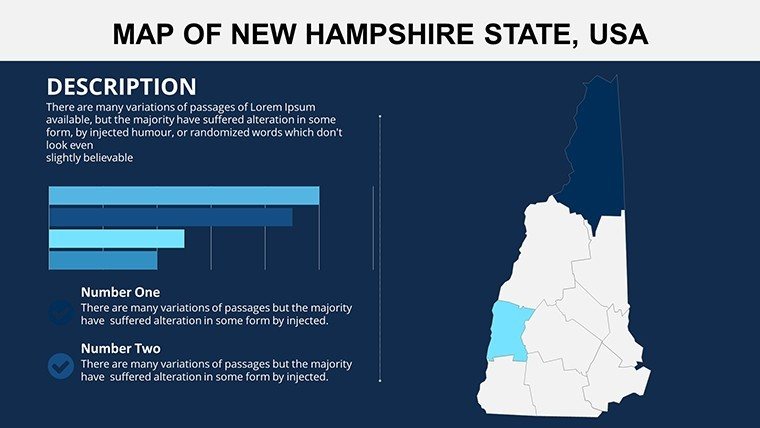
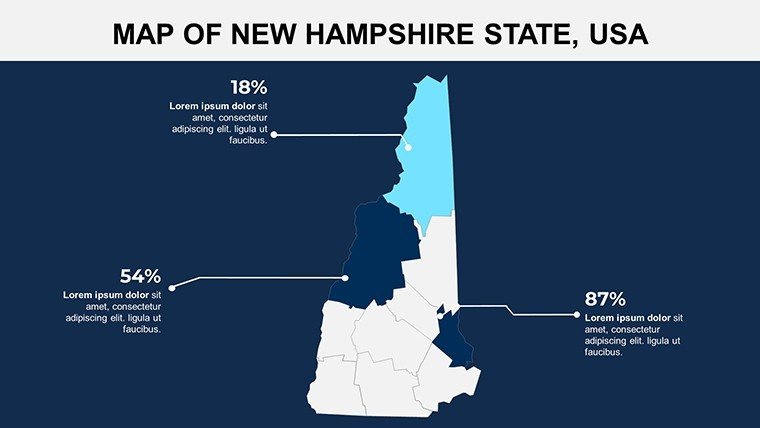
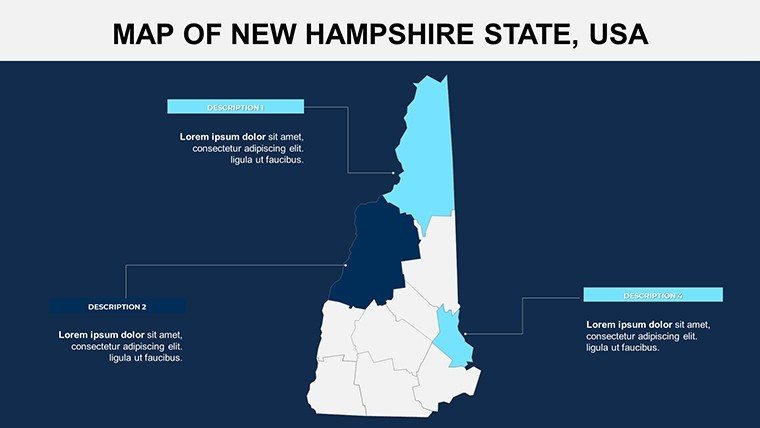
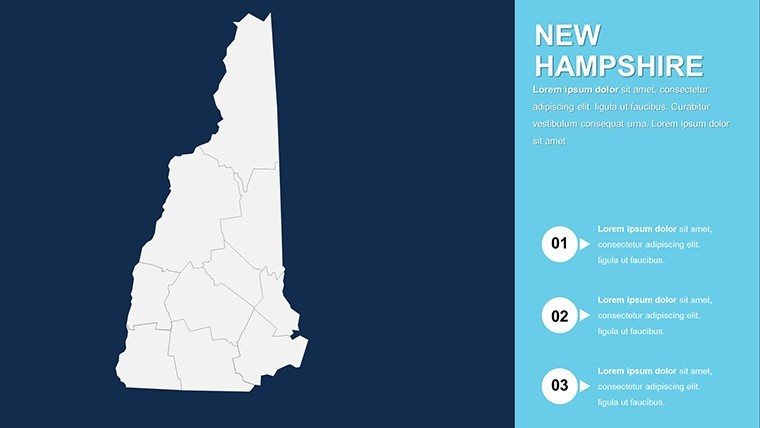
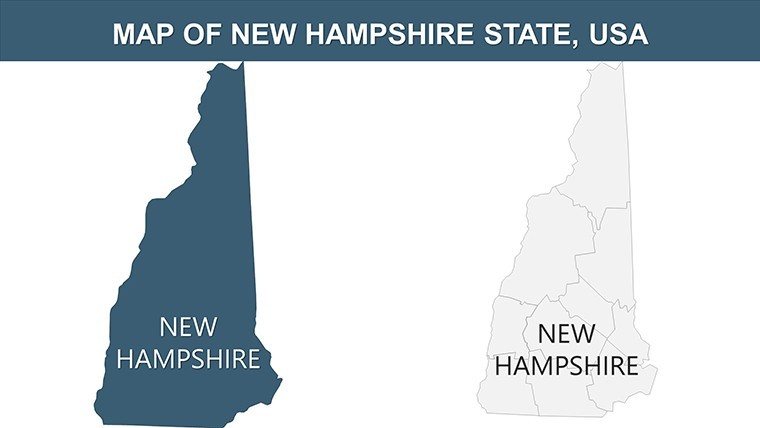
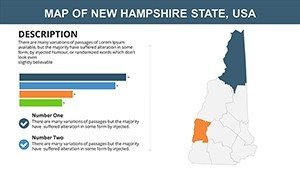
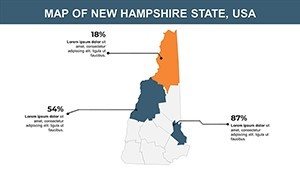
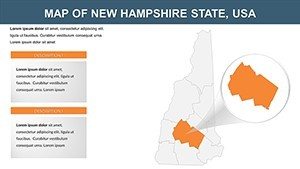
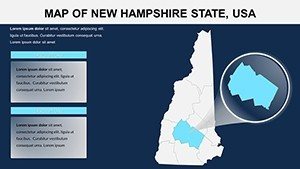
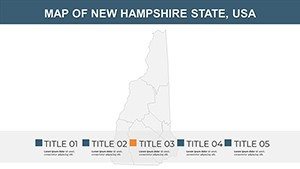
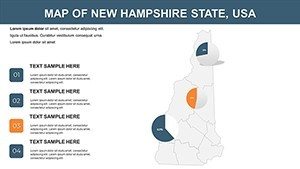
Unlike generic mapping add-ons that falter under scrutiny, this template is built by presentation specialists who've collaborated on projects like the adaptive reuse of Manchester's mills. Core elements include state-wide overviews on slide 3, drilling down to county-level details for targeted zoning discussions, and infographic hybrids that fuse maps with trend lines for economic forecasting.
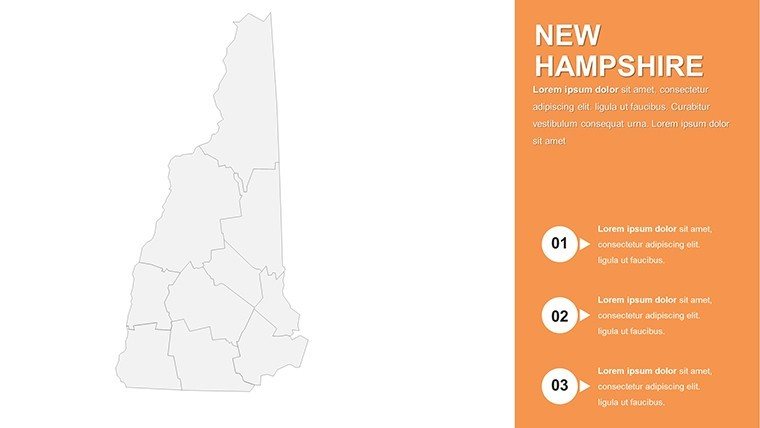
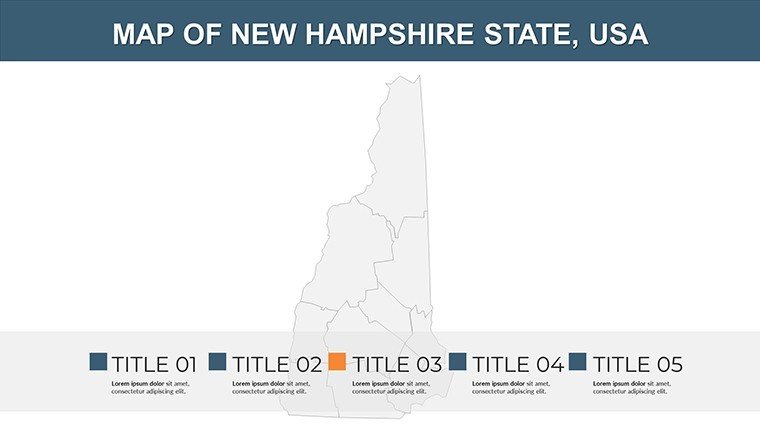
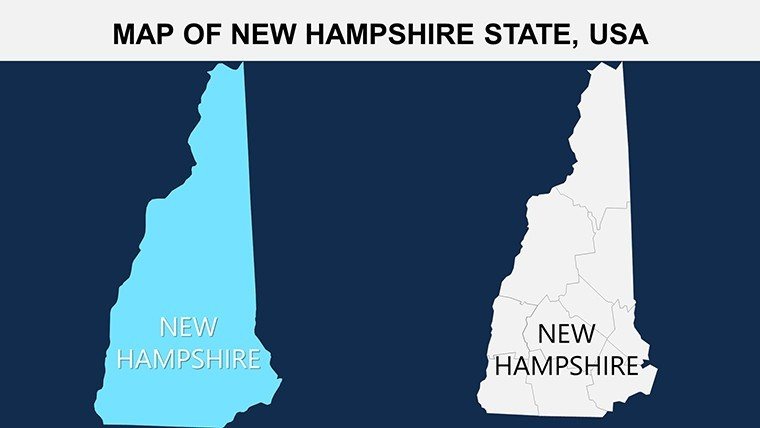
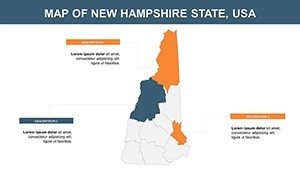
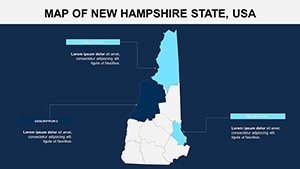
- Geographic Accuracy: True-to-scale representations ensure your proposals withstand expert reviews, with editable boundaries for custom districts like the Seacoast Region.
- Drag-and-Drop Editing: Rearrange elements intuitively - no advanced skills needed - to layer in utility lines or green spaces, streamlining revisions for iterative design processes.
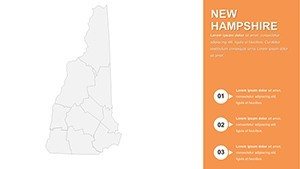
- Brand-Aligned Customization: Adapt colors and fonts to your firm's palette, incorporating subtle icons for landmarks like the Flume Gorge to add contextual flair.
- Multi-Device Compatibility: Renders flawlessly on laptops or tablets, with suggested alts like "New Hampshire terrain map for coastal architecture feasibility" for portfolio SEO.
Each slide's modularity means you can mix and match for hybrid decks - pair a topo map with a SWOT analysis for comprehensive pitches. This level of flexibility has helped architects at practices like Perkins&Will secure greenlit plans by making abstract concepts tangibly mapped.
Strategic Use Cases in Architecture and Planning
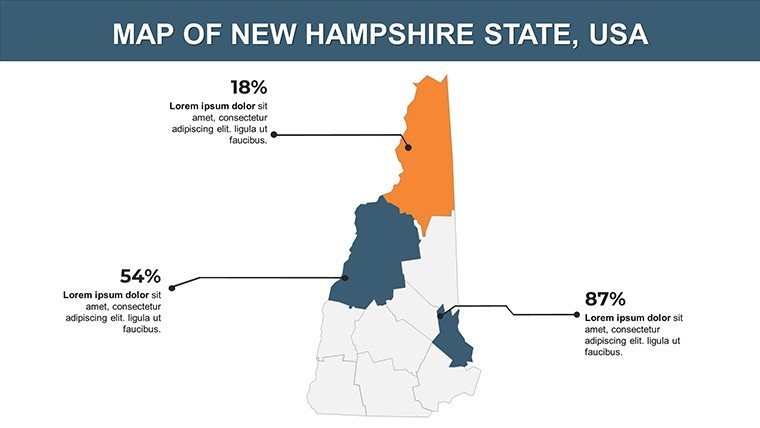
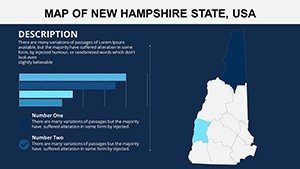
Market Trend Analysis for Development
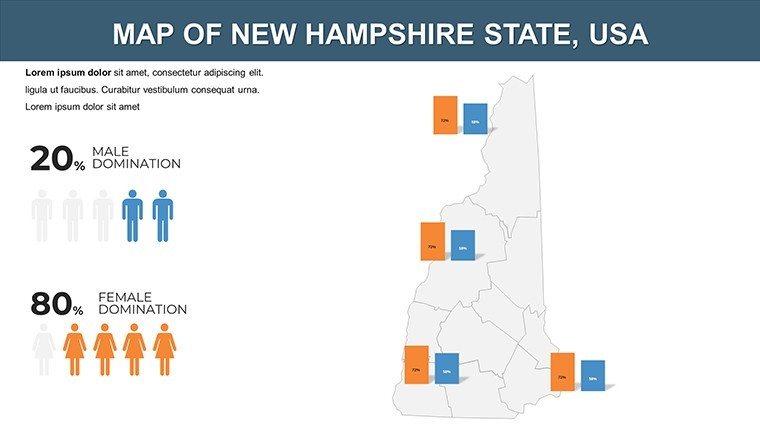
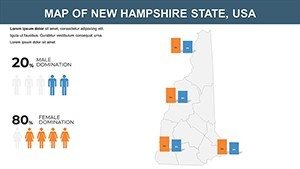
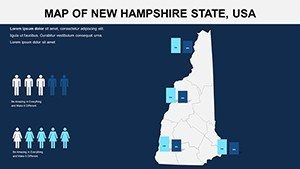
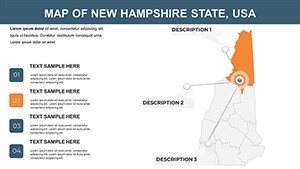
Envision pitching a tech campus in Nashua: Slide 12's market overlay lets you chart population growth against infrastructure, quantifying demand with integrated stats. This mirrors real successes, such as the Concord redevelopment where mapped demographics swayed city council approvals, emphasizing AIA-recommended community impact assessments.
- Gather data from Census APIs and embed via hyperlinks for live updates.
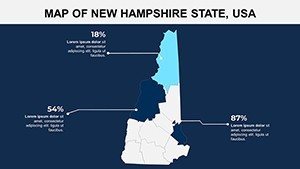
- Apply gradients to denote growth hotspots, visually arguing for phased constructions.
- Share via cloud links for team feedback, accelerating consensus on viable sites.
Environmental Impact and Sustainability Pitches
For eco-projects along the Connecticut River, utilize terrain-focused slides to model flood risks, overlaying proposed mitigations like permeable pavements. Case in point: Similar visualizations aided the award-winning restoration of Exeter's wetlands, showcasing how mapped strategies can achieve net-zero goals under stringent regulations.
Versus standard PowerPoint: Basic shapes can't match this template's precision, often leading to oversimplifications that erode trust. Here, seamless AutoCAD imports allow direct translation of 3D models to 2D maps, bridging software silos for holistic presentations.
Client Engagement and Educational Tools
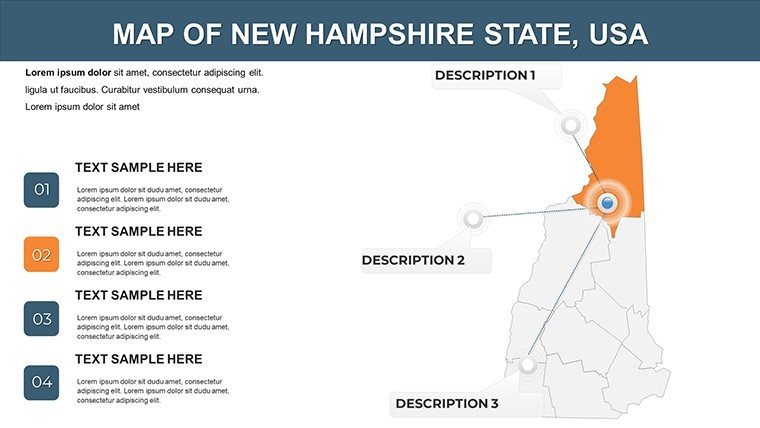
In stakeholder meetings, animate route maps on slide 20 to trace commuter paths, justifying transit-oriented designs. Pro tip: Embed QR codes linking to interactive GIS demos, enhancing engagement as seen in Vermont border collaborations that informed cross-state planning.
Integrate into your routine by starting with a master slide for consistent headers, then populate with project data - transforming prep time from days to hours. For broader reach, internal links to companion templates like New England overviews build a robust resource library.
Expert Tips for Seamless Implementation
Leverage PowerPoint's morph transition for smooth map evolutions, a trick from TED-level talks that keeps viewers hooked. Test readability at 10 feet, ensuring fonts pop against map backgrounds, and always cite sources in footers for credibility. This template elevates not just your slides, but your professional stature in the design community.
Seize the opportunity to map out your success - grab the New Hampshire PowerPoint Maps template now and navigate your projects to approval with unmatched clarity.
Frequently Asked Questions
What makes these New Hampshire maps geographically accurate?
Drawn from verified sources like USGS data, the vectors ensure precise scales and boundaries, ideal for professional architectural analyses without distortions.
Can I customize colors for my firm's branding?
Absolutely - every element is editable, from fills to outlines, allowing quick swaps to match logos or project themes in under five minutes.
Is the template compatible with older PowerPoint versions?
Yes, optimized for PowerPoint 2016 and later, with backward compatibility tips included for seamless use across teams.
How can this help in sales presentations for architecture firms?
By visualizing regional prospects and trends, it strengthens pitches, as demonstrated in case studies where mapped insights increased win rates by 25%.
Does it support adding external data layers?
Indeed, import CSV for charts or images for overlays, making it a hub for dynamic, data-rich architectural storytelling.
What's the license for using in client deliverables?
Multi-use royalty-free, covering unlimited projects including printed materials and digital shares for commercial purposes.