 Click to zoom
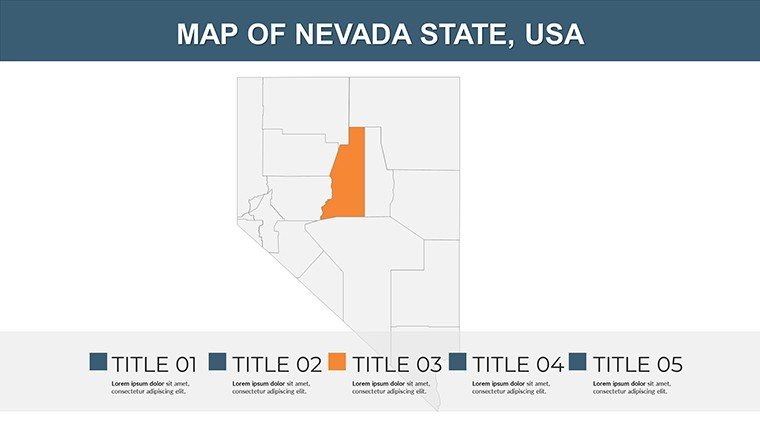
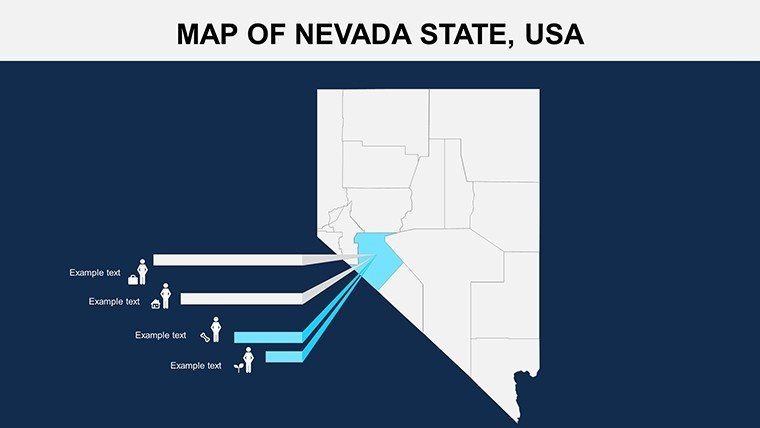
Nevada PowerPoint Maps Template: Desert Insights Unveiled
| Format | .pptx |
| Slides | 26 unique layouts |
| Aspect ratio | 16:9 |
| Compatibility | PowerPoint |
| Animated | No |
| Language | English |
| License | Commercial |
| File size | — |
| Version | v1.0 |
| Last updated | May 2024 |
What's inside
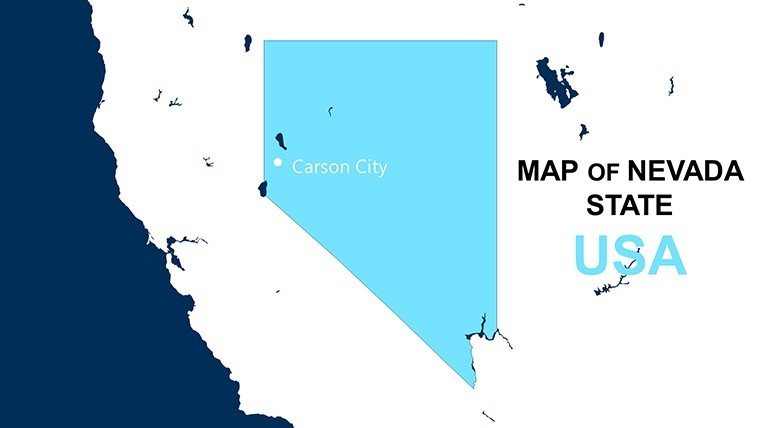
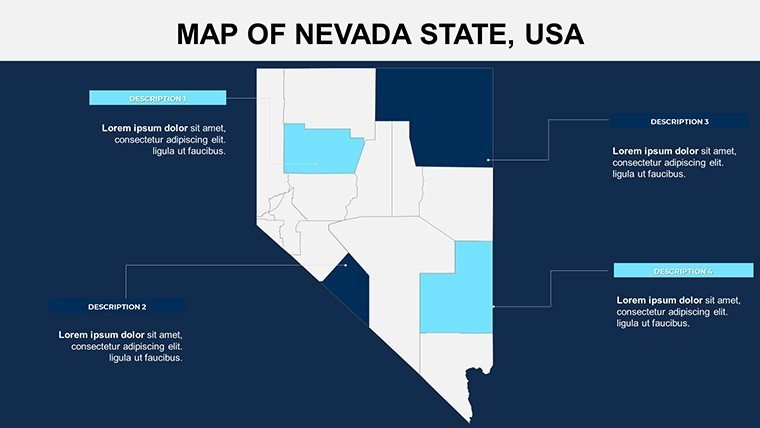
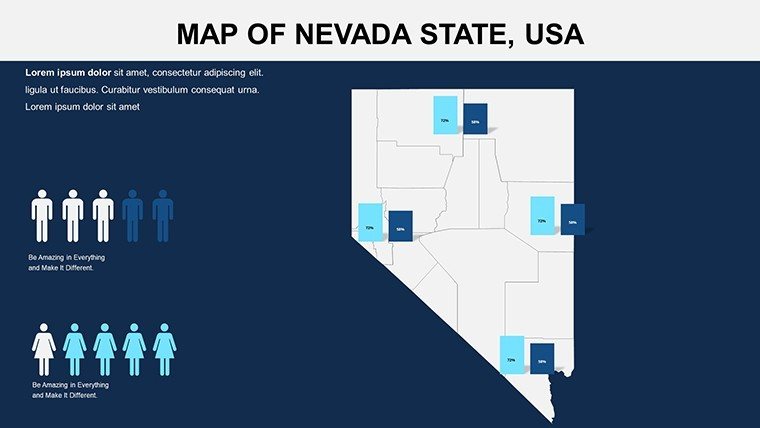
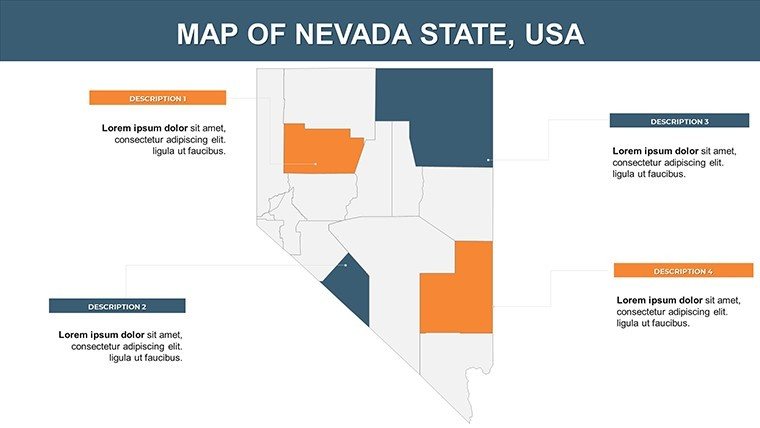
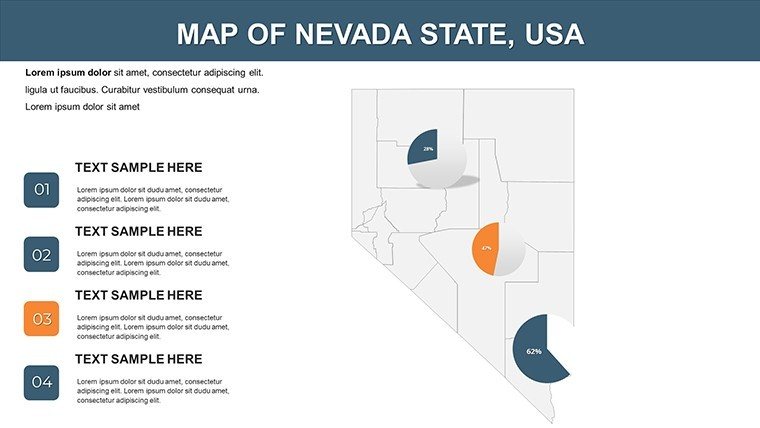
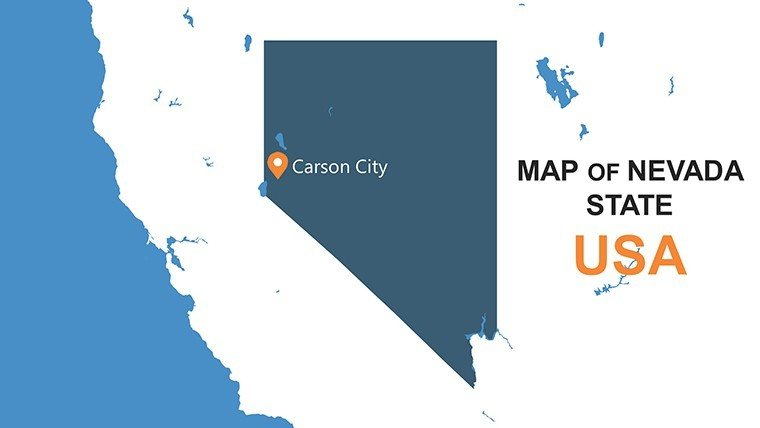
From the glittering lights of Las Vegas to the rugged Sierra Nevada peaks, Nevada's diverse landscapes demand visuals that match their drama. Our Nevada PowerPoint Maps Template delivers exactly that with 26 meticulously crafted, editable slides ready to bring your data to life. Tailored for professionals navigating the Silver State's unique economy - think tourism booms and mining operations - this template helps you craft narratives that captivate and convince.
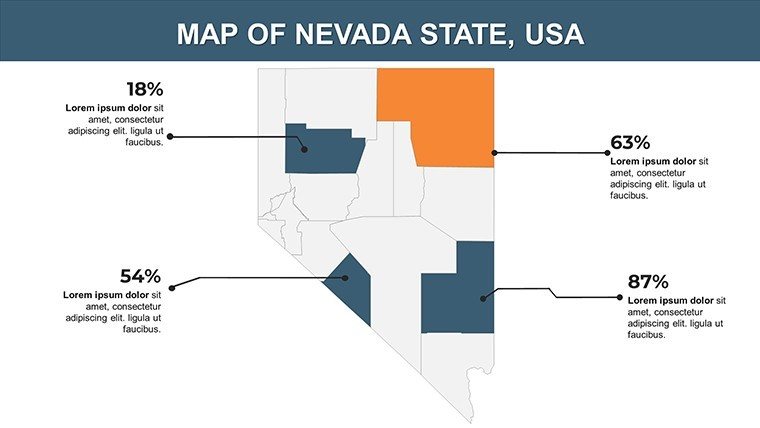
Envision a sales team mapping out convention center expansions or educators tracing the Humboldt River's path through history. This .pptx template offers high-fidelity maps that adapt to your needs, supporting overlays for economic indicators like gaming revenue or renewable energy sites. Drawing from Nevada's real-world pulse, such as the growth in Reno's tech sector, it empowers users to highlight opportunities with precision and style.
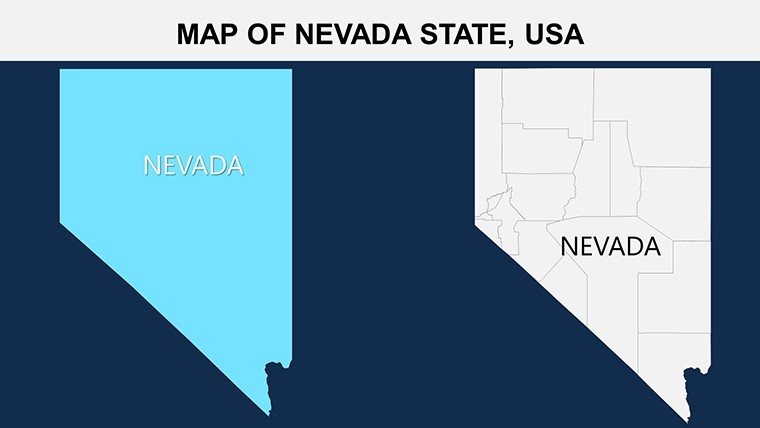
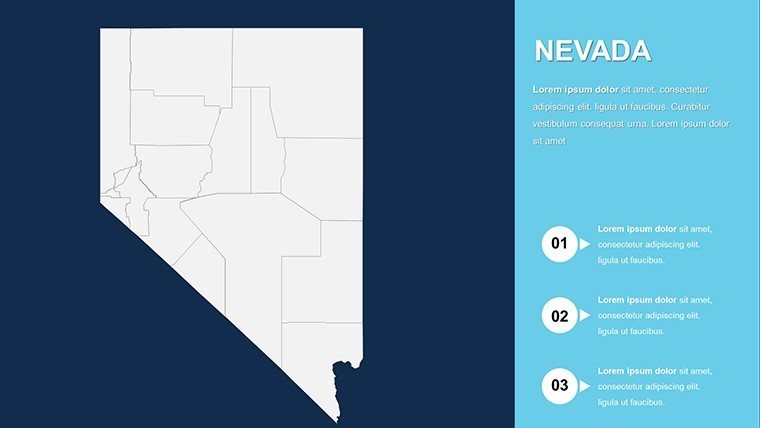
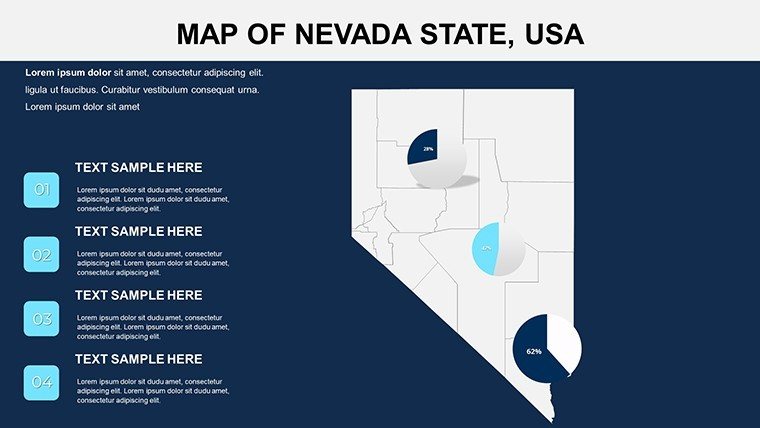
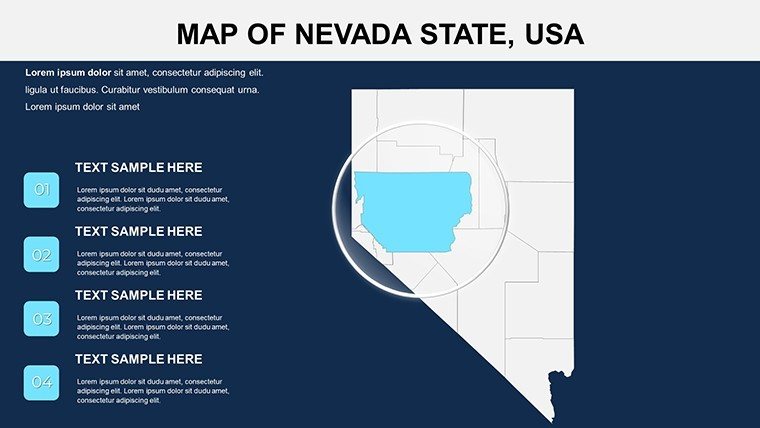
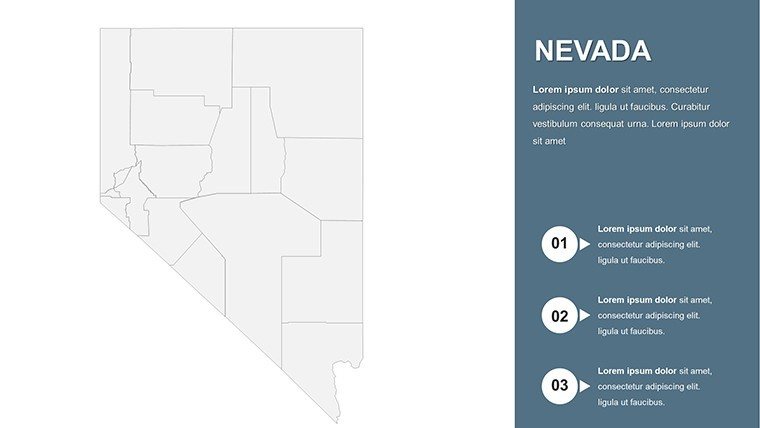
Beyond aesthetics, the template prioritizes functionality. Slides include thematic variations: isometric views for 3D-like terrain, heat maps for population shifts, and route planners for logistics. It's designed for quick edits, ensuring you spend less time formatting and more time strategizing. Whether presenting to stakeholders or students, these maps turn geographical facts into persuasive tools.
Essential Features Driving Nevada's Visual Storytelling
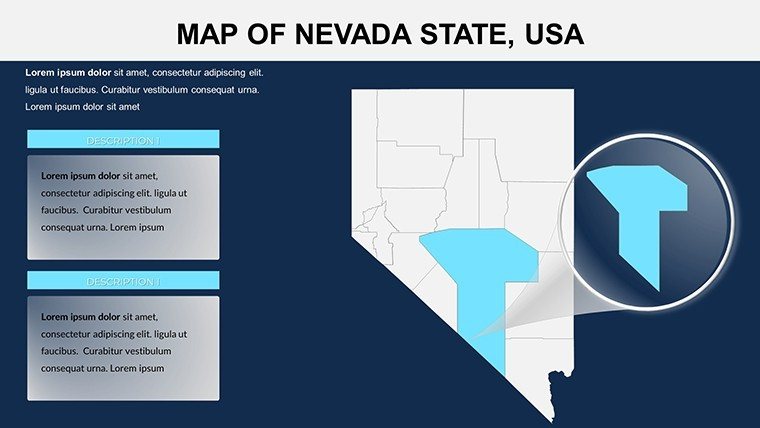
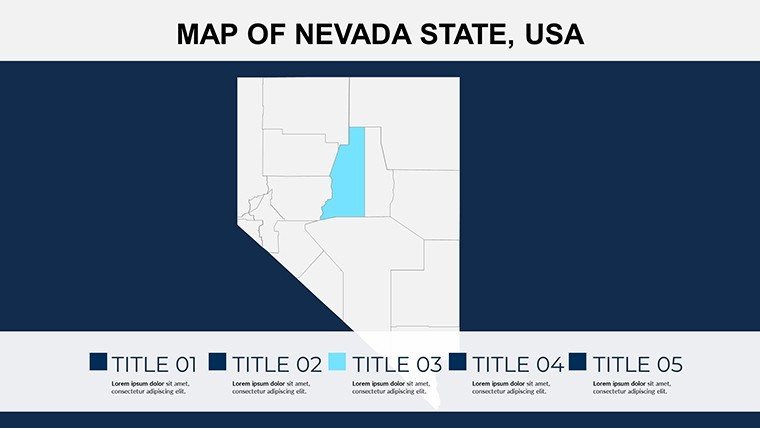
Explore the robust toolkit within this 26-slide powerhouse. Each map is optimized for detail, featuring labeled cities like Carson City and natural landmarks such as Death Valley. Customization extends to fonts, shadows, and gradients, allowing alignment with corporate branding or educational themes.
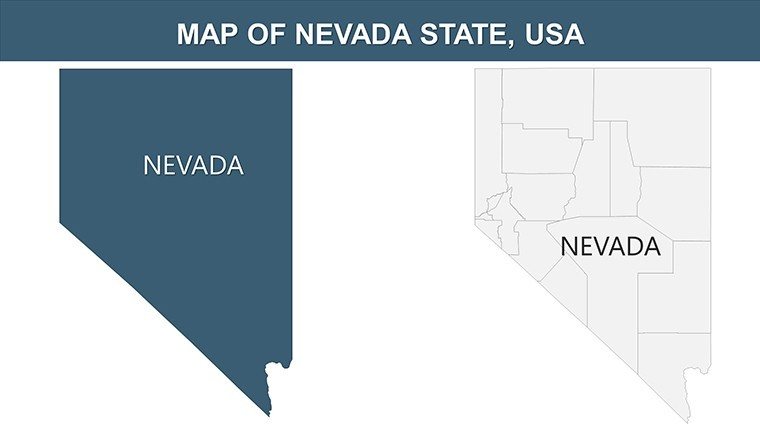
- Geospatial Accuracy: Based on official outlines, ensuring trustworthy representations for reports compliant with standards like those from the Nevada State Demographer.
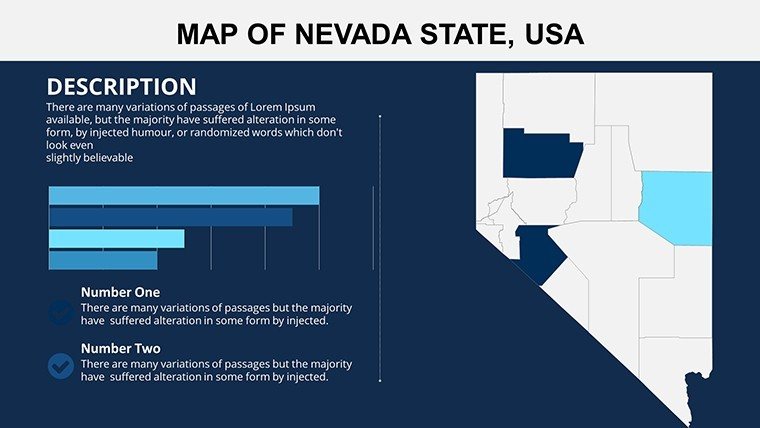
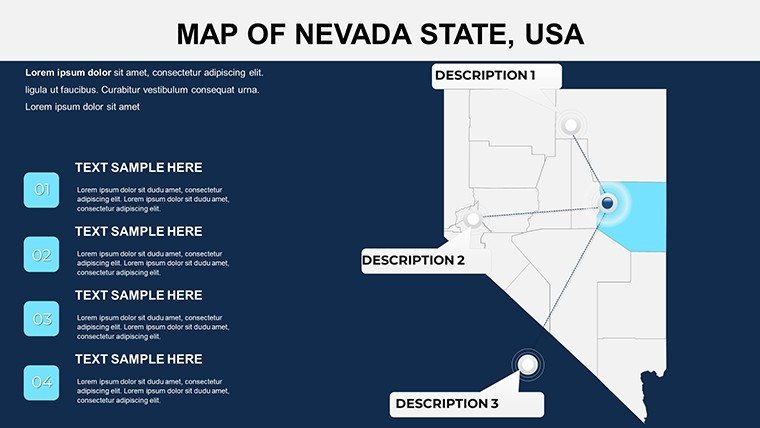
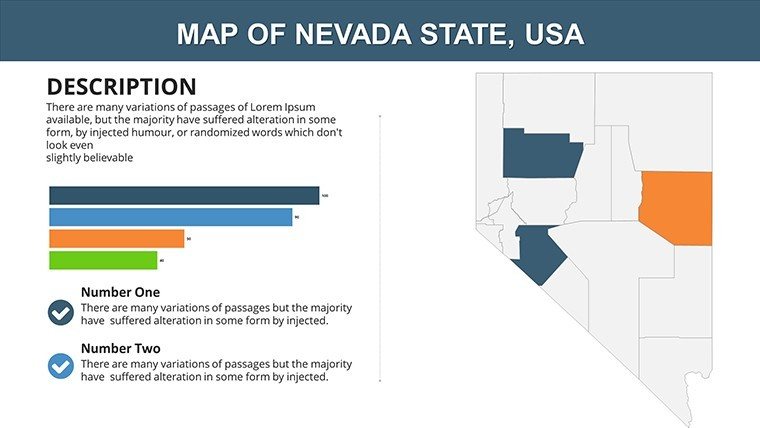
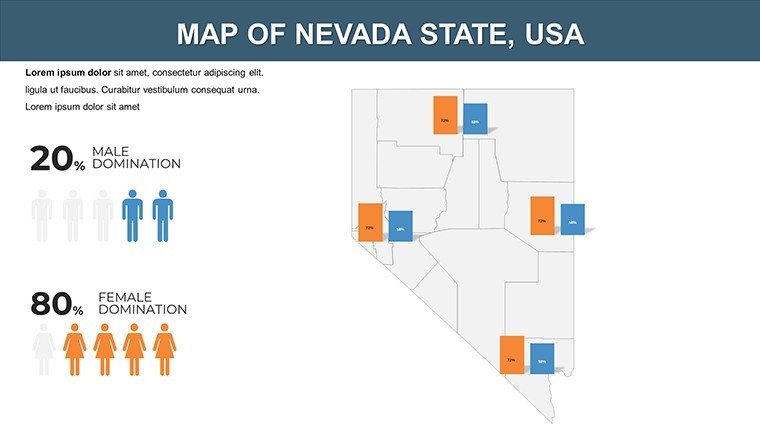
- Multi-Layer Support: Stack data layers for complex analyses, such as overlaying tourism stats on highway networks.
- Icon Library: Includes desert motifs, casino symbols, and wildlife icons to infuse regional flavor.
- Responsive Design: Adapts to widescreen or standard formats, perfect for hybrid events.
These features shine in practice; for instance, environmental consultants use them to visualize water scarcity issues, integrating Bureau of Land Management data for authoritative depth.
Pro Tips for Seamless Customization
Start by selecting a base slide and importing GIS data via PowerPoint's insert tools. Animate paths to show migration trends from rural areas to urban centers, enhancing engagement. In a marketing context, color-code attractions - vibrant for hotspots like Lake Tahoe - to drive interest. Experts recommend limiting data points per slide to maintain clarity, a principle embedded in this template's minimalist layouts.
Versatile Applications Across Nevada's Sectors
This template excels in education, mapping geological formations for geology classes or historical migrations for social studies. Businesses leverage it for market analyses, such as plotting retail expansions in Henderson amid population growth forecasts from the Nevada Gaming Control Board.
Tourism agencies create itineraries highlighting routes from Vegas to Valley of Fire, complete with distance calculators. In policy discussions, government officials chart infrastructure like high-speed rail proposals, using the template's line maps for impact. A real example: A Reno startup pitched venture funding using these visuals, securing investment by clearly delineating tech corridor potentials.
Even in research, it's invaluable for depicting seismic activity patterns, aiding presentations at conferences like those hosted by the Nevada Seismological Laboratory.
Guided Steps to Integrate into Your Projects
- Acquire and Setup: Download the file and review slide thumbnails for quick navigation.
- Populate Content: Use drag-and-drop for images or formulas for dynamic charts on maps.
- Theme Alignment: Swap colors to evoke Nevada's sunsets - oranges and purples - for thematic consistency.
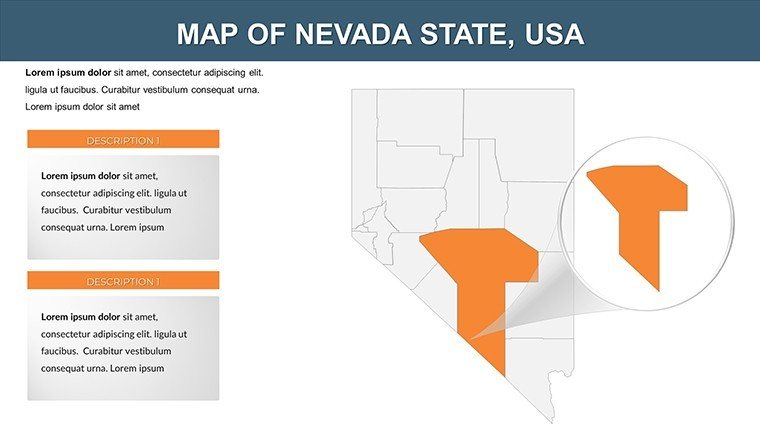
- Enhance Engagement: Add tooltips or zoom effects for interactive elements in digital formats.
- Finalize Delivery: Export to PDF for handouts or present live with confidence.
Unlike standard templates that feel cookie-cutter, this one offers Nevada-specific nuances, saving time and elevating professionalism.
Elevate Your Presentations with Regional Precision
In today's data-driven world, visuals matter. This template not only complies with accessibility guidelines like WCAG but also fosters inclusivity with alt-text ready elements. Integrate with software like ArcGIS for pro-level exports, or keep it lightweight for everyday use. The payoff? Audiences grasp concepts faster, leading to better decisions - from boardroom strategies to classroom breakthroughs.
Don't let bland maps dim your message. Secure the Nevada PowerPoint Maps Template now and chart a course to presentation excellence across the Silver State.
Frequently Asked Questions
Is this template suitable for Google Slides?Absolutely, with minor adjustments for full compatibility and animations.
What level of detail do the maps provide?County-level granularity, including major roads and landmarks for comprehensive coverage.
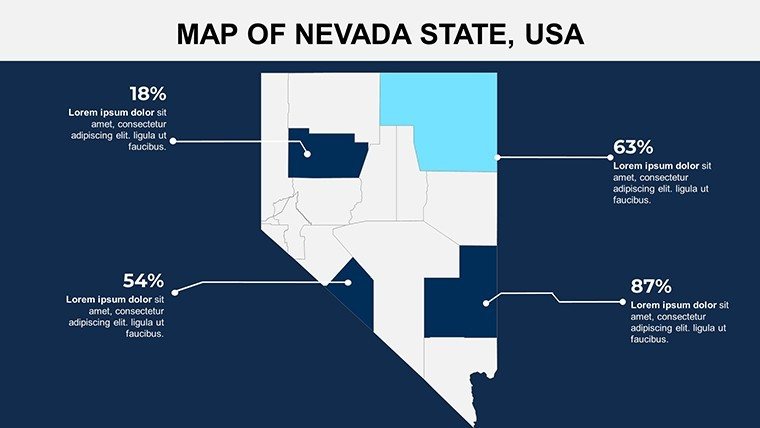
Can I add my own data visualizations?Yes, embed pie charts or timelines directly onto slides effortlessly.
Are there usage restrictions?No, unlimited use for personal, educational, or commercial projects.
How does it handle large datasets?Optimized for performance, with grouping tools to manage complexity.
Support for multiple languages?Text is fully editable, supporting Unicode for diverse audiences.
Good for
- Project roadmaps and sprint plans
- Product launch timelines
- Quarterly or annual review decks
- Company history and milestone summaries
Licence
reviews
The slide layouts were simple which helped for a technical presentation.
I only used the map pages and ignored the extra diagrams.
Colors looked slightly washed out on my monitor.
Still better than making everything from scratch.
The icons were easy to understand.
FAQ
Will it work in Google Slides?
Are fonts embedded?
Can I use this for client work?
What's the refund policy?
Do you update the template after purchase?
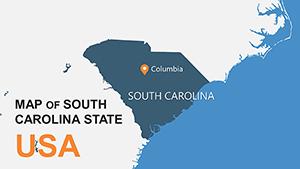
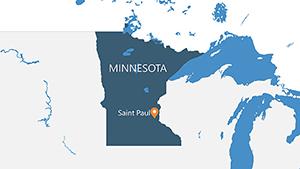
Similar templates
See all PowerPoint Maps →

All 26 slides