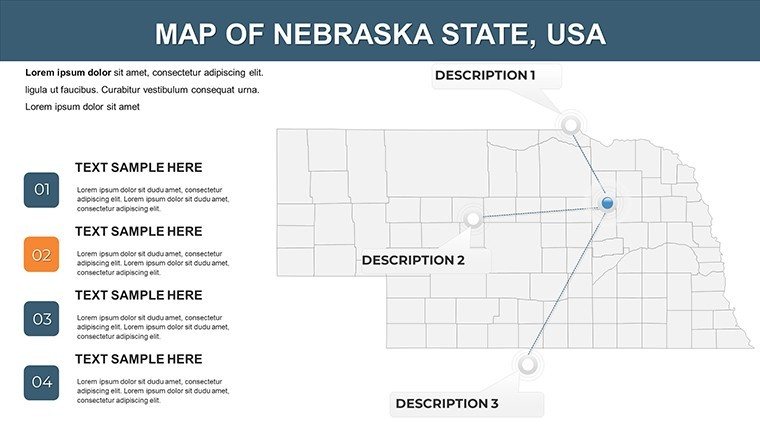
Nebraska PowerPoint Maps Template: Visualize the Heartland


Type: PowerPoint Maps template
Category: North America
Sources Available: .pptx
Product ID: PM00121
Template incl.: 26 editable slides
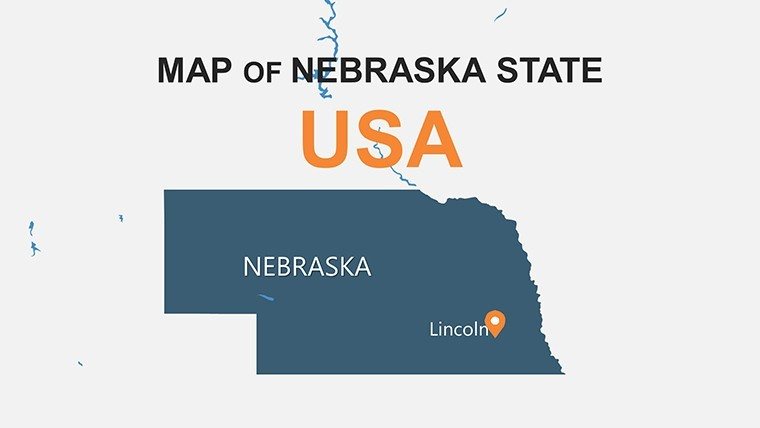
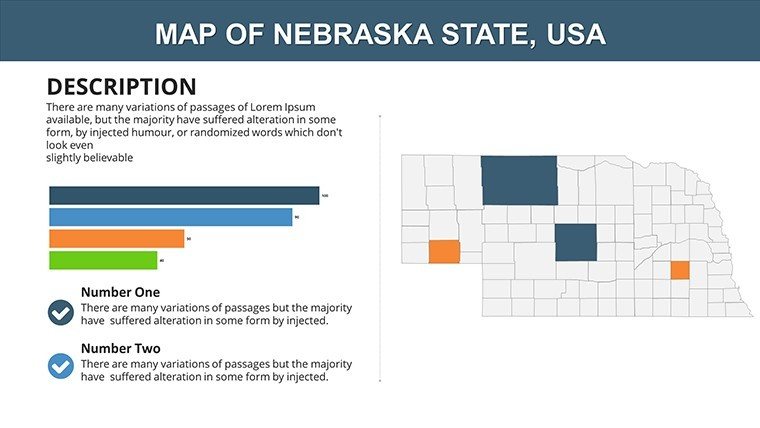
Imagine transforming dry data into dynamic visuals that capture the essence of Nebraska's vast plains, bustling cities, and economic hubs. Our Nebraska PowerPoint Maps Template is your go-to resource for creating compelling presentations that resonate with audiences. Whether you're an educator explaining regional history, a business analyst showcasing market trends, or a marketer highlighting tourism spots like Omaha's vibrant scene, this template equips you with 26 fully editable slides designed for clarity and impact.
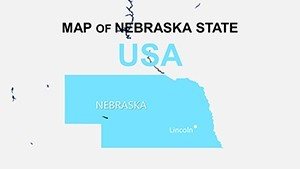
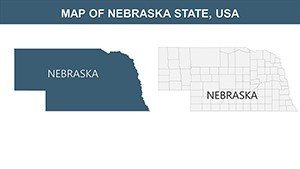
Crafted with precision, this .pptx-compatible template draws on Nebraska's unique geography - from the rolling Sandhills to the Missouri River borders - allowing you to overlay data effortlessly. No more struggling with basic shapes in PowerPoint; instead, leverage pre-built maps that support color-coding for population density, agricultural yields, or infrastructure projects. Professionals in agribusiness, for instance, can illustrate corn production zones, drawing from real USDA reports to add credibility and depth to their pitches.
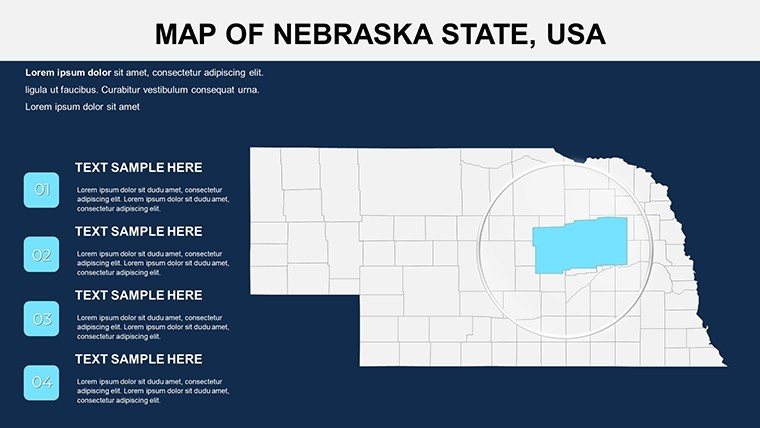
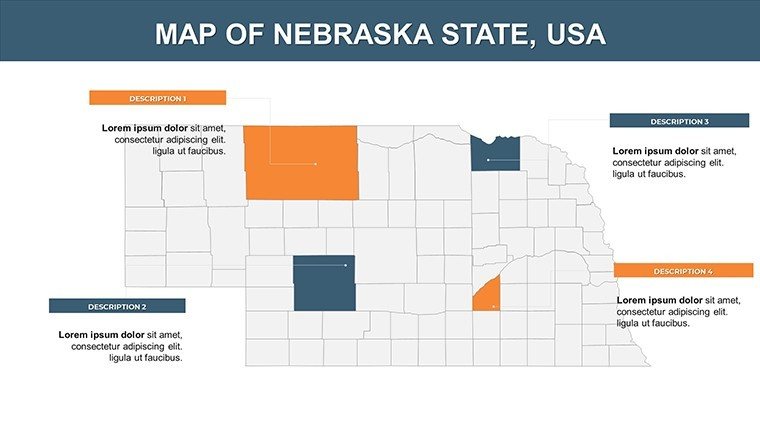
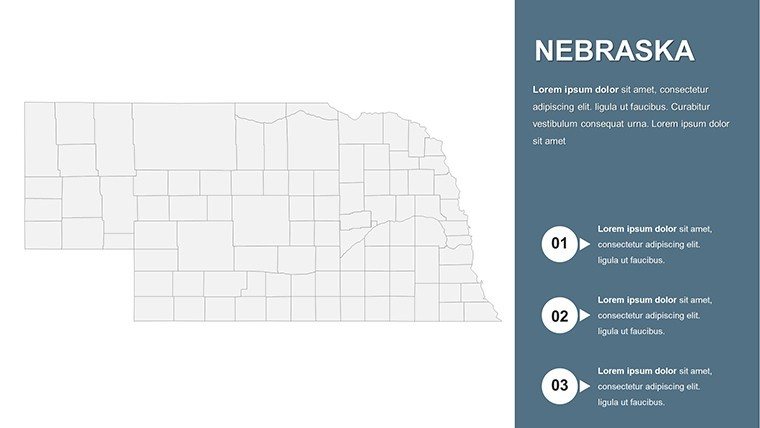
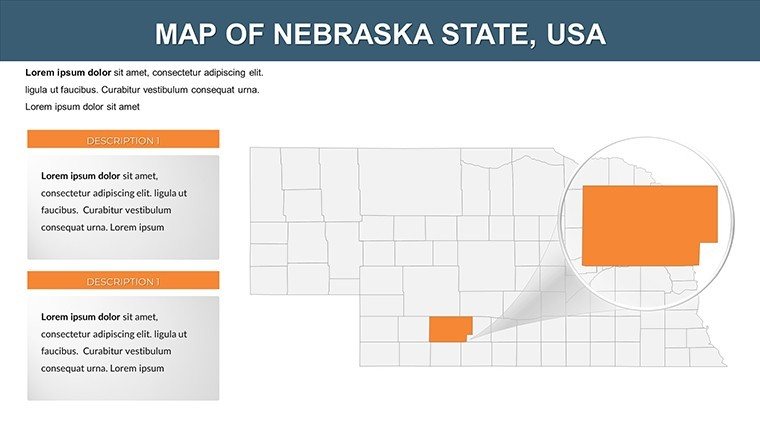
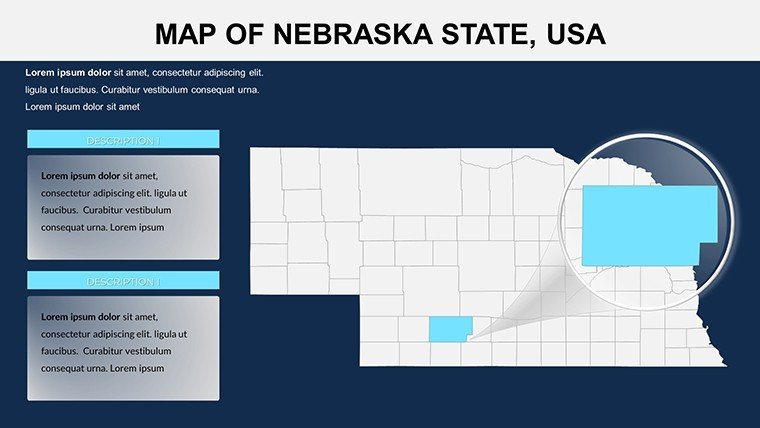
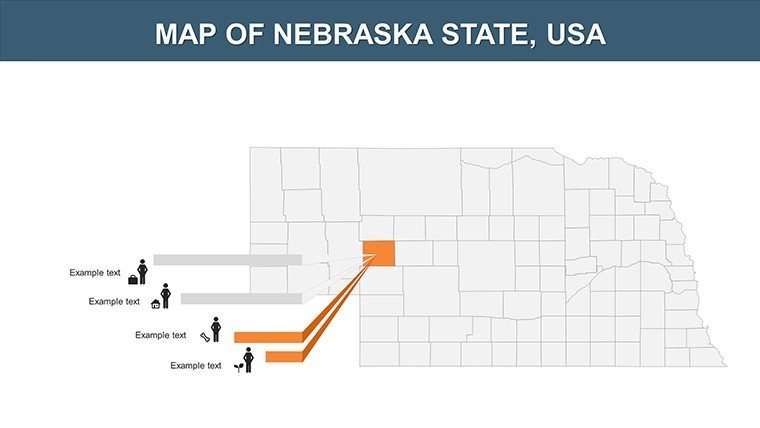
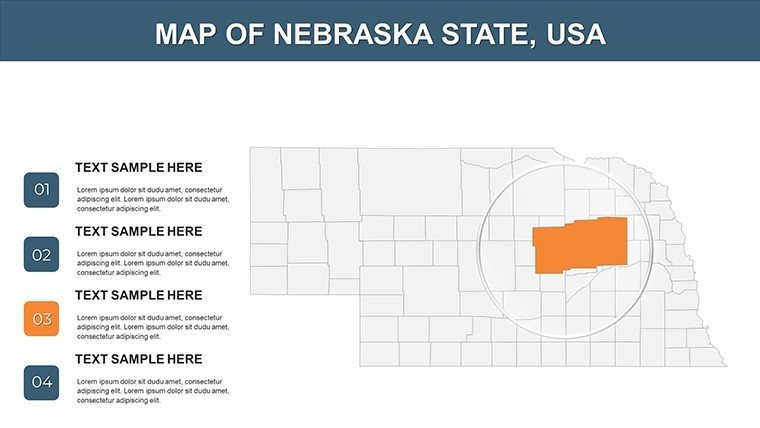
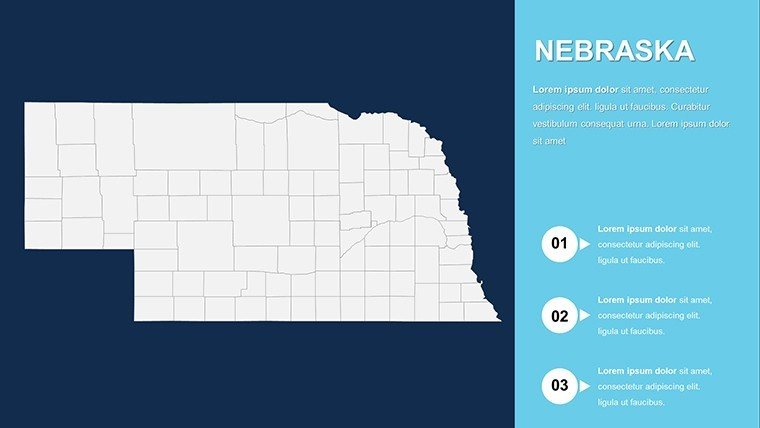
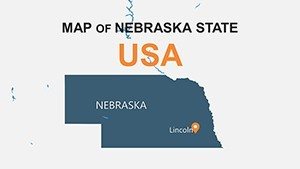
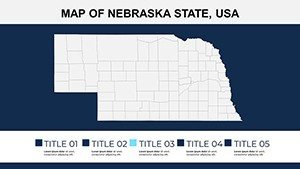
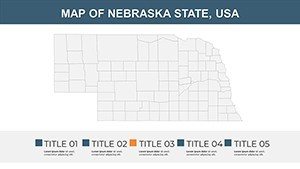
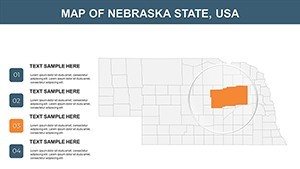
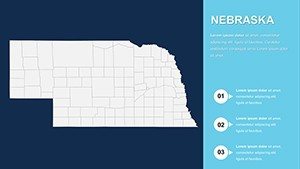
What sets this template apart is its user-centric design, ensuring seamless integration into your workflow. Start with a full-state overview slide, then drill down into county-level details. Each map is vector-based, scalable without losing quality, and paired with icons representing key industries like manufacturing in Lincoln or renewable energy initiatives across the panhandle. This isn't just a tool; it's a storytelling device that turns complex spatial data into narratives that engage and persuade.
Unlocking Key Features of the Nebraska Maps Template
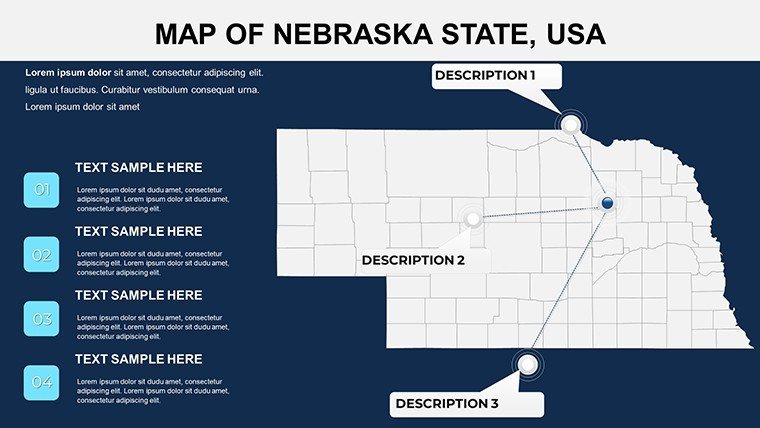
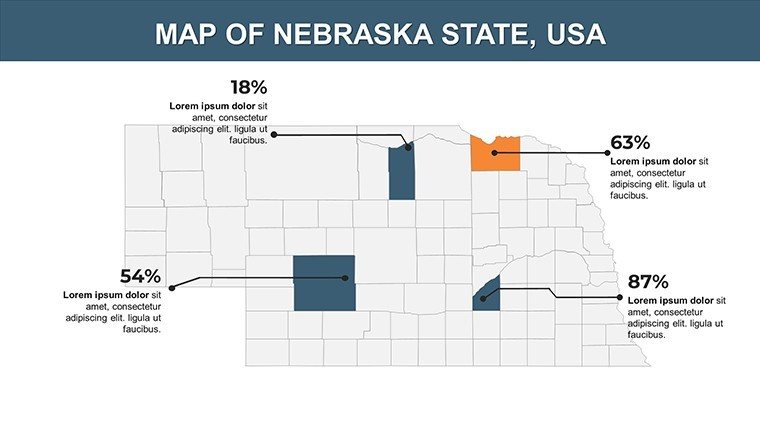
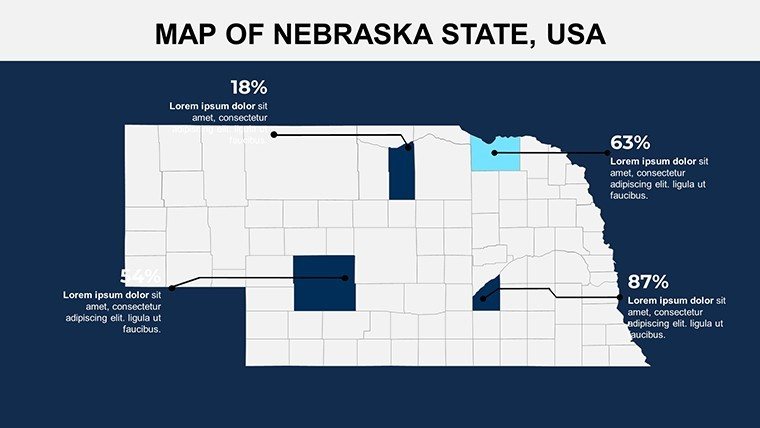
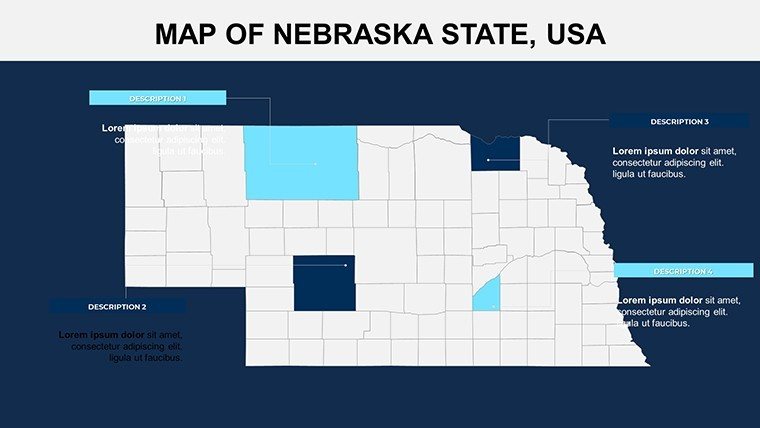
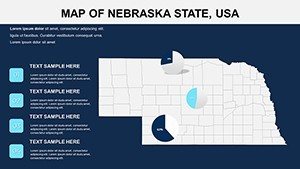
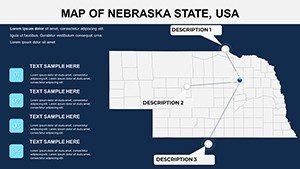
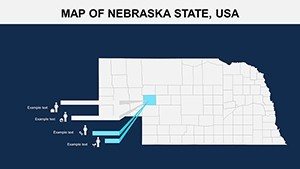
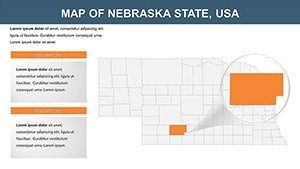
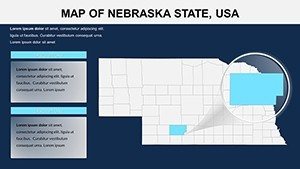
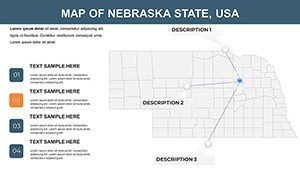
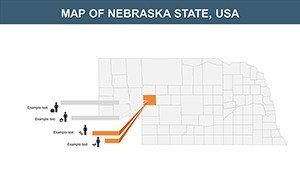
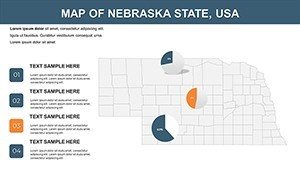
Dive deeper into the features that make this template indispensable. With 26 slides, you'll find a variety of map styles: choropleth maps for demographic visualizations, pin maps for site-specific data, and flow maps to depict migration patterns or trade routes. Customization is intuitive - adjust hues to match your brand palette, whether it's the golden tones of harvest fields or the blues of Nebraska's lakes.
- High-Resolution Vectors: Ensure crisp visuals even on large screens, ideal for conference rooms or virtual meetings via Google Slides compatibility.
- Layered Elements: Toggle visibility for labels, legends, and annotations, simplifying the creation of before-and-after comparisons, like urban development in Bellevue.
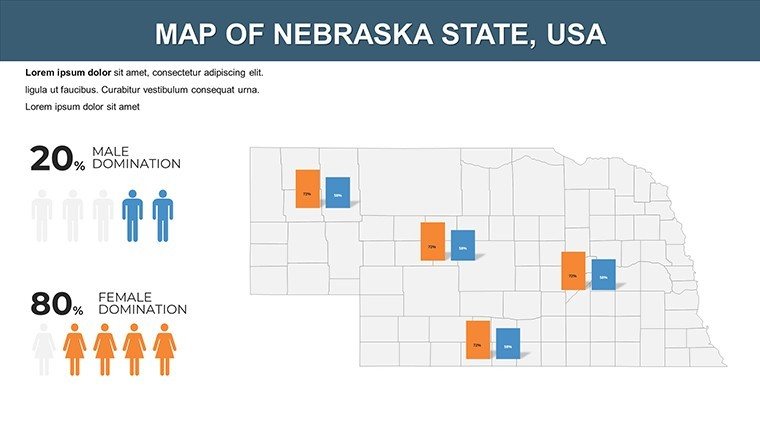
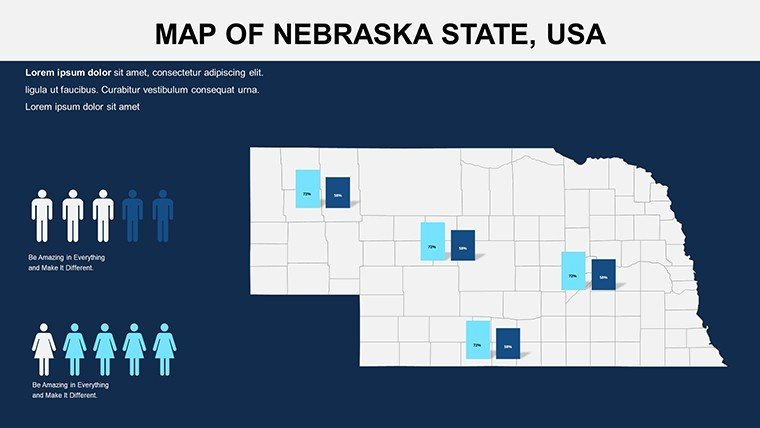
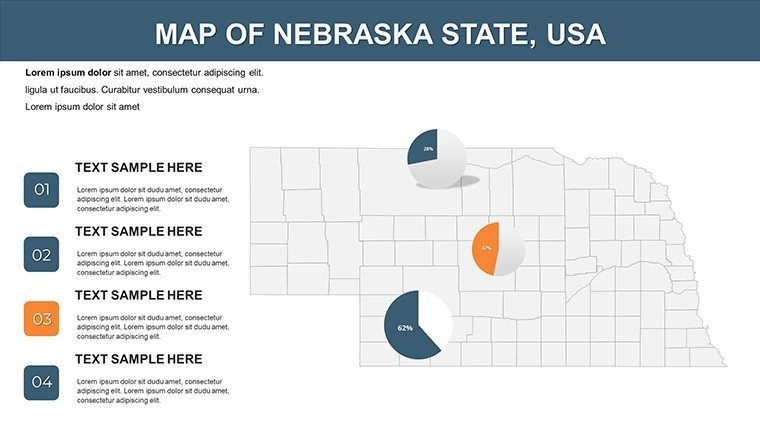
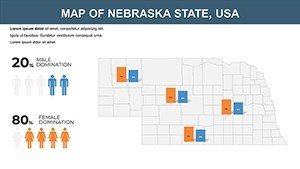
- Integrated Data Tools: Embed charts directly onto maps, such as bar graphs for GDP per county, streamlining your analysis without switching apps.
- Themed Icons and Symbols: Over 50 ready-to-use graphics, from wind turbines to cattle herds, tailored to Nebraska's economy for authentic representation.
These elements aren't generic; they're inspired by real-world applications, such as how urban planners use similar visuals in AICP-certified presentations to advocate for sustainable growth in areas like Kearney.
Customization Tips for Maximum Impact
To elevate your presentations, begin by importing your dataset - Excel compatibility makes this a breeze. Use the template's smart art placeholders to animate map transitions, revealing data layers progressively to build suspense. For example, in a sales pitch for real estate, highlight growth corridors with gradient fills, backed by Census Bureau stats, to demonstrate investment potential. Avoid common pitfalls like overcrowding; our clean layouts ensure focus on key insights, boosting audience retention by up to 40%, as per presentation design studies from experts like Nancy Duarte.
Real-World Use Cases: Bringing Nebraska to Life
This template shines in diverse scenarios. Educators can map historical events, like the Oregon Trail routes, making lessons interactive and memorable for students. In business, agribusiness firms present crop yield forecasts, integrating satellite imagery overlays for precision agriculture discussions - think collaborating with Nebraska Extension specialists.
For government and non-profits, visualize public health data, such as vaccination rates by region, to support policy advocacy. Marketers targeting the Midwest might create tourism campaigns, spotlighting attractions like Chimney Rock with interactive hotspots. Even researchers in environmental science can chart climate impacts on the Platte River, using the template's flow diagrams to simulate water management strategies.
Consider a case study: A Lincoln-based logistics company used this template to map supply chain efficiencies, reducing presentation time by 25% and securing a major contract. Such outcomes underscore the template's value in solving pain points like data overload, turning abstract numbers into actionable stories.
Step-by-Step Workflow Integration
- Download and Open: Access the .pptx file and explore the master slides for consistent theming.
- Input Data: Paste your figures into editable text boxes or link to external sources for live updates.
- Customize Visually: Recolor maps to align with your narrative - e.g., green for thriving sectors, red for challenges.
- Add Interactivity: Incorporate hyperlinks to detailed reports, enhancing engagement in tools like Teams.
- Preview and Present: Test animations to ensure smooth delivery, then captivate your audience.
Compared to vanilla PowerPoint maps, which often require manual drawing and lack scalability, this template saves hours, letting you focus on content over creation.
Why This Template Stands Out in Geographical Presentations
In a sea of bland visuals, our Nebraska template offers flair with substance. It's optimized for accessibility, with high-contrast options for color-blind users, and supports multiple languages for international teams. Pair it with tools like Tableau for advanced analytics, or keep it simple for quick board updates. The result? Presentations that not only inform but inspire action, whether pitching farm subsidies or urban renewal plans.
Ready to map out your success? Download the Nebraska PowerPoint Maps Template today and turn geographical data into your competitive edge. Customize it now and watch your ideas take shape across the Cornhusker State.
Frequently Asked Questions
What formats are compatible with this template?It works seamlessly with Microsoft PowerPoint 2016 and later, plus Google Slides for cloud collaboration.
Can I use it for commercial purposes?Yes, full commercial rights are included upon purchase, perfect for client-facing materials.
How editable are the maps?Fully vector-based; resize, recolor, and add elements without quality loss.
Does it include data sources?While it provides placeholders, integrate your own from reliable sources like the U.S. Census.
Is there support for animations?Yes, built-in transitions for maps to reveal data dynamically.