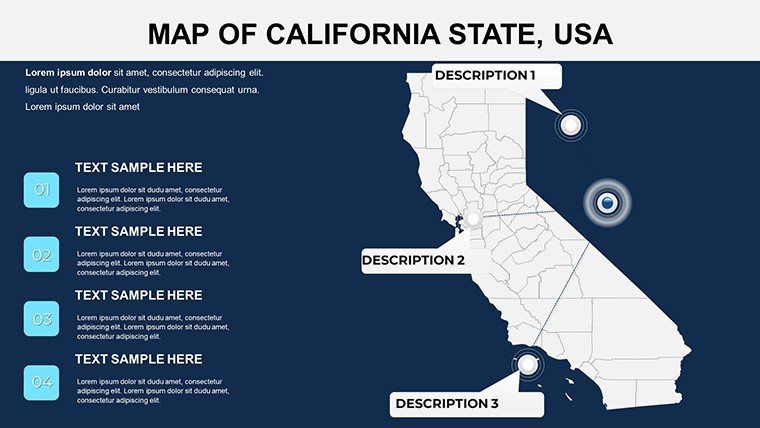
California Counties PowerPoint Maps: 26 Customizable Slides


Type: PowerPoint Maps template
Category: North America
Sources Available: .pptx
Product ID: PM00095
Template incl.: 26 editable slides
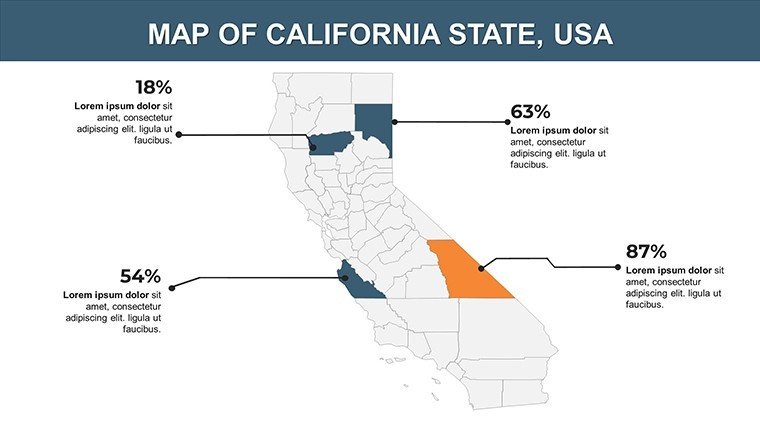
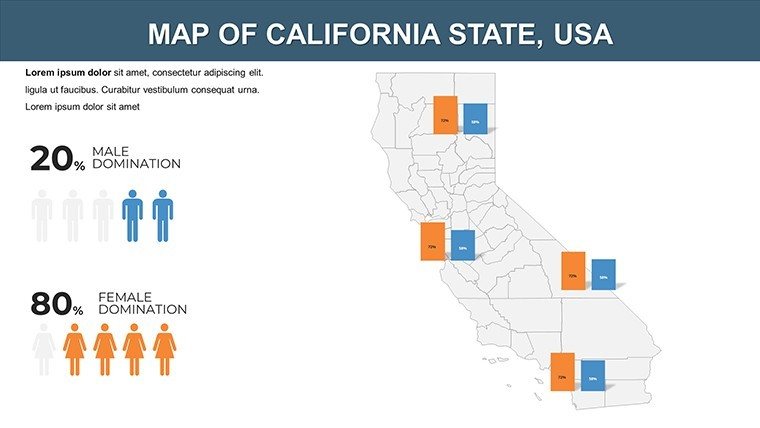
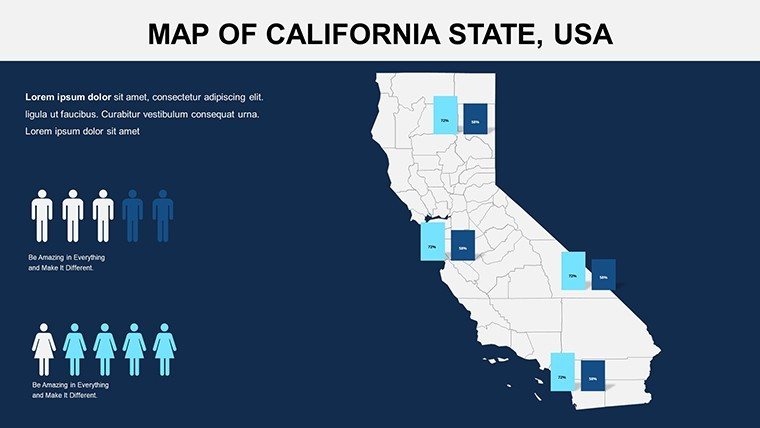
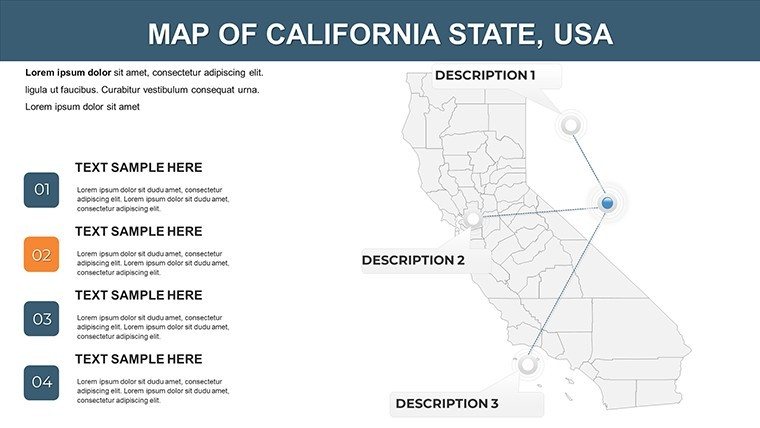
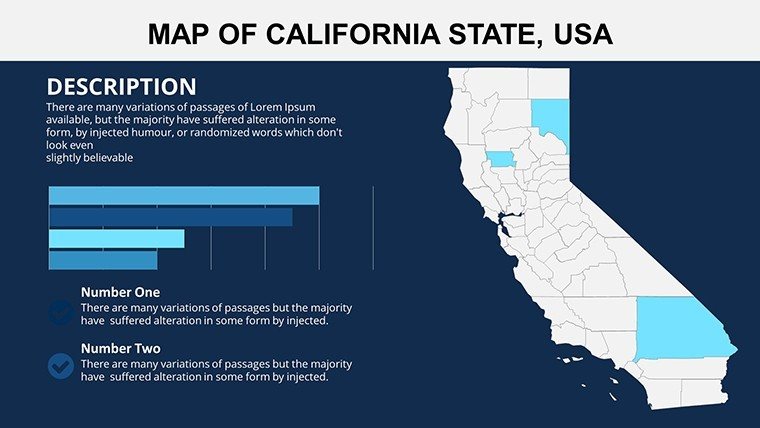
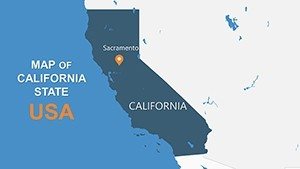
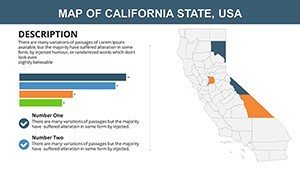
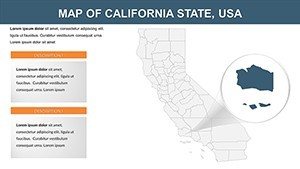
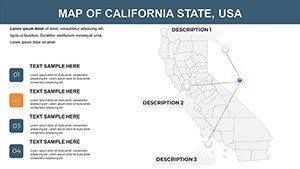
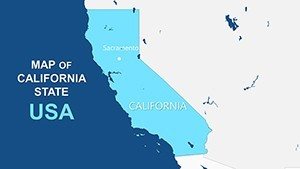
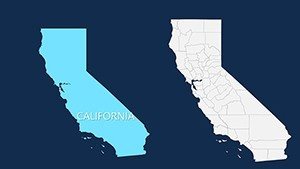
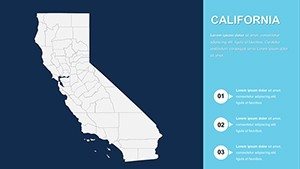
Dive into the heart of the Golden State with our comprehensive California counties PowerPoint maps template, designed to make your presentations shine. Spanning 26 editable slides, this resource covers all 58 counties from Alameda to Yuba, offering precise boundaries and topographic insights for professionals who need to visualize regional data accurately. Whether you're a market researcher tracking tech hubs in Silicon Valley, an educator explaining seismic activity in Los Angeles County, or a tourism expert mapping wine trails in Napa, these maps provide the foundation for compelling narratives. Fully compatible with PowerPoint, they feature user-friendly customization options that let you highlight key areas, integrate statistics, and align with your branding - turning raw geography into persuasive stories that captivate audiences and drive home your points with visual authority.
Why This Template Transforms Your Regional Analyses
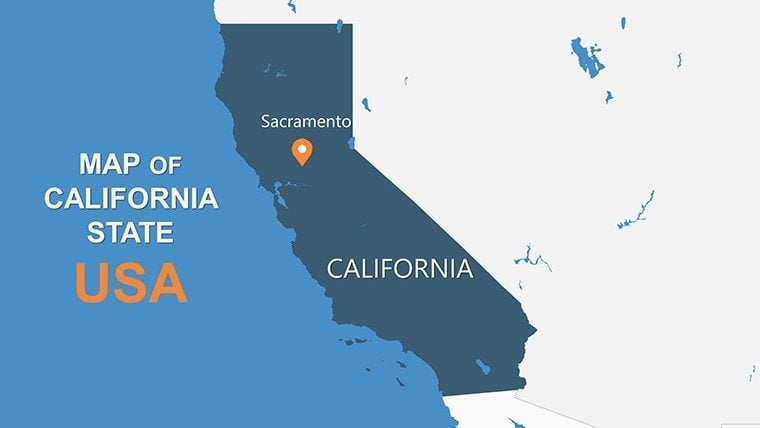
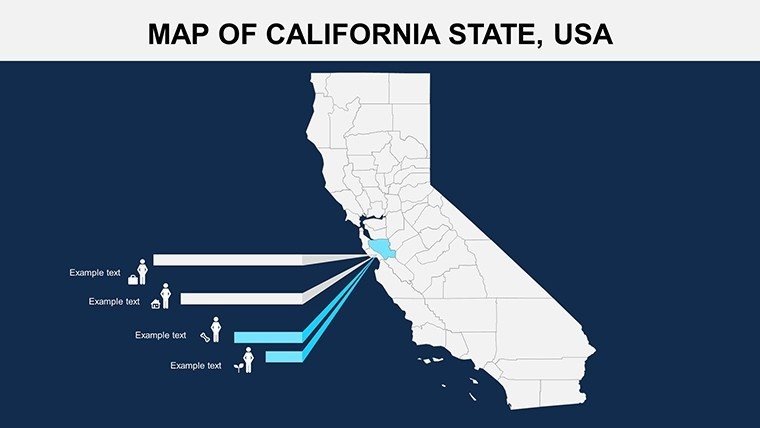
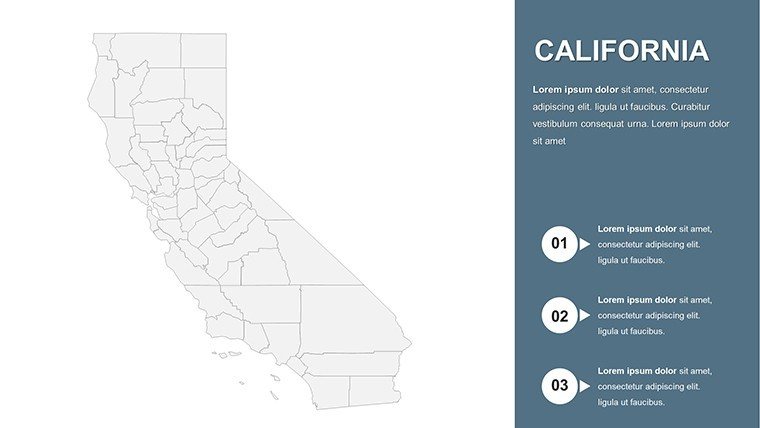
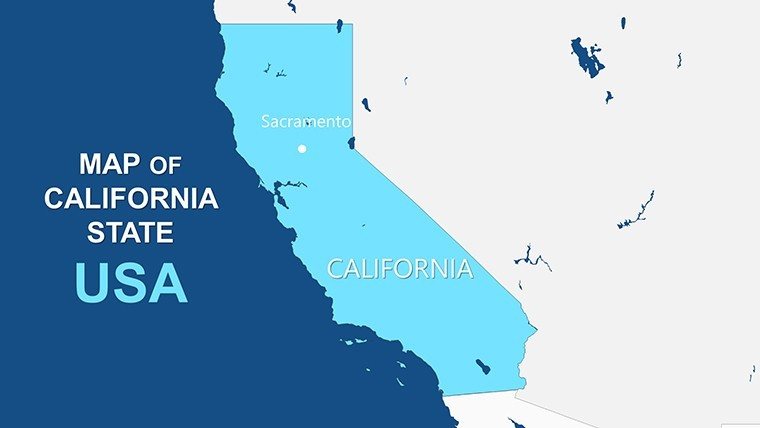
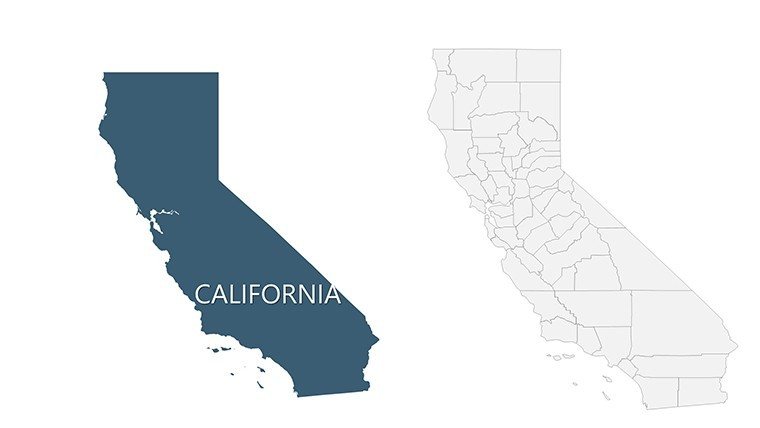
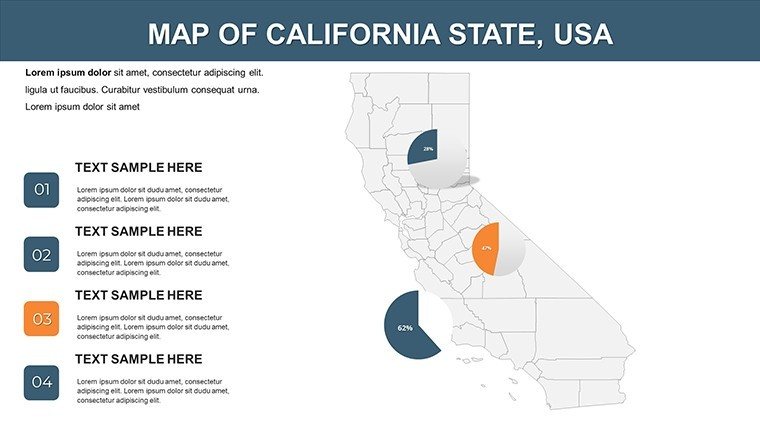
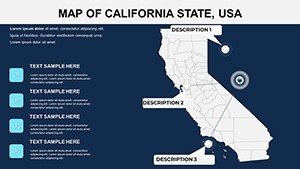
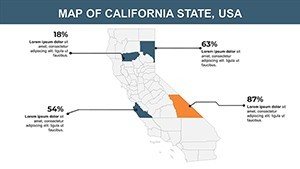
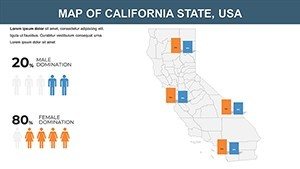
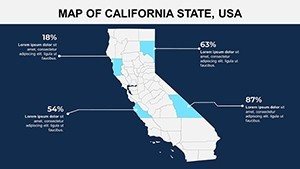
What sets our California maps apart is their focus on practical, data-driven visualization. Each slide is optimized for clarity, with vector graphics that maintain sharpness at any zoom level. You'll find options for choropleth maps to display population densities, point maps for city locations like Sacramento or San Diego, and layered views for environmental factors such as wildfire zones in Ventura County. This template draws from authoritative sources like the U.S. Census Bureau, ensuring your visuals are not only beautiful but backed by reliable data standards.
Standout Features for Seamless Customization
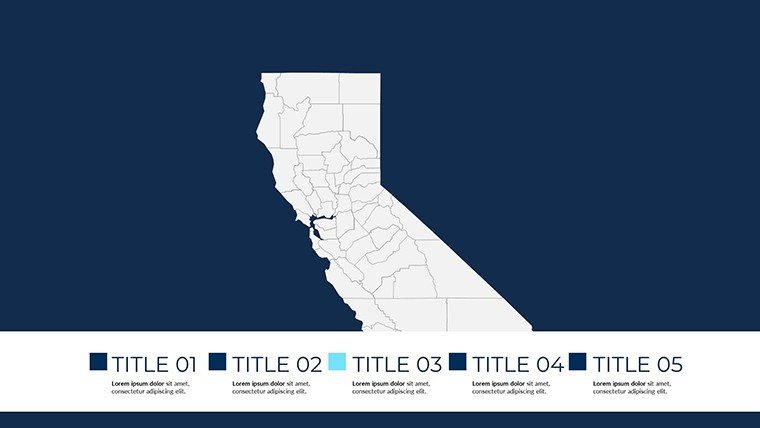
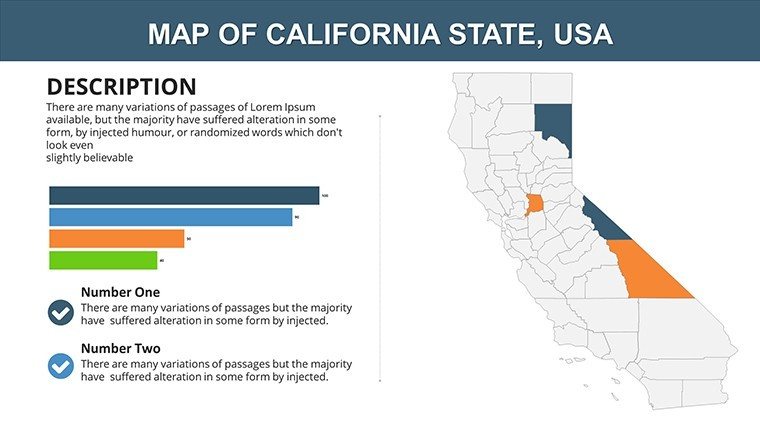
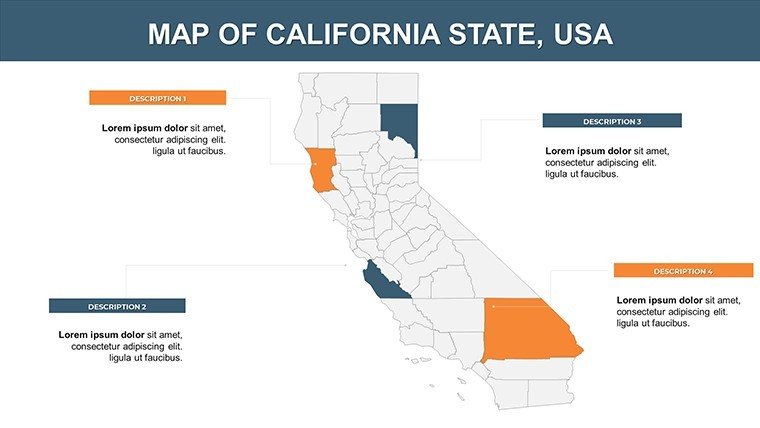
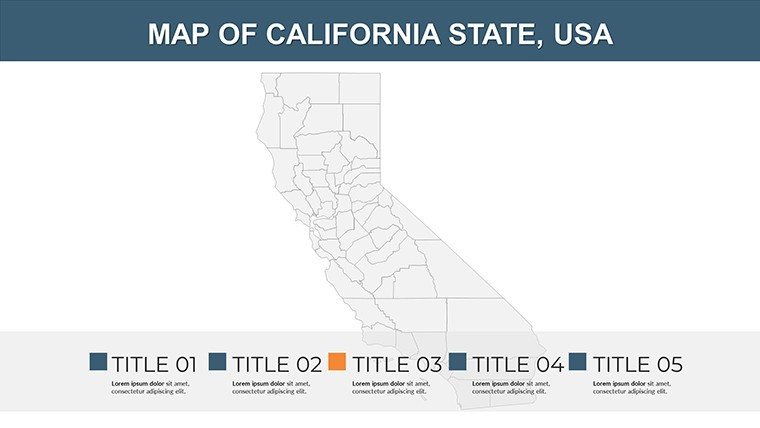
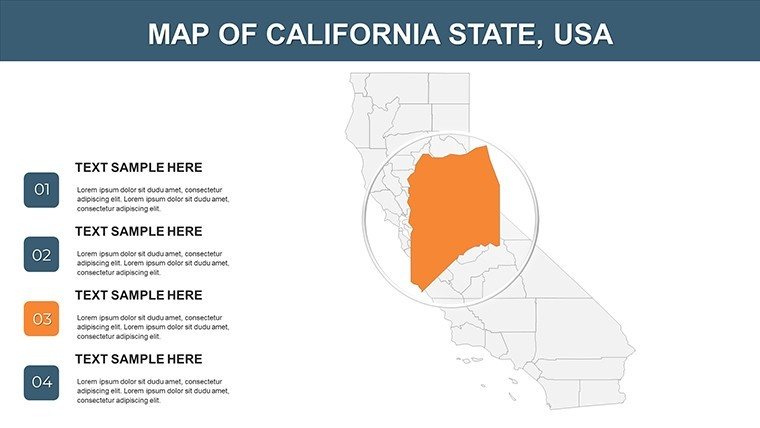
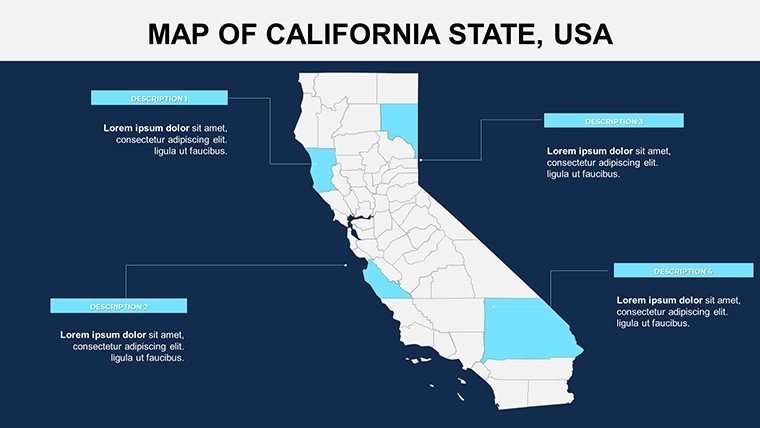
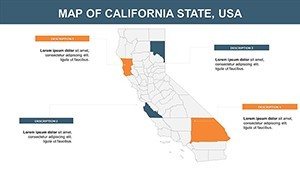
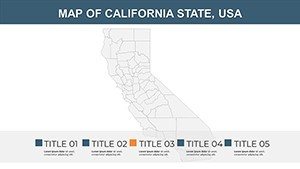
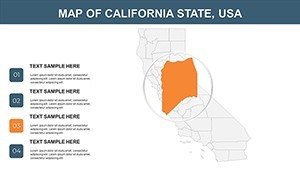
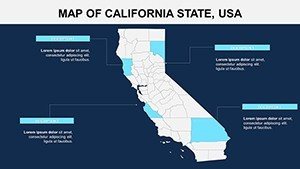
- Comprehensive County Coverage: Detailed outlines of all California counties, ready for data overlays like economic indicators in Orange County.
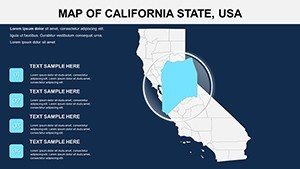
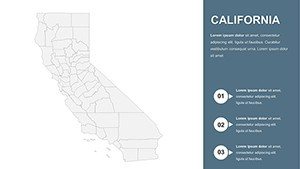
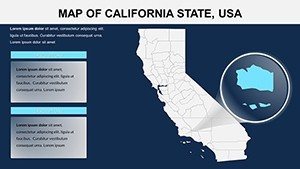
- Color Scheme Flexibility: Switch between vibrant palettes to represent themes, such as blue gradients for coastal areas like Monterey.
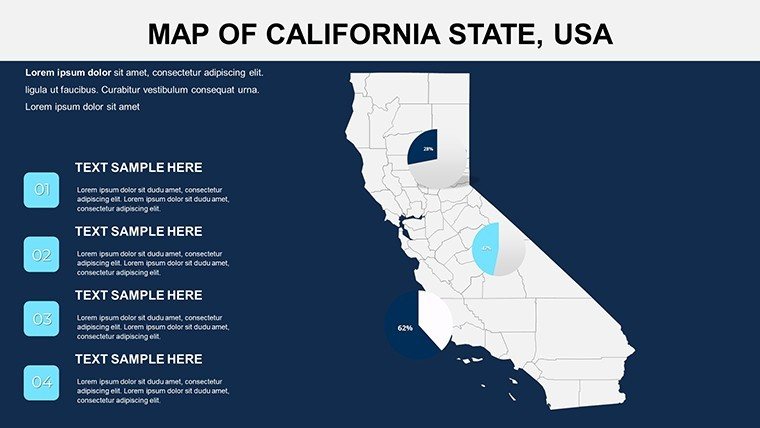
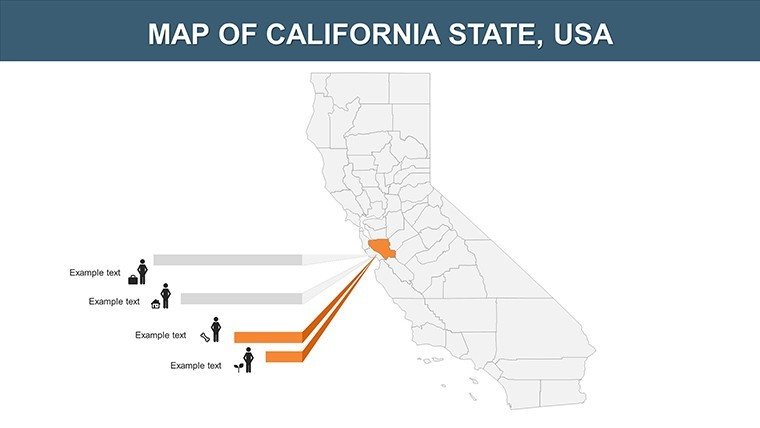
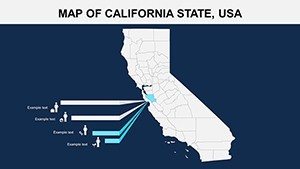
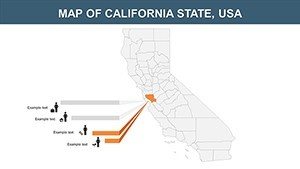
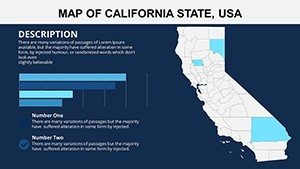
- Data Integration Tools: Easily add charts or infographics, perfect for showing tourism revenue in San Francisco County.
- User-Friendly Edits: No advanced skills needed - resize, recolor, or annotate with PowerPoint's built-in features.
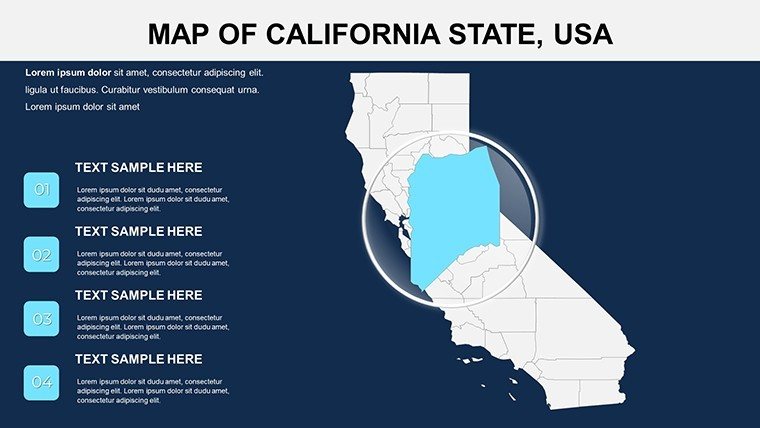
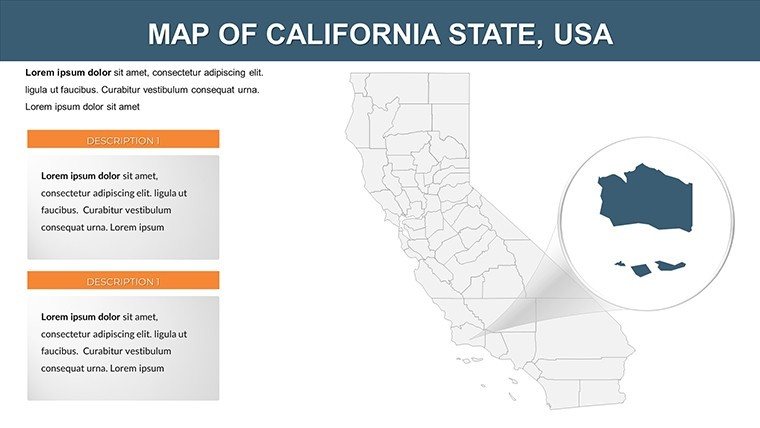
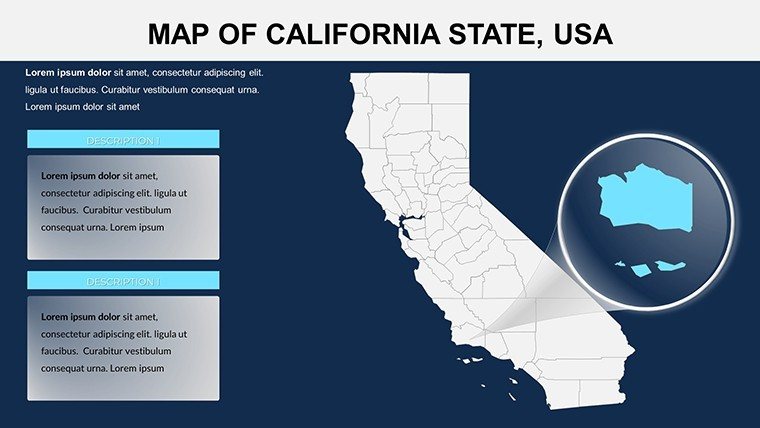
- Versatile Layouts: From overview state maps to zoomed-in regional focuses, like the Central Valley's agricultural hubs.
These elements echo best practices from organizations like the California Geographic Information Association, promoting accurate and engaging spatial communication.
Targeted Use Cases Across Industries
For corporate teams, these maps excel in sales territory planning - imagine dividing Northern California counties for optimized distribution networks, as seen in strategies by companies like Apple. Educators can enrich lessons on state history, using slides to trace Gold Rush paths through El Dorado County, fostering interactive classroom discussions. Researchers benefit from visualizing public health data, such as COVID trends in densely populated Riverside County, supported by case studies from UCLA studies that emphasize visual aids for better comprehension.
In the tourism sector, create brochures highlighting adventure spots in Shasta County or cultural events in Fresno, with embedded links for deeper exploration. Unlike standard PowerPoint defaults, our template includes pre-set legends and scales, reducing setup time and enhancing professionalism. This is especially valuable in fast-paced environments, where quick iterations can mean the difference between a good pitch and a great one.
Practical Workflow for Effective Implementation
- Launch the template and pick a county-focused slide as your base.
- Customize colors to match your dataset, e.g., red for high-traffic areas in Los Angeles.
- Incorporate external data via linked Excel sheets for real-time updates on metrics like unemployment in Kern County.
- Enhance with icons or shapes to denote landmarks, such as Yosemite in Mariposa County.
- Test animations for revealing county details sequentially during your talk.
- Share via export options, ensuring compatibility for team collaborations.
This approach aligns with agile presentation methods, allowing rapid adaptations based on audience feedback.
Superior to Basic Alternatives
Free map tools often fall short with outdated boundaries or limited edits, but our template offers current, high-fidelity designs that integrate seamlessly with advanced features like PowerPoint's morph transitions. Businesses report improved stakeholder buy-in when using such detailed visuals, as in regional planning for sustainable energy in San Bernardino County.
For marketers, these slides enable hyper-local campaigns, segmenting by coastal vs. inland counties to tailor messages effectively. A notable example: A real estate firm used analogous maps to showcase property values across Sonoma County, resulting in higher engagement rates.
Boost Your California-Focused Presentations Now
Ready to map out success? Our California counties template empowers you to present with confidence and creativity. Download it today and watch your ideas take shape in ways that resonate and inspire action.
Frequently Asked Questions
- Are the county boundaries in this template up-to-date?
- Yes, they reflect the latest administrative divisions from reliable sources like the California State Association of Counties.
- Can I integrate this with Google Slides?
- While optimized for PowerPoint, you can upload the PPTX file to Google Slides for basic compatibility, though some advanced features may vary.
- What types of data can I overlay on these maps?
- Anything from demographic stats to economic indicators - simply use PowerPoint's charting tools for seamless integration.
- Is there a limit to how many times I can edit the slides?
- No limits; edit as often as needed for different projects or updates.
- Does the template include sample data?
- Yes, select slides feature placeholder data on population and key facts to get you started quickly.
- Can I use this for printed materials?
- Absolutely, the high-resolution vectors ensure crisp prints for reports or posters.