Editable United States PowerPoint Maps Template: Navigate American Opportunities


Type: PowerPoint Maps template
Category: North America
Sources Available: .potx, .pptx
Product ID: PM00071
Template incl.: 10 editable slides
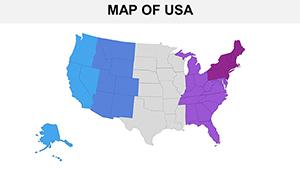
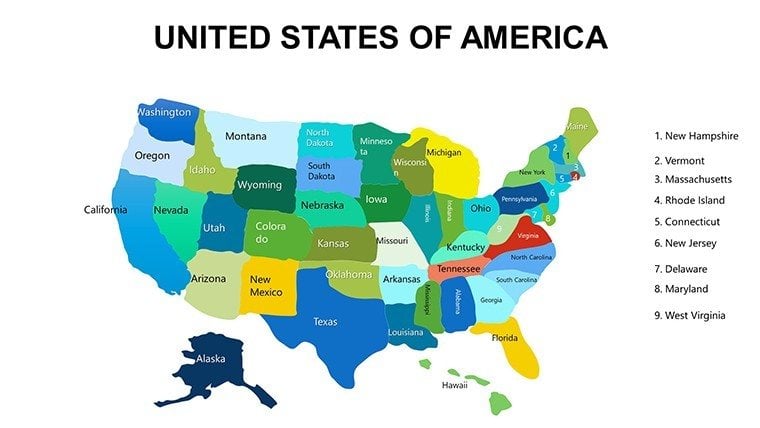
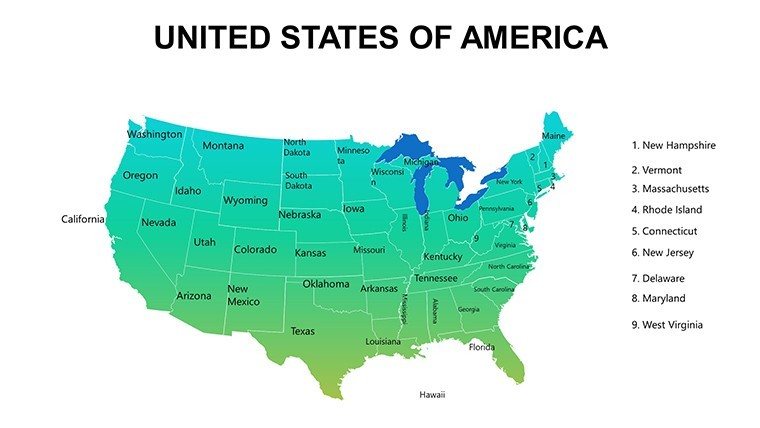
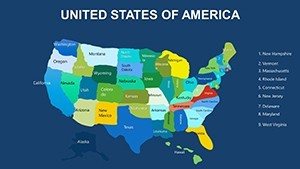
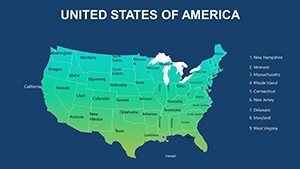
Envision delivering a sales strategy that pinpoints regional trends across the 50 states with effortless precision. Our Editable United States PowerPoint Maps Template delivers exactly that through 10 versatile, customizable slides crafted for professionals in business, education, and beyond. This template is more than maps - it's a gateway to clearer communication, helping you illustrate everything from market shares in California to demographic shifts in the Midwest.
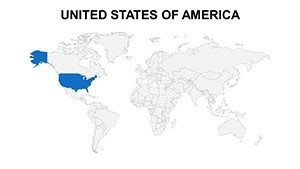
In an era where data localization matters, from election analytics to supply chain logistics, generic tools fall short. Our template, compatible across PowerPoint platforms including Windows, Mac, and Office 365, features high-res vectors that adapt to your narrative. It addresses common frustrations like clunky editing by offering intuitive tools for colors, markers, and infographics. Drawing from applications in Fortune 500 pitches, it empowers users to create visuals that not only inform but influence outcomes.
Core Features Driving Professional Excellence
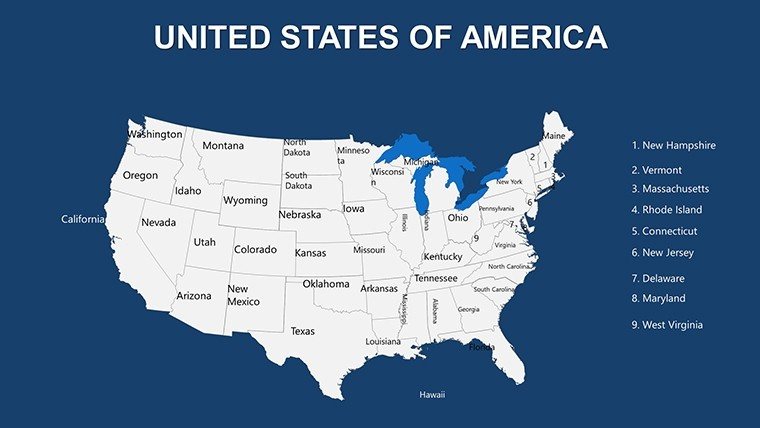
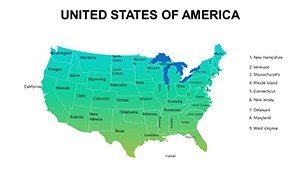
Discover the toolkit that makes this template indispensable. Covering all states, territories, and major cities, the slides include base maps, heatmaps, and overlay options for comprehensive coverage.
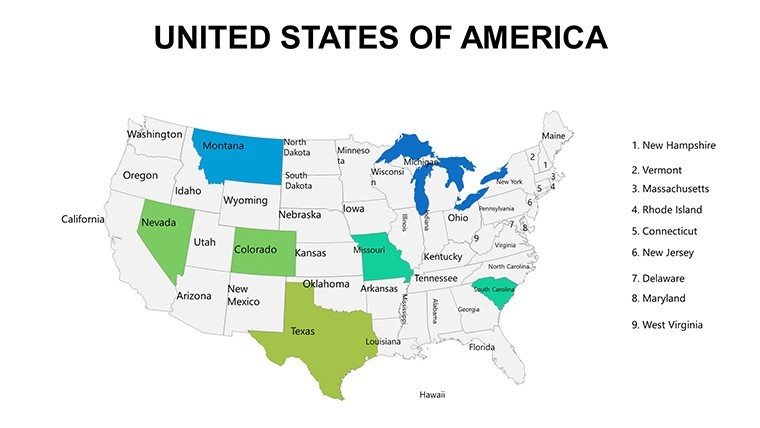
- Full Editability: Tweak fonts, layouts, and elements with drag-and-drop simplicity.
- Visualization Aids: Pre-set charts and markers for quick data integration, like plotting election results.
- Compatibility Assurance: Works flawlessly on projectors, laptops, and prints with scalable graphics.
A consultant at a leading firm utilized these for a regional expansion plan, coloring states by revenue potential to secure multimillion-dollar approvals. Such practical wins underscore its role in high-impact presentations.
Versatile Applications for US-Focused Strategies
Tailor this template to your field for maximum relevance. In business, map sales territories or competitive landscapes, overlaying CRM data for actionable insights. Educators use it for history lessons on westward expansion or geography quizzes, with interactive elements engaging Gen Z learners.
Data analysts visualize trends like migration patterns from Census Bureau stats, while marketers craft campaign maps highlighting media reaches in swing states. A real estate developer example: Customized slides showed property hotspots from Florida to Alaska, streamlining investor meetings and accelerating deals.
- Strategic Planning: Delineate operational zones, syncing with KPIs for boardroom clarity.
- Classroom Dynamics: Animate state formations to make learning memorable and fun.
- Marketing Insights: Illustrate consumer behaviors regionally, informing targeted ads.
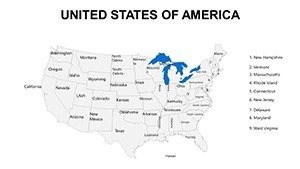
Superior to default PowerPoint maps, which lack depth, ours includes built-in legends and themes for instant polish, saving design iterations.
Step-by-Step Customization Guide
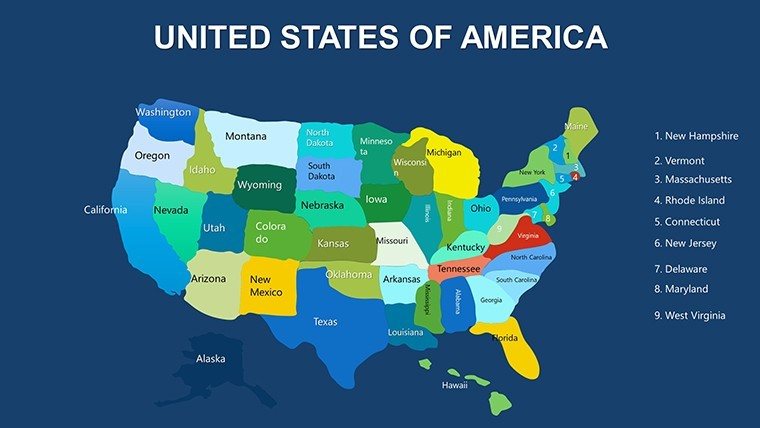
Begin with selecting a slide, then apply colors - vibrant for high-performers like Texas tech scenes. Insert data via Excel links for auto-updates, ensuring accuracy in volatile markets. Add markers for cities, using icons for sectors like agriculture in the Corn Belt.
Follow guidelines from the American Association of Geographers for balanced projections, avoiding skews. Incorporate subtle fades for layered info, guiding eyes logically. This approach, favored in TED-style talks, amplifies persuasion without complexity.
For teams, share via OneDrive for collaborative tweaks, ideal for remote workflows. The template's lightweight file size means quick loads, even on older hardware.
Distinct Advantages Over Competitors
Adhering to US Geological Survey standards, it ensures geographic fidelity, bolstering in professional circles. The included license covers commercial ventures, with updates keeping pace with software evolutions. An academic reviewer highlighted its utility in thesis defenses, where precise state visuals clarified research scopes.
Enhance with related US templates for thematic series, building a robust presentation arsenal. Its no-frills interface democratizes expert-level mapping.
Transform Your Presentations Now
Step up your game with visuals that map success across the nation. Acquire the Editable United States PowerPoint Maps Template today and position your ideas front and center. Edit, visualize, and conquer.
Frequently Asked Questions
Which PowerPoint versions does it support?
Compatible with 2016, 2019, 2021, and Office 365 on all platforms.
Are territories included?
Yes, Puerto Rico, Guam, and others are covered alongside states.
How do I add heatmaps?
Use built-in gradient tools to color-code data intensity easily.
Is printing supported?
High-res designs print sharply up to poster size.
Any tutorials included?
Basic guide provided; advanced tips via our support resources.