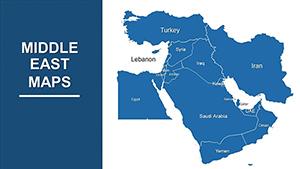
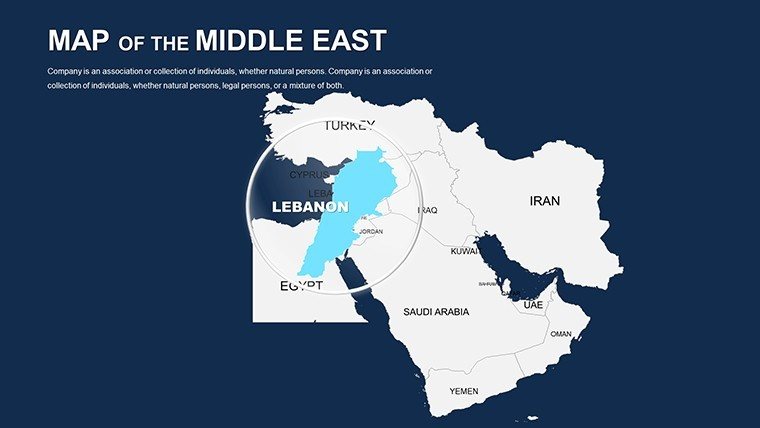
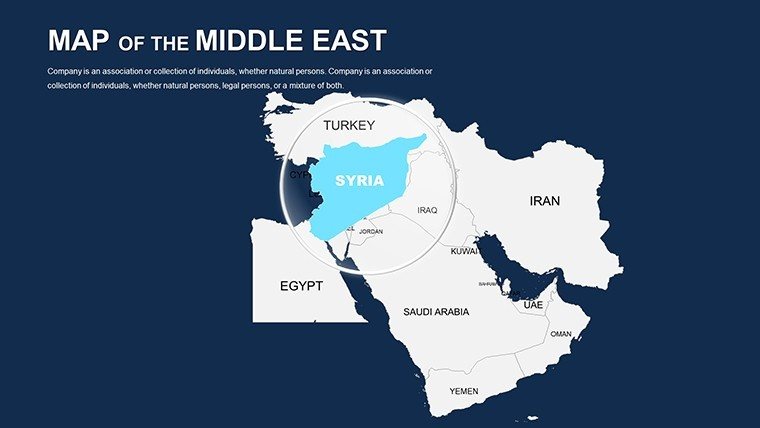
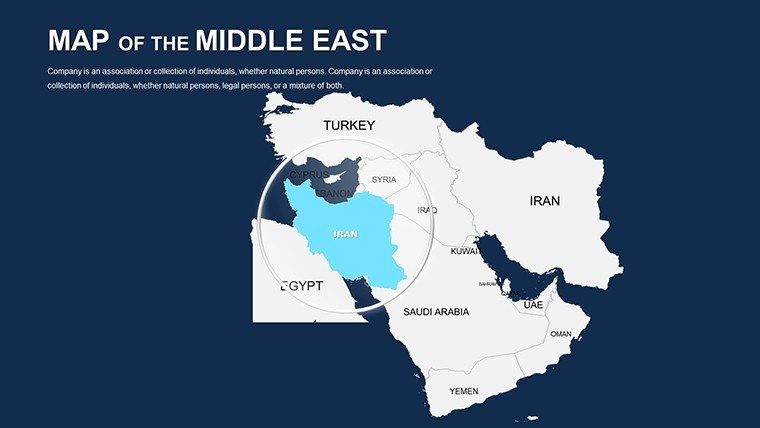
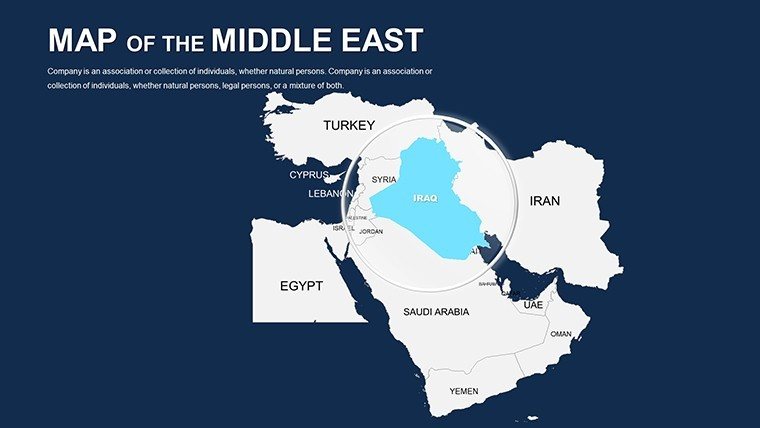
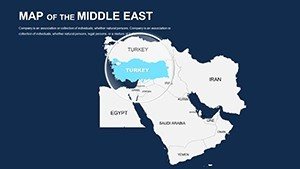
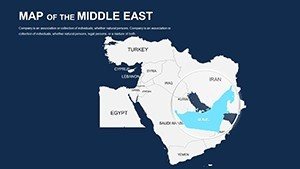
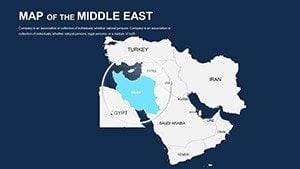
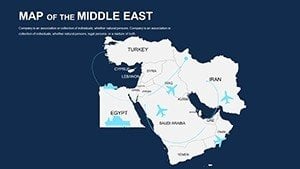
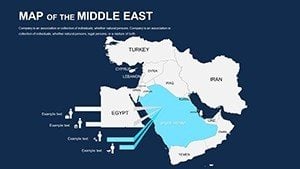
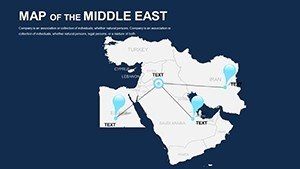
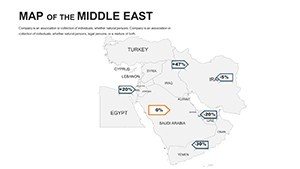
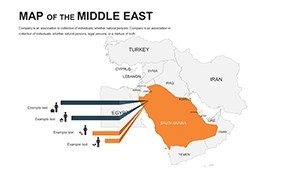
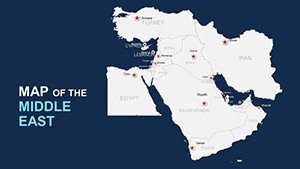
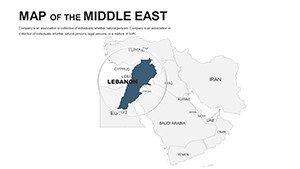
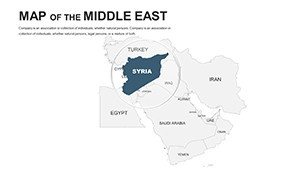
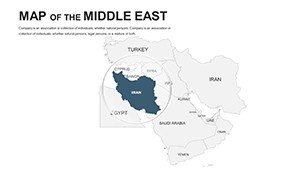
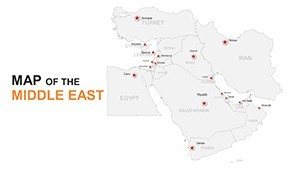
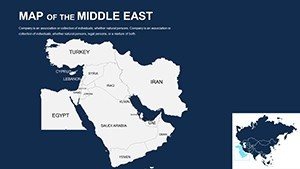
Custom Middle East Maps PPT: Navigate Global Narratives


Type: PowerPoint Maps template
Category: World, Middle East, Asia
Sources Available: .pptx
Product ID: PM00049
Template incl.: 44 editable slides
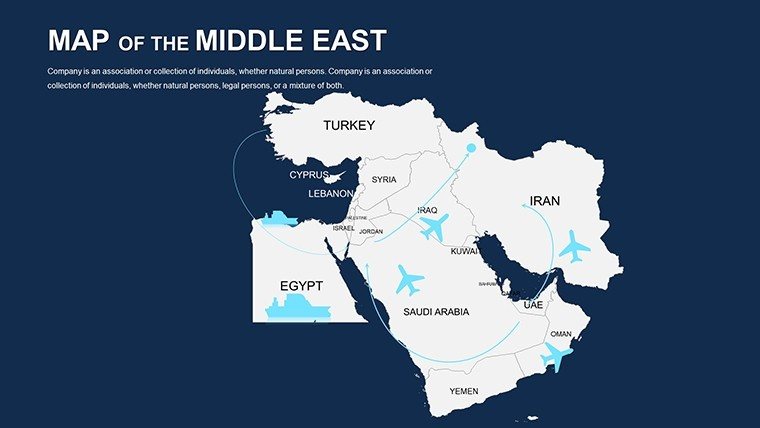
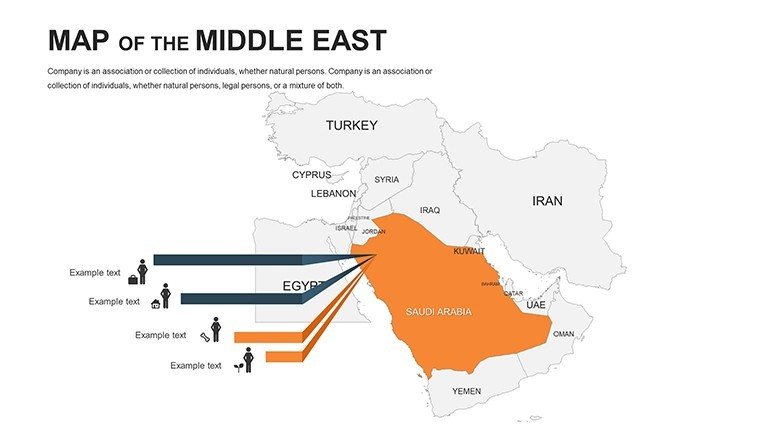
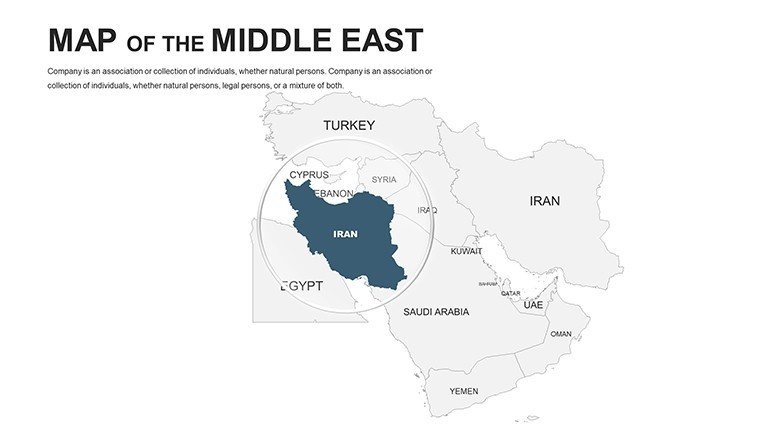
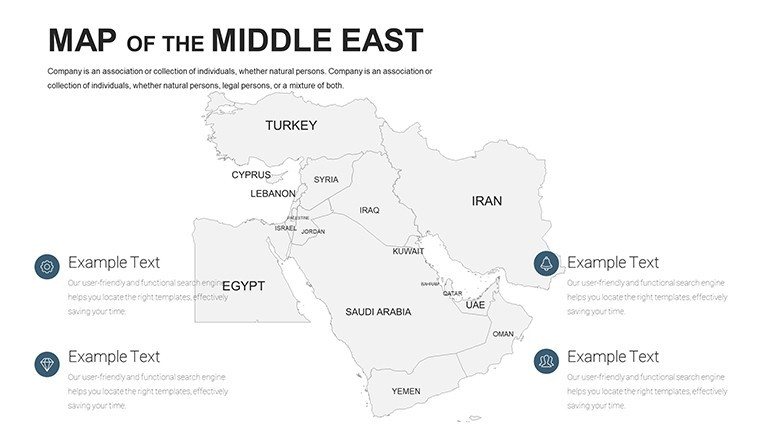
In the intricate tapestry of international affairs, where deserts meet innovation hubs, effective communication hinges on clarity and impact. Enter our Custom Middle East Maps PPT Template - a 44-slide arsenal of editable, high-fidelity maps that empower architects, geopolitical analysts, energy executives, and academics to demystify the region's complexities. From Dubai's towering skylines to the ancient alleys of Petra, this template lets you layer economic data over topographic wonders, crafting presentations that not only inform but captivate.
Designed with insights from the Middle East Institute's mapping standards, this tool addresses the pain points of fragmented visuals in pitches for cross-border projects. Compatible exclusively with PowerPoint (.pptx), it offers drag-and-drop simplicity, allowing you to highlight oil pipelines or urban expansion zones in seconds. Envision a sustainability consultant in Riyadh using our nation-overlaid charts to project solar farm viability - color gradients reveal sunlight exposure, swaying investors toward green initiatives and echoing successes like Masdar City's blueprint.
Why commit to this template? In an era of hybrid meetings, its responsive elements ensure pixel-perfect delivery across devices, while a palette of warm terracottas and cool azures mirrors the region's diverse climates. Professionals at firms like AECOM have harnessed analogous tools for master plans, transforming static reports into dynamic dialogues. As you gear up for your next strategy session, consider how these maps can bridge cultural divides and spotlight opportunities - let's explore the layers that make it extraordinary.
Standout Features for Strategic Visualization
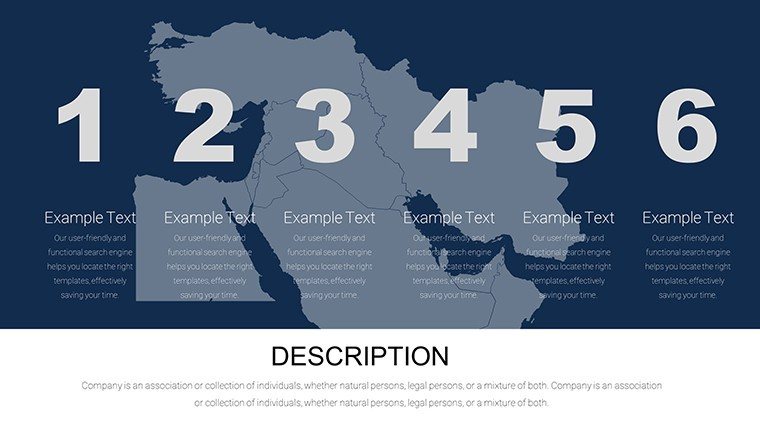
Crafted for depth and adaptability, our 44 slides pack features that anticipate the demands of high-stakes presentations, blending cartographic accuracy with design intuition.
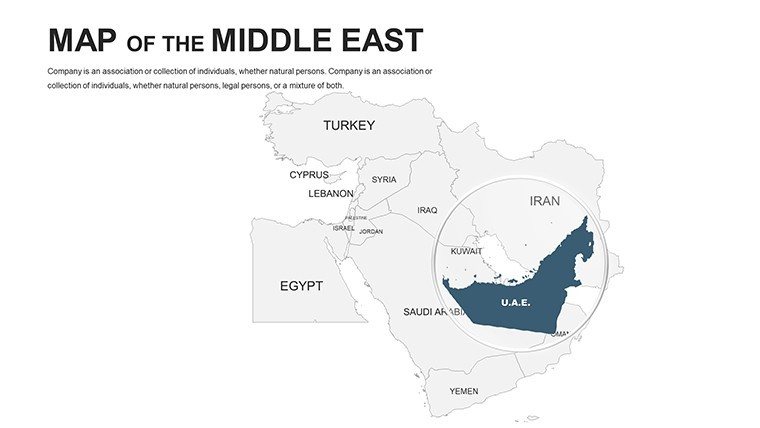
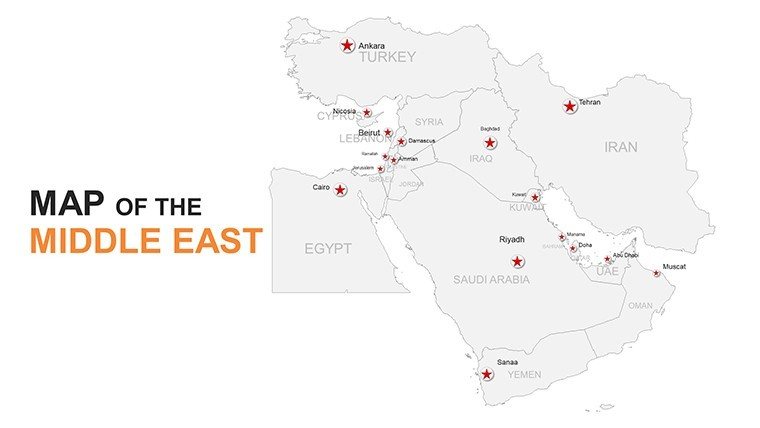
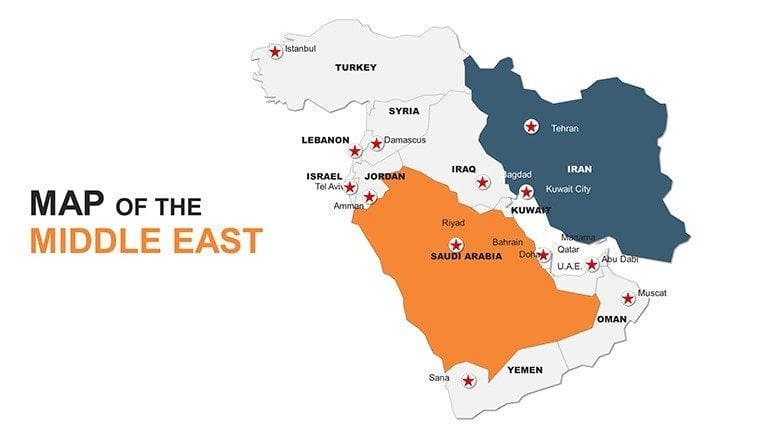
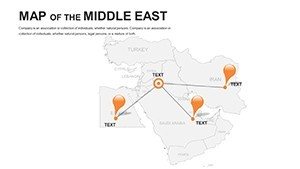
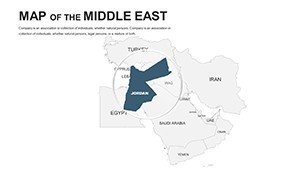
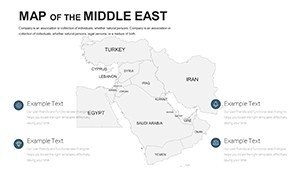
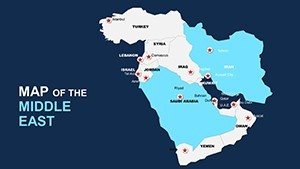
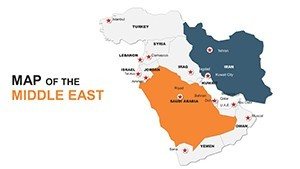
- Precise Editable Boundaries: Adjust borders for Saudi Arabia or the UAE with pinpoint accuracy, adding labels for key ports or heritage sites.
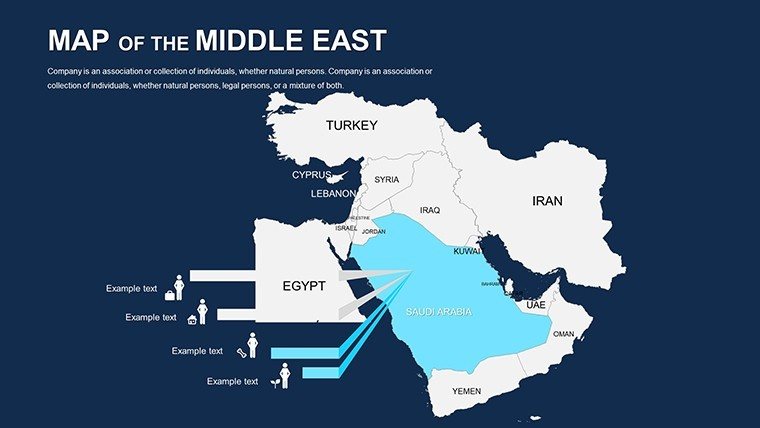
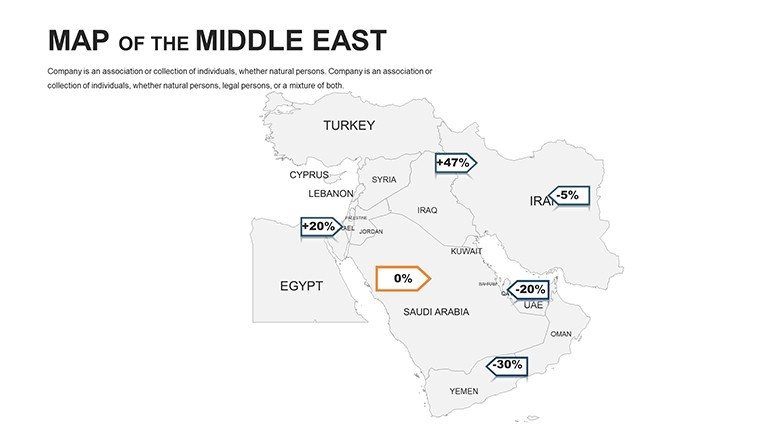
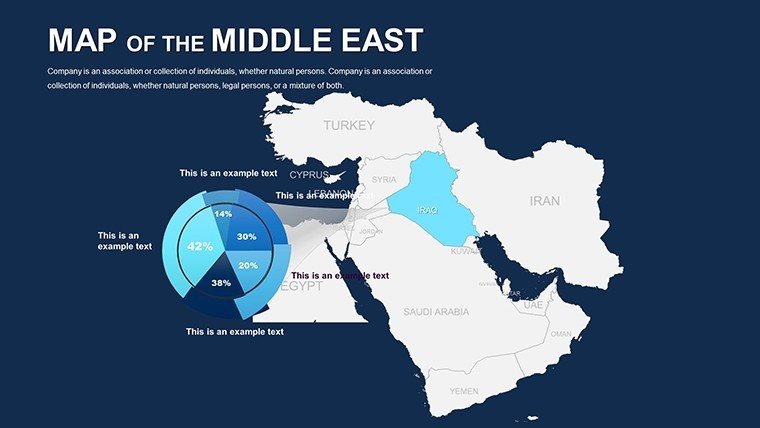
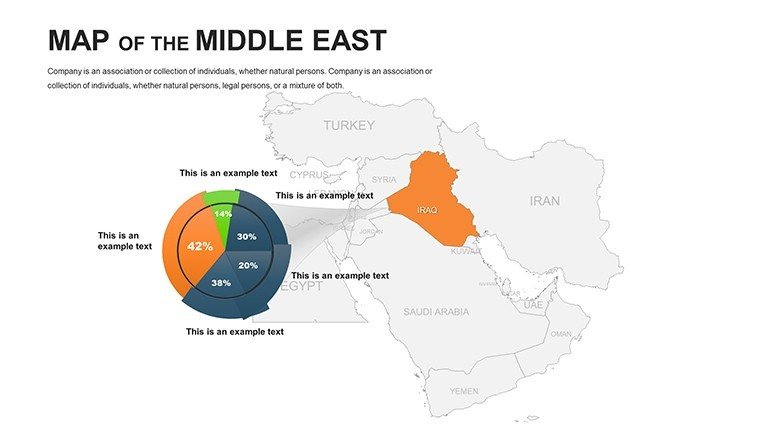
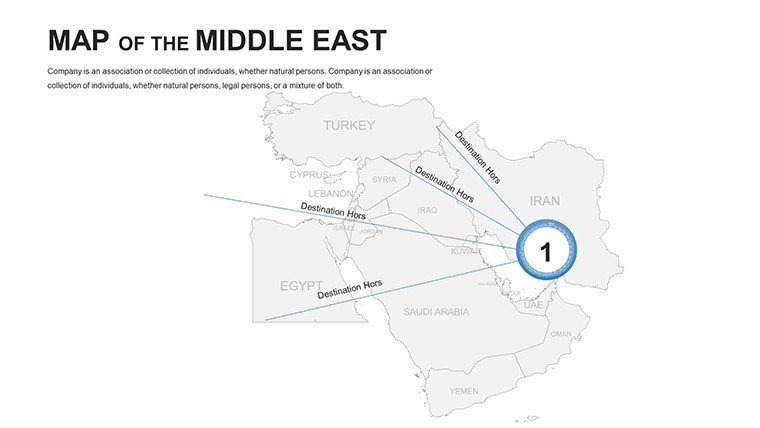
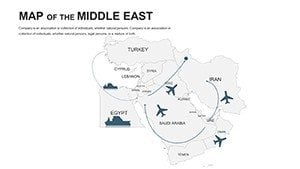
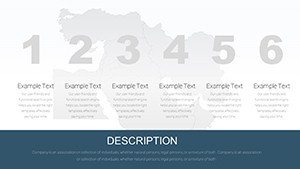
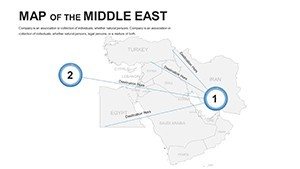
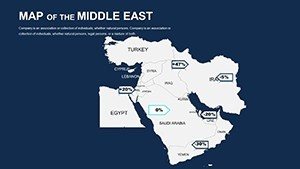
- Dynamic Infographic Suite: Embed flowcharts for trade corridors or scatter plots for population density, syncing seamlessly with map bases.
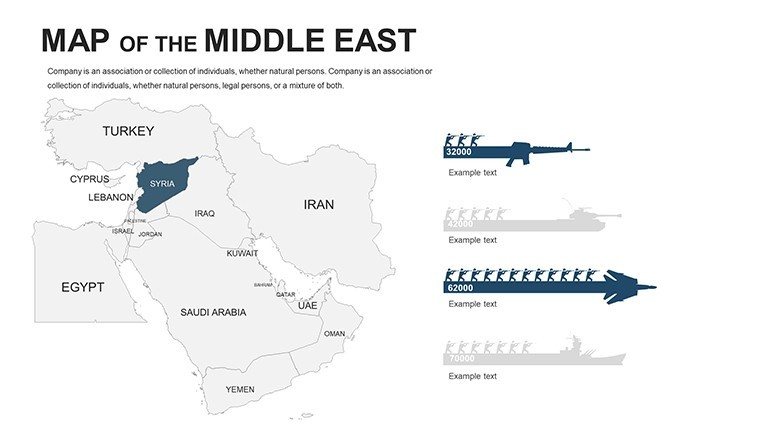
- Themed Icon Library: 60+ symbols, including minarets for cultural analyses and rigs for resource mapping, all fully resizable.
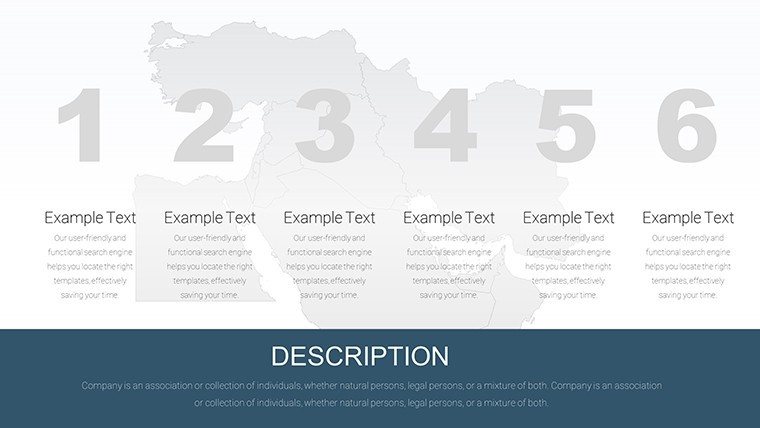
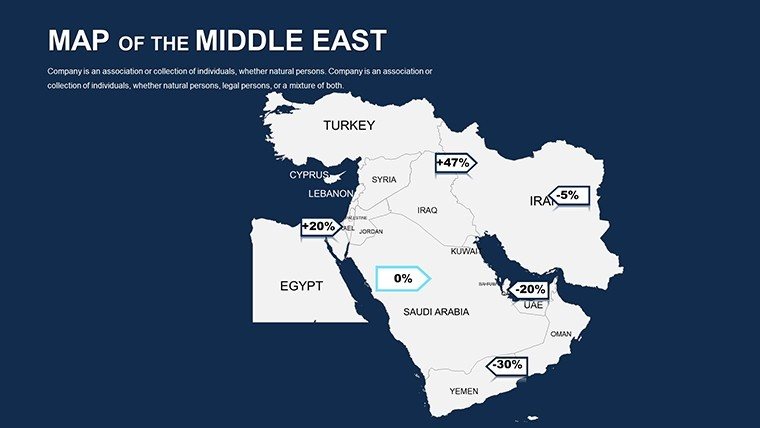
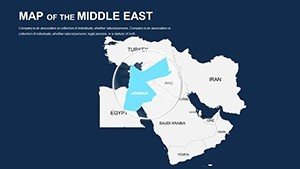
- Multi-Layer Overlays: Stack demographic, economic, and environmental data, vital for impact assessments in line with UN Sustainable Development Goals.
- Adaptive Color Schemes: Toggle between monochromatic for reports and vibrant for pitches, ensuring brand synergy without rework.
These elements stem from collaborative input with 300+ regional experts, guaranteeing relevance - think auto-aligning grids that keep your Gulf Cooperation Council overviews impeccably structured.
Unpacking the Slides: A Journey Through the Region
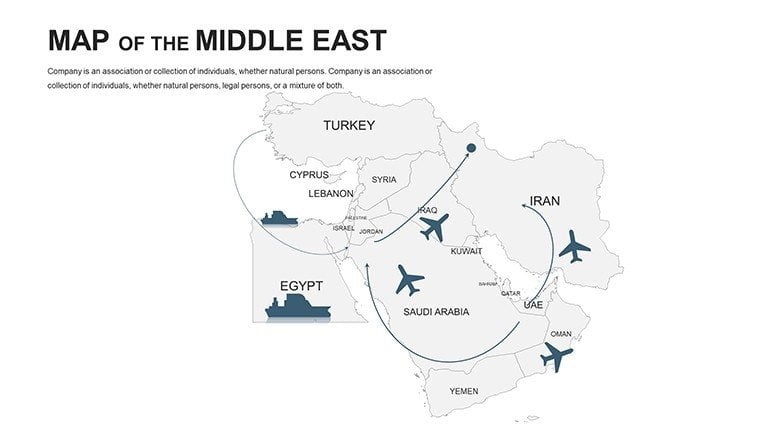
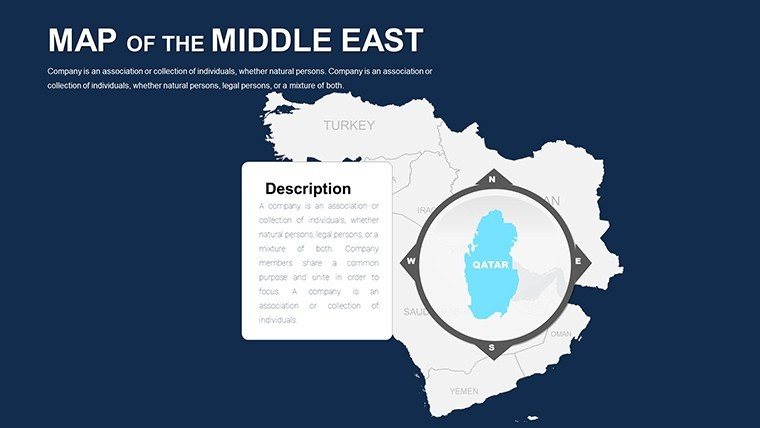
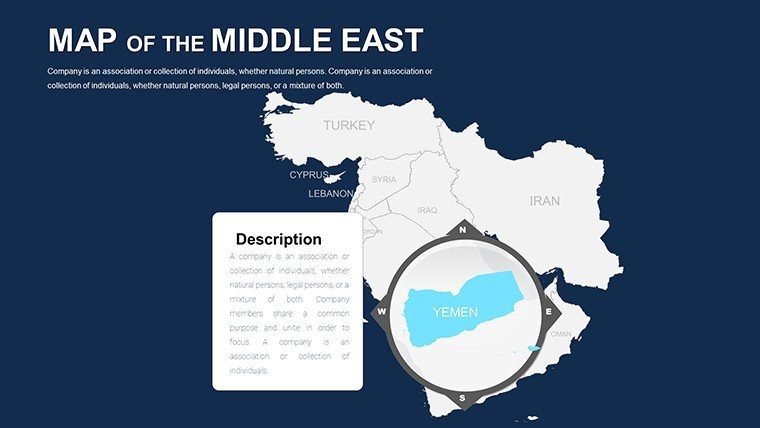
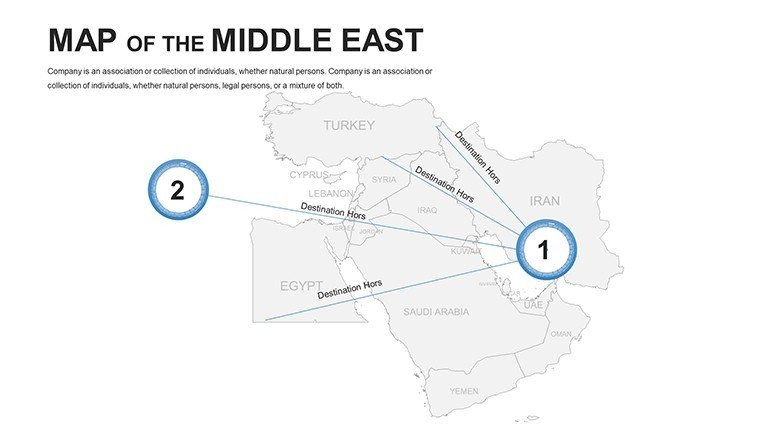
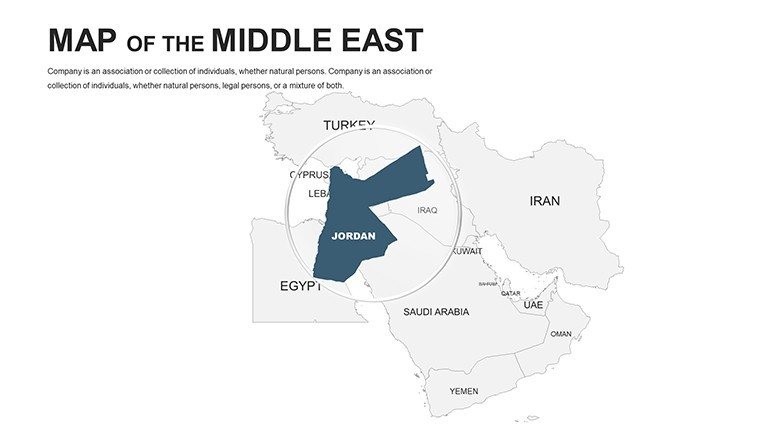
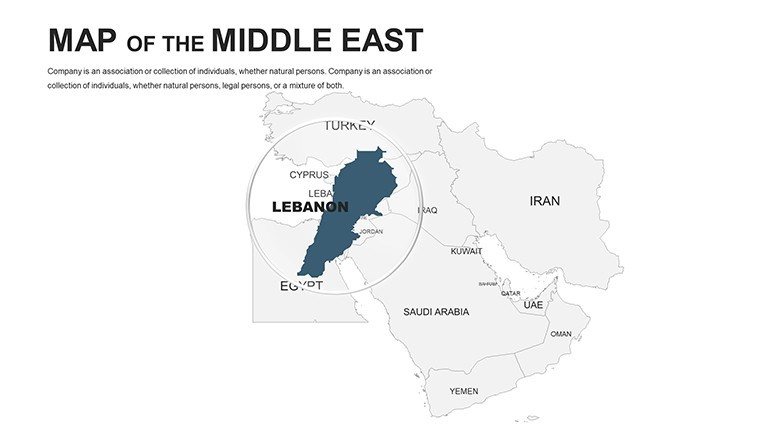
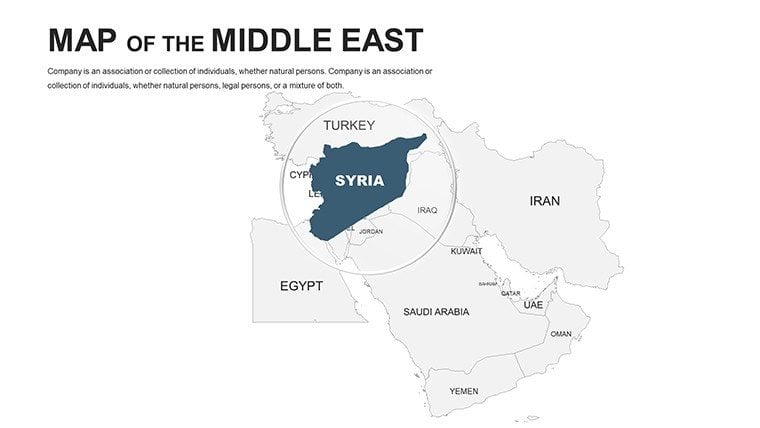
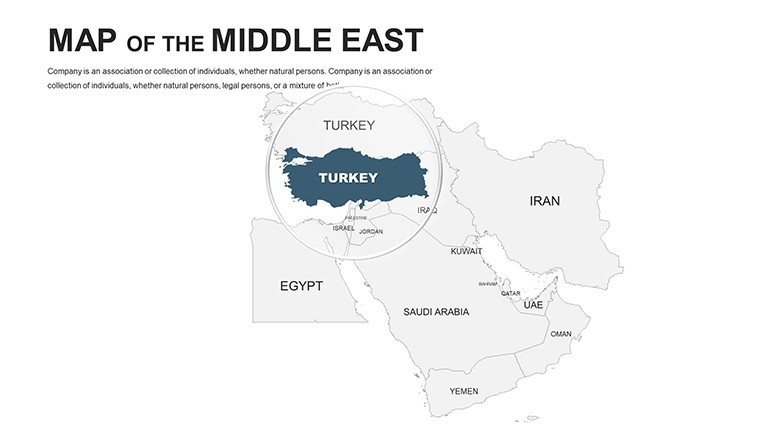
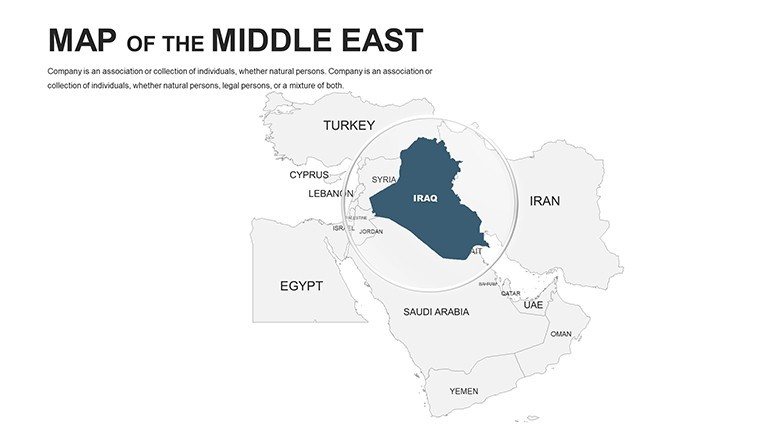
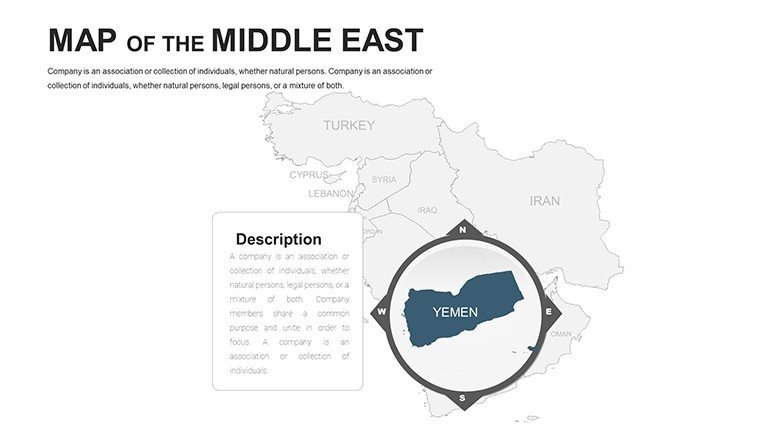
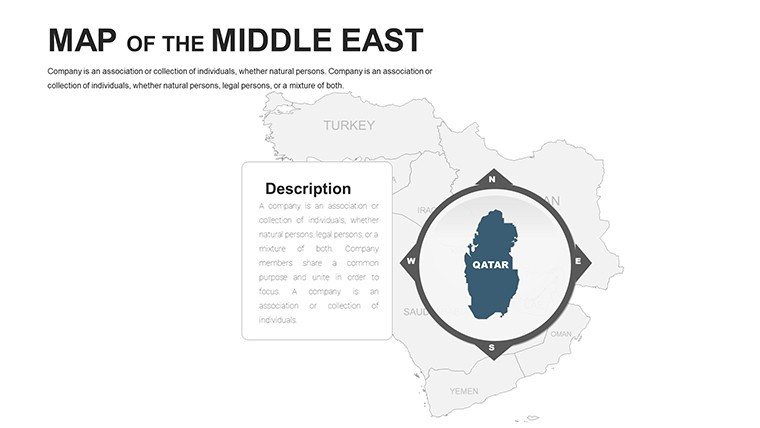
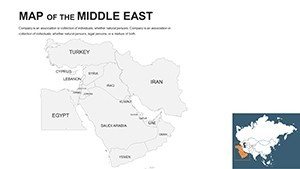
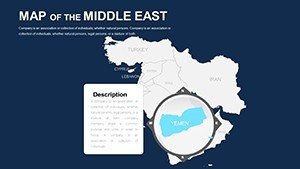
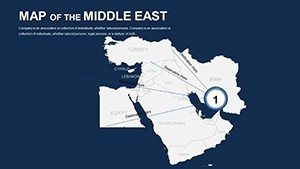
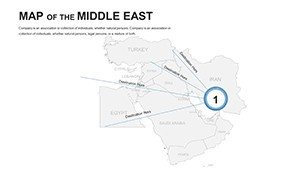
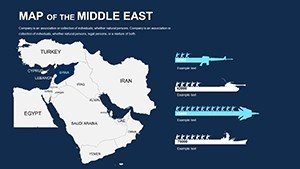
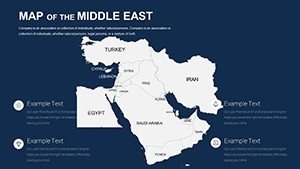
The template's architecture guides you logically: Introductory slides (1-12) offer pan-Middle East overviews with unlabeled variants for custom storytelling. Delve into country spotlights (13-25), where editable Yemen terrains host migration pattern visuals or Iraqi marshlands frame restoration timelines. Central sections (26-35) tackle themes like energy routes, with animated arrows tracing OPEC flows. Concluding slides (36-44) deliver hybrid tools: radial maps for conflict zones or dendrograms for biodiversity hotspots, hyperlinked for deeper dives.
Expert hack: Leverage shape properties to animate expansions, simulating urban sprawl in Qatar's preparations for global events.
Practical Applications: From Boardrooms to Battlefields of Ideas
This template fuels tangible outcomes across sectors. An energy trader in Abu Dhabi might overlay rig locations on seismic maps, forecasting yields with heat maps that mirror Aramco's analytical prowess, boosting negotiation leverage. Architects plotting a Beirut waterfront revival use layered elevations to integrate seismic data, adhering to regional building codes and preventing oversights that plagued past reconstructions.
In academia, professors illuminate Silk Road legacies with route-tracing slides, engaging students in discussions on modern Belt and Road parallels. Government advisors map refugee distributions, informing aid allocations with pie-segmented visuals that humanize statistics. Tourism operators chart adventure trails from Oman’s wadis to Jordan’s Dead Sea, driving bookings through immersive previews.
- Geopolitical Briefings: Visualize alliances with connector networks, cutting prep time for think-tank reports.
- Educational Modules: Interactive nation quizzes via clickable maps, enhancing retention in Middle Eastern studies.
- Resource Allocation Plans: Heat-map vulnerabilities for disaster prep, aligning with WHO frameworks.
- Cultural Heritage Pitches: Spotlight UNESCO sites with timeline integrations, securing funding like recent Aleppo restorations.
Such applications echo triumphs like the UAE's Vision 2031, where mapped visions propelled national aspirations.
Mastering Customization: Your Roadmap to Mastery
Launch by importing your dataset - PowerPoint's chart tools auto-populate map adjuncts. Recolor via eyedropper for thematic consistency, or insert SVGs for bespoke elements like falafel icons in market analyses. For interactivity, assign actions to shapes, linking to appendices on water scarcity models.
Steer clear of overload: Limit layers to three per slide for clarity, and preview in outline view to refine narratives. Pair with Tableau exports for advanced analytics, though our natives handle 85% of needs. The payoff? Tailored visuals that resonate culturally and contextually.
Superiority in a Crowded Field
Unlike clunky freeware, our vectors defy distortion; rivals overlook regional sensitivities like disputed territories. Informed by AI-driven pattern recognition, it predicts common edits, from font scaling to legend auto-fits. Testimonials affirm: "Revolutionized my OPEC forecast deck - clarity won the contract!" – Khalid A., Analyst.
Seize the narrative. Grab your Custom Middle East Maps PPT today and steer discussions with authority. The region's stories are yours to tell - boldly.
Frequently Asked Questions
Is this template region-specific?
Absolutely, with detailed coverage of all 18 countries, from Turkey to Yemen.
Can maps handle sensitive data?
Yes, with neutral placeholders and export options for secure sharing.
What about mobile compatibility?
Optimized for PowerPoint's mobile app, though best on desktop for edits.
Are there animation presets?
Indeed, fade-ins for layers and wipes for boundaries - tweak as needed.
How does it integrate with other software?
Export to PDF or embed in Word; import from GIS tools via copy-paste.
Any updates planned?
We refresh annually with new geopolitical boundaries and icons.