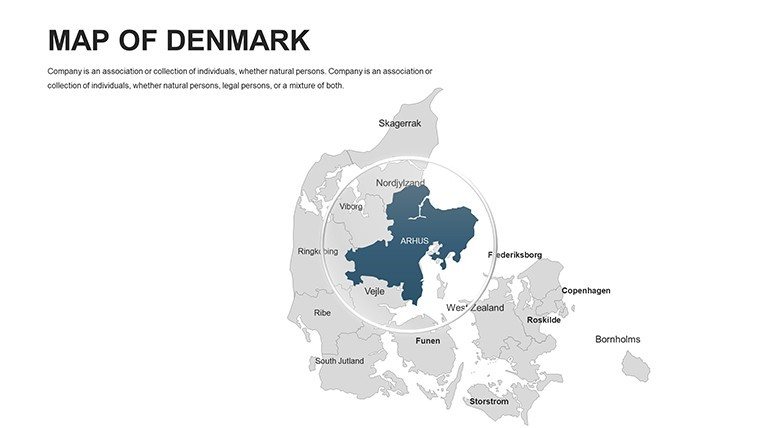
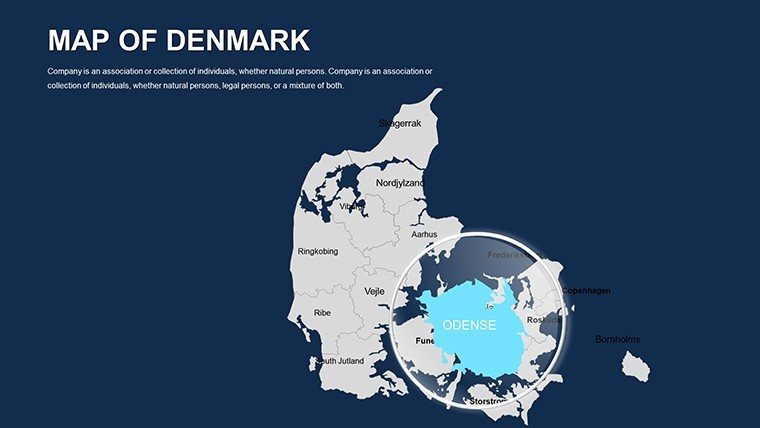
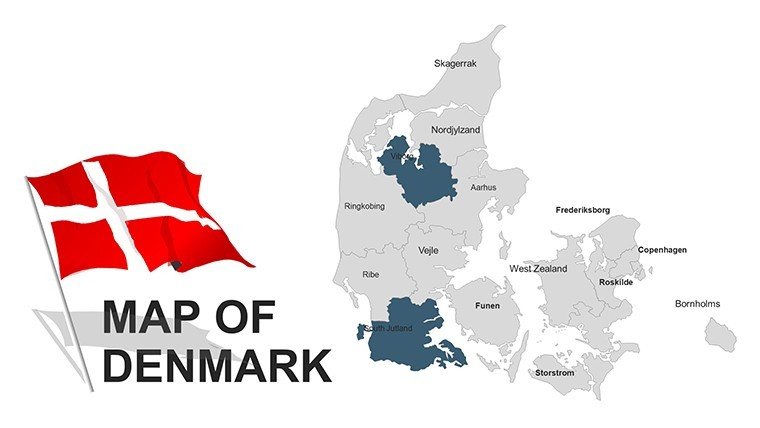
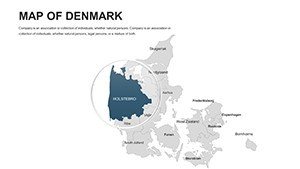
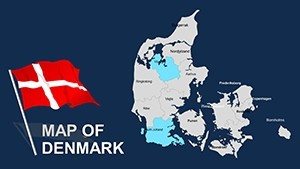
Editable Denmark PowerPoint Maps: Precision Mapping for Nordic Narratives


Type: PowerPoint Maps template
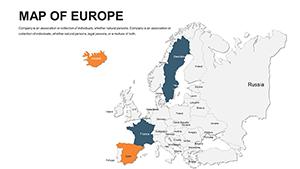
Category: Europe
Sources Available: .ppt, .pptx
Product ID: PM00035
Template incl.: 44 editable slides
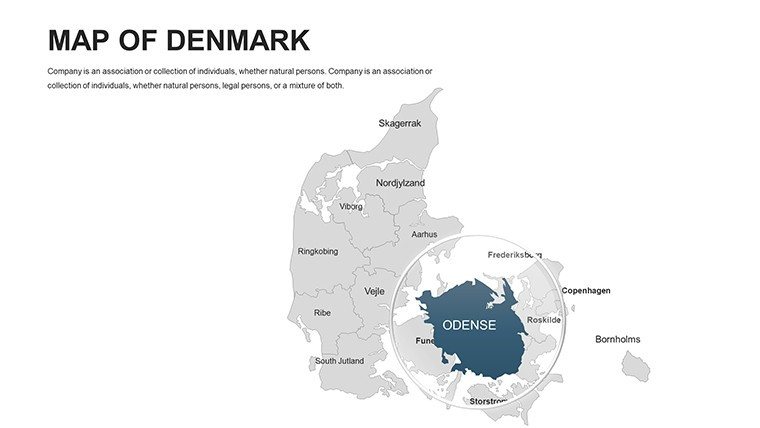
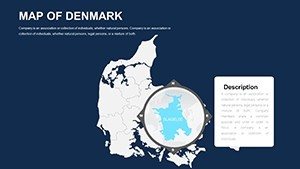
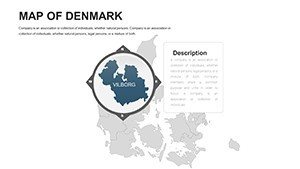
Denmark's compact yet influential geography offers endless opportunities for insightful presentations, from sustainable city planning in Copenhagen to historical overviews of Viking routes. Our Editable Denmark PowerPoint Maps template captures this essence with 44 editable slides, empowering architects, policymakers, and historians to craft visuals that resonate. This tool is more than maps - it's a gateway to clearer communication, helping you spotlight regional developments or cultural landmarks with professional polish.
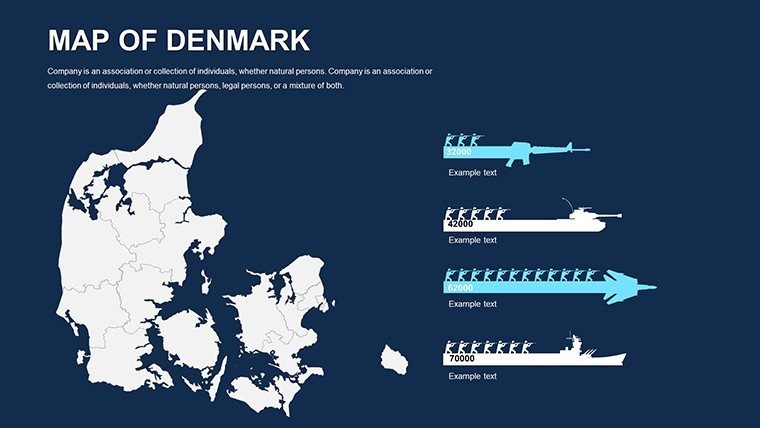
Built for those who value detail, the template features outline, filled, and color-coded variants, all vector-sharp for flawless scaling. In an era where urban density and green initiatives dominate discussions, these maps let you layer data like wind farm locations or population flows effortlessly in PowerPoint. For professionals navigating EU-funded projects, it's a time-saver that aligns visuals with strategic goals, ensuring your slides don't just show Denmark but tell its story compellingly.
Discover the Core Features Driving Danish Map Excellence
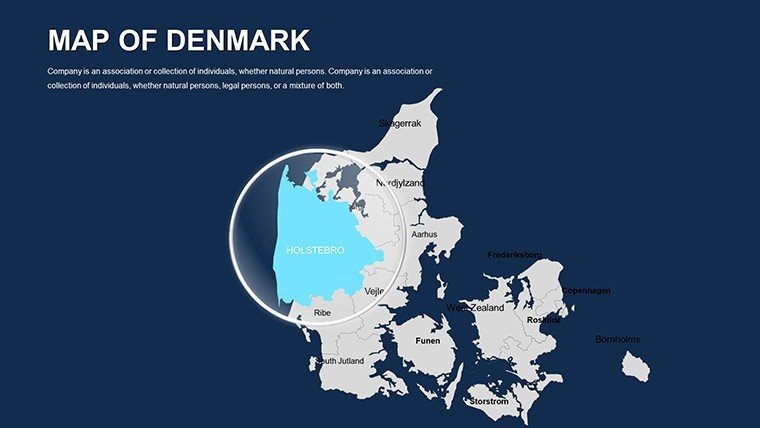
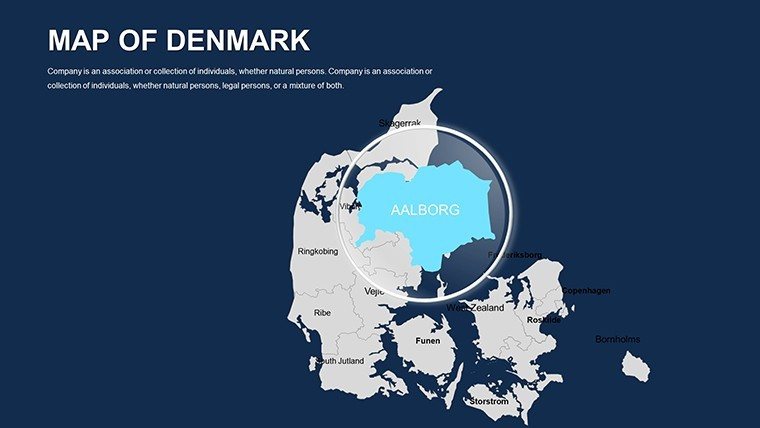
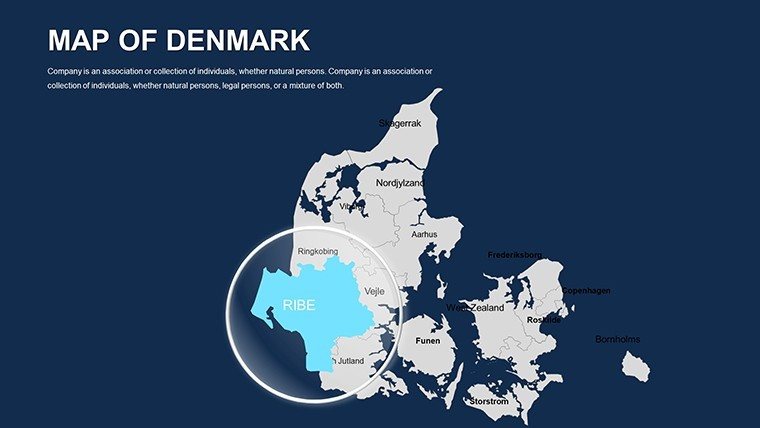
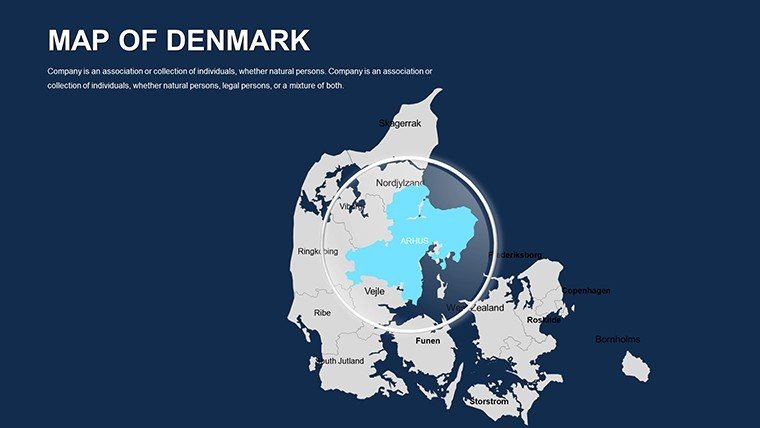
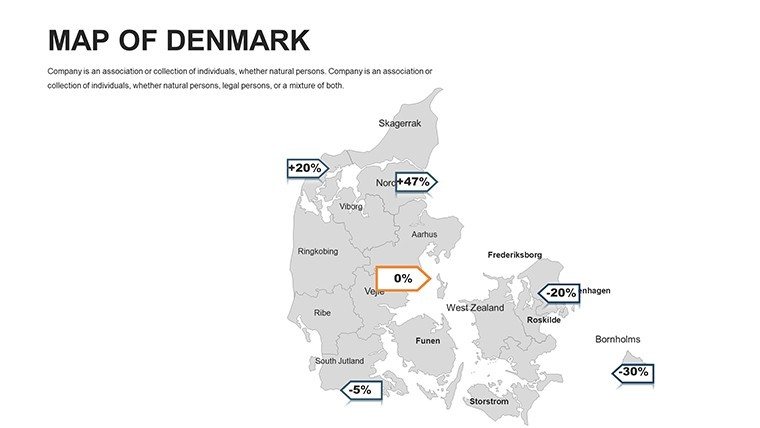
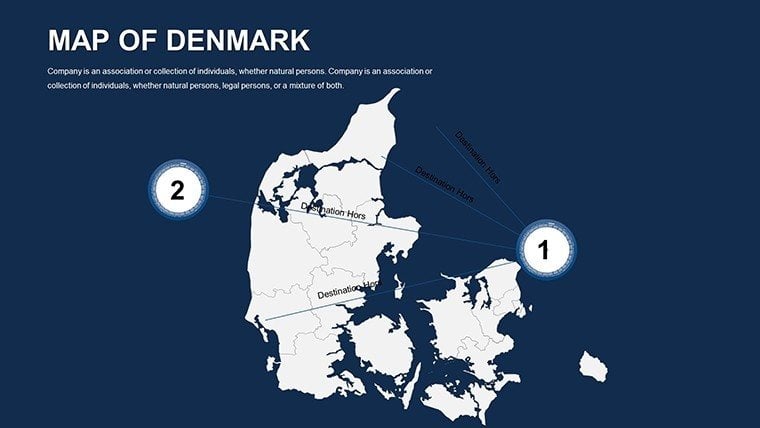
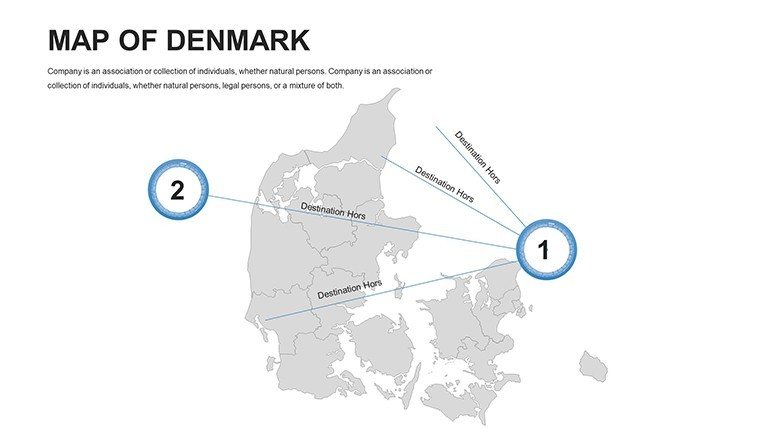
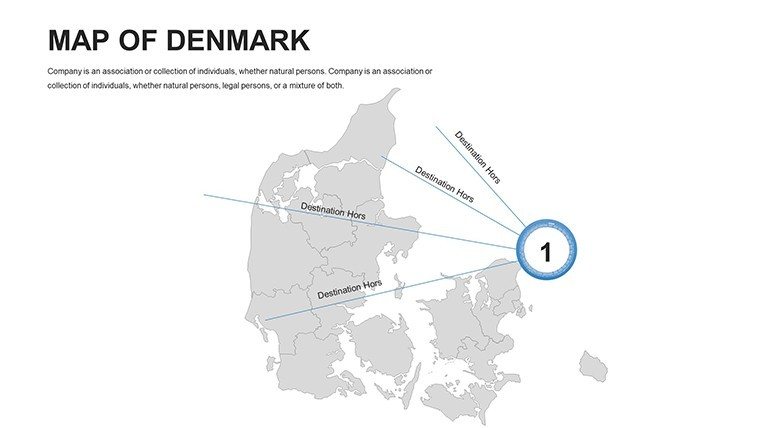
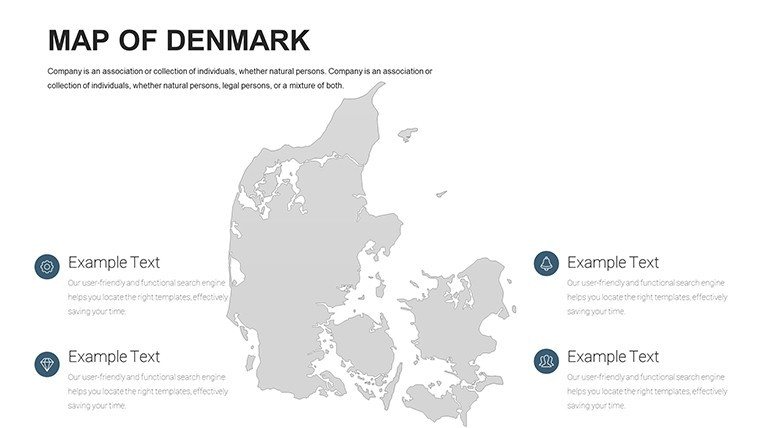
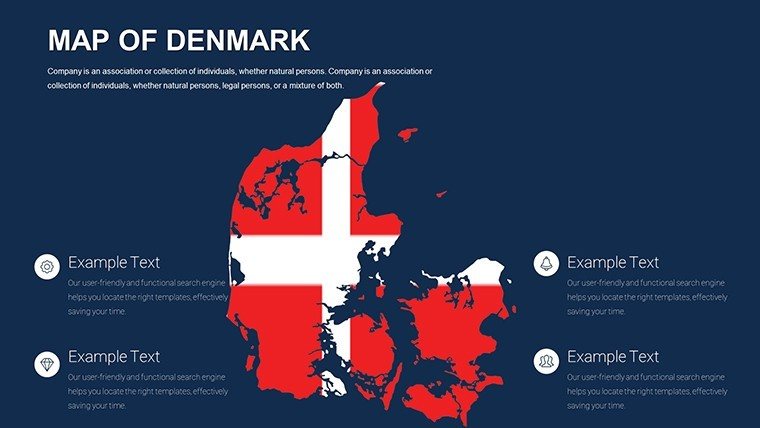
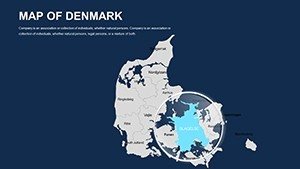
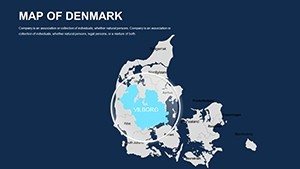
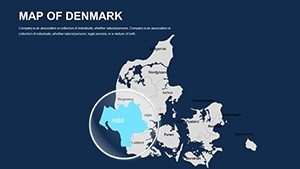
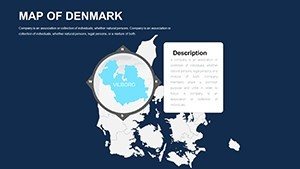
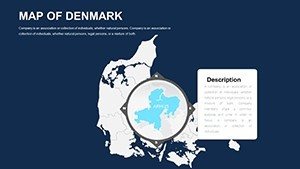
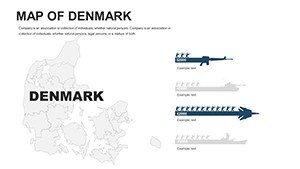
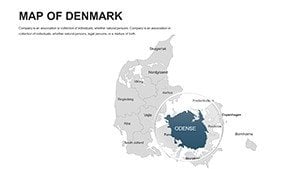
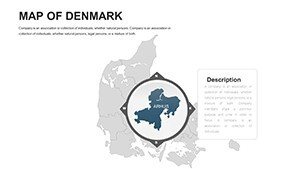
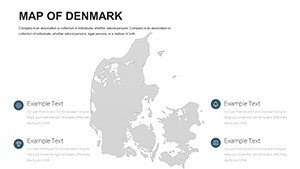
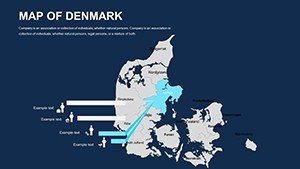
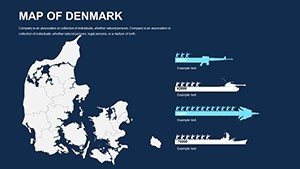
At the heart of this template is a commitment to usability and impact. Varied Map Styles provide options for every need: Outlines for clean bases, filled maps for thematic emphasis, and color-codes for data-driven insights.
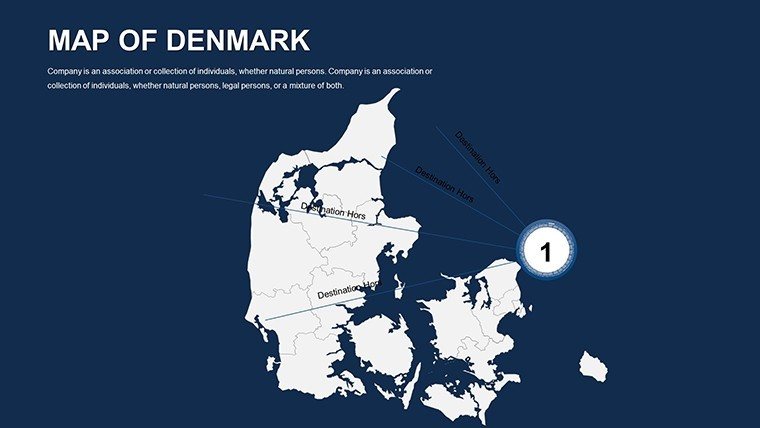
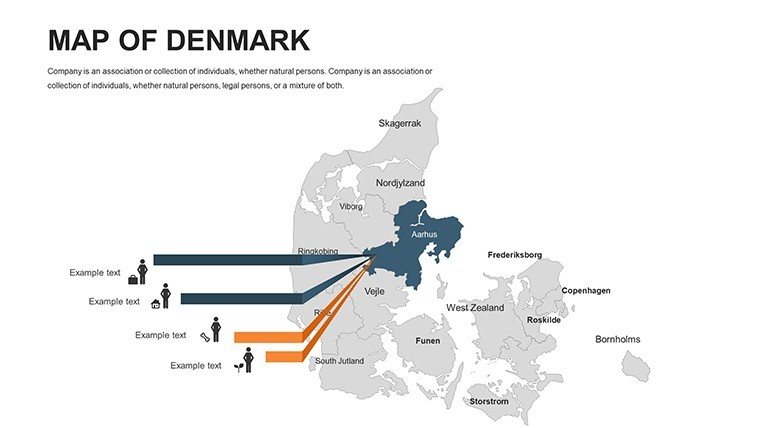
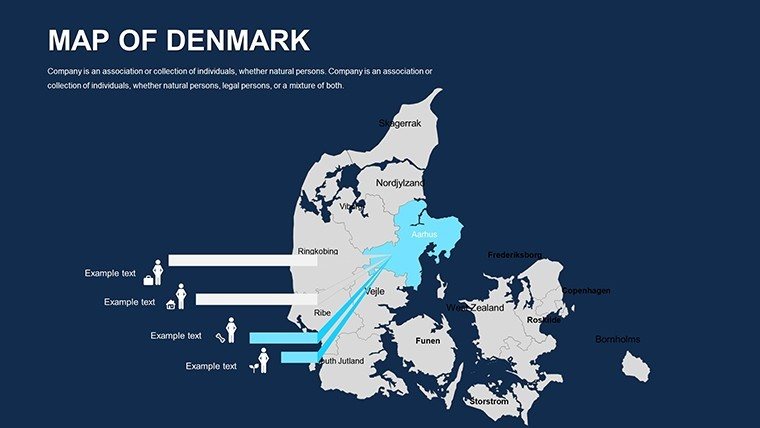
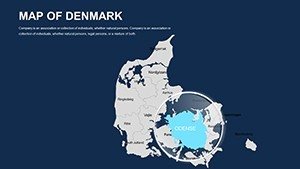
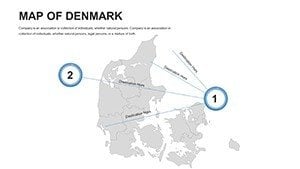
- Intuitive Editing: Modify colors to denote zoning laws or add labels for cities like Aarhus, all without external tools.
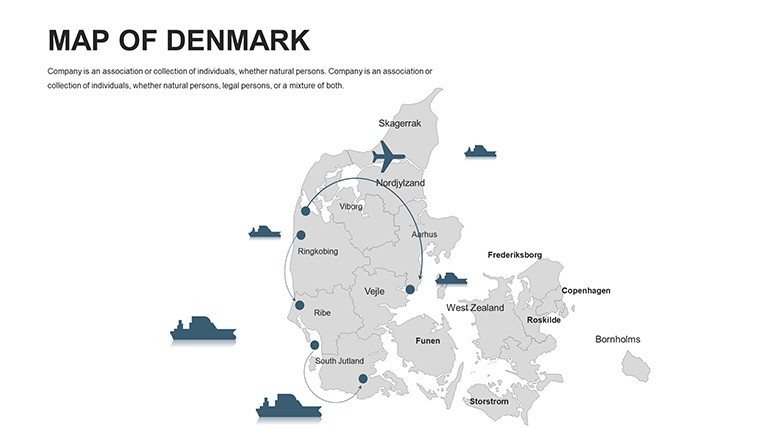
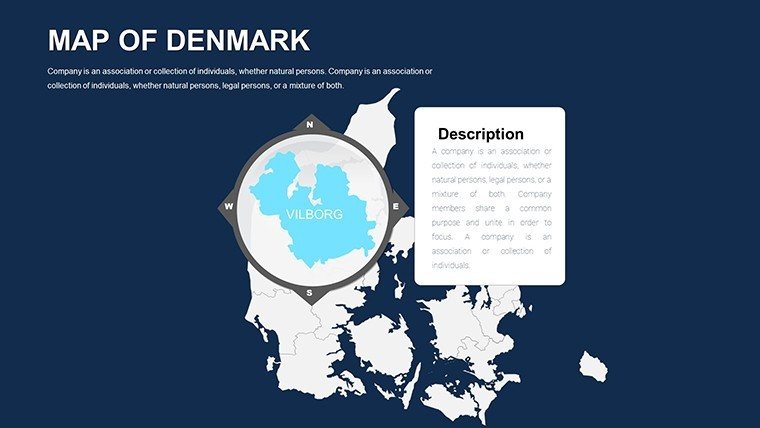
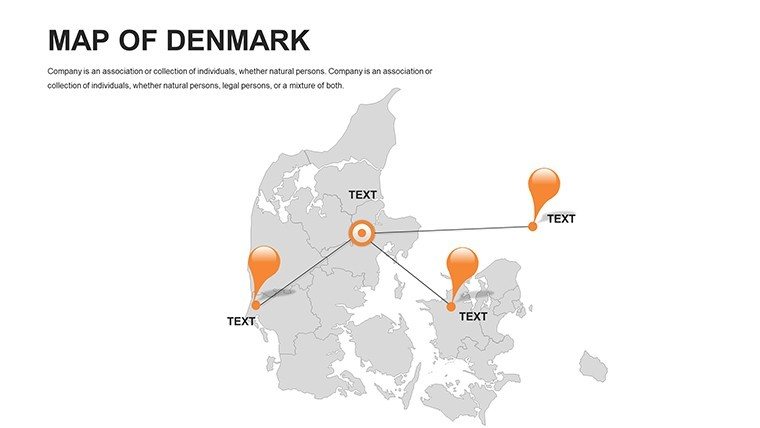
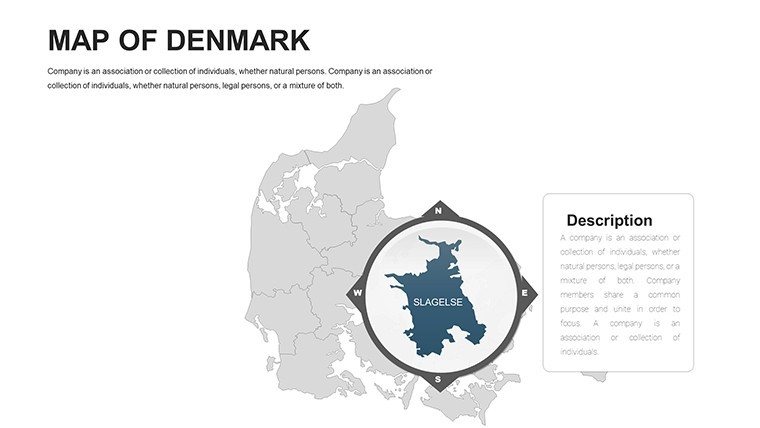
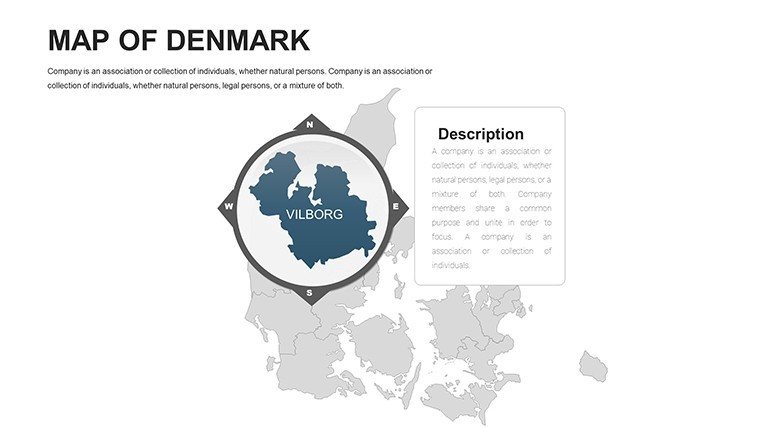
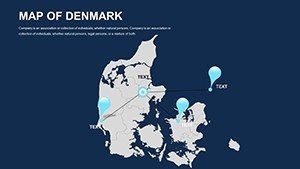
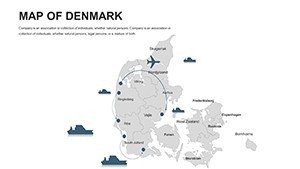
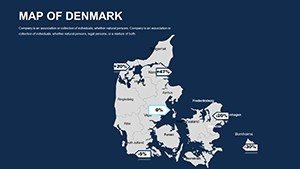
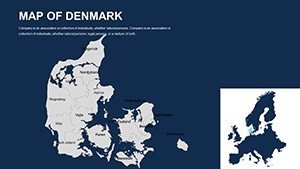
- Detail-Oriented Graphics: Includes landmarks, regions, and coastlines with high clarity, vital for zoomed analyses.
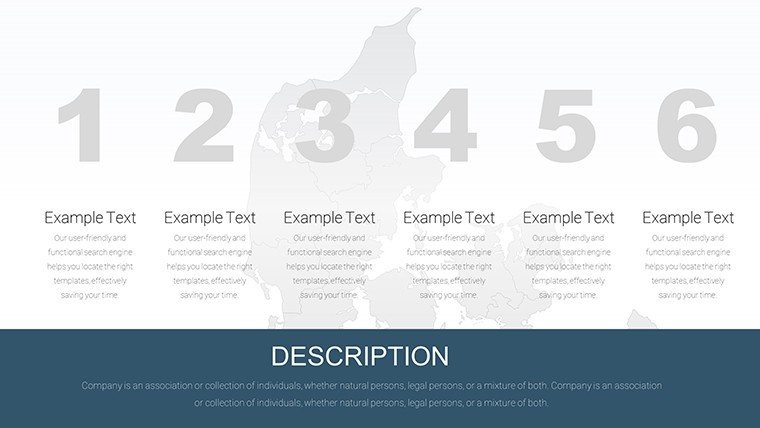
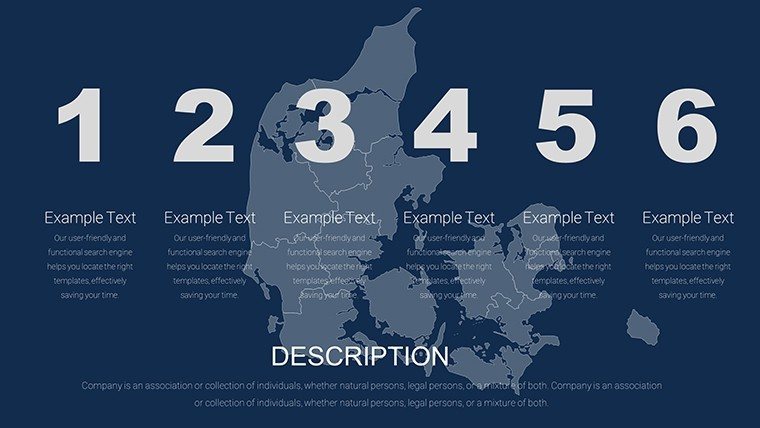
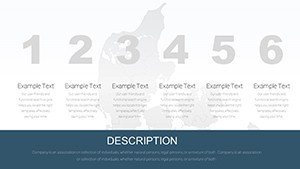
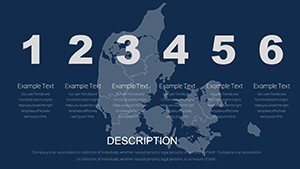
- Broad Applicability: Suited for 44 slides covering everything from national overviews to local boroughs.
- Format Versatility: .ppt and .pptx files ensure broad compatibility across devices.
Expert tip: In architecture firms, such maps have streamlined client approvals by visualizing site integrations, as seen in projects adhering to Danish building standards. This template brings that level of sophistication to your fingertips.
Tailored Use Cases: Denmark in Focus
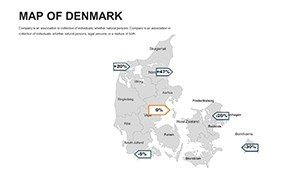
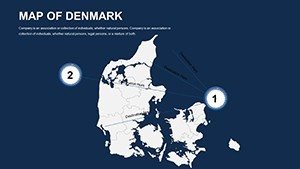
Unlock potential in urban planning sessions. Use slide 18's filled map to color-code development zones, overlaying transport links to demonstrate connectivity. This has proven effective in council meetings, enhancing proposal acceptance rates.
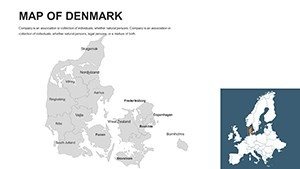
For educators, the outline maps on slides 8-12 facilitate geography drills. Customize to trace Denmark's bridges or islands, sparking discussions on environmental resilience - echoing curricula from Scandinavian educational bodies.
Step-by-Step: Crafting a Sustainability Report Slide
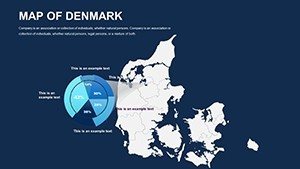
- Choose Style: Opt for a color-coded base from slide 22 for eco-zones.
- Input Metrics: Add renewable energy stats, using shades of green for progress levels.
- Highlight Areas: Label key sites like the Øresund Bridge with impact notes.
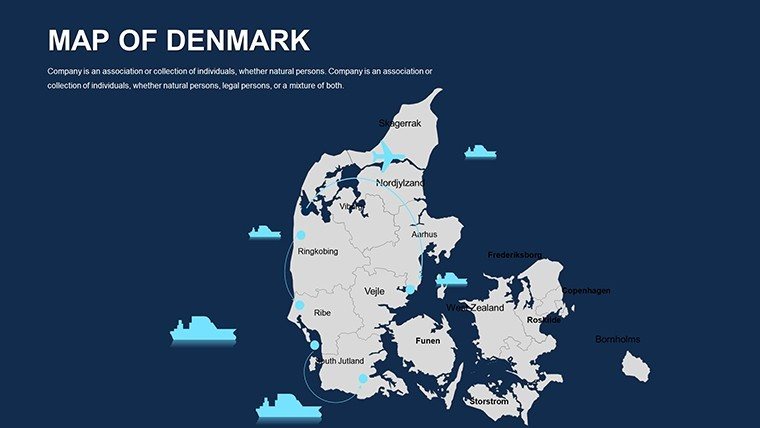
- Integrate Visuals: Embed icons for solar or wind, scaling to fit.
- Refine Output: Apply subtle fades to reveal layers, maintaining narrative flow.
Tourism operators benefit from landmark-focused slides 30-40. Map heritage trails, adding itineraries to engage potential visitors. Visual storytelling here mirrors successful campaigns by VisitDenmark, driving interest through vivid depictions.
Elevating Beyond Standard Templates
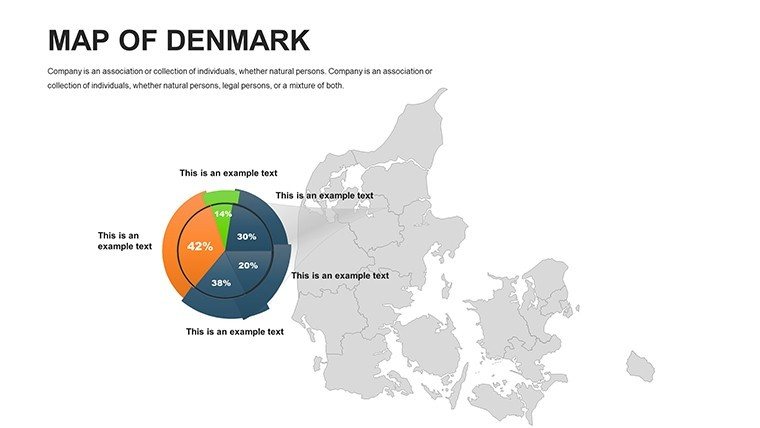
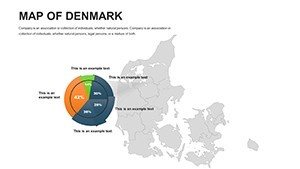
Unlike generic Denmark sketches, our maps boast accuracy from verified sources, minimizing revisions. Incorporate LSI like "regional infographics" by adding custom graphs, enriching your content naturally.
Workflow hack: Link slides to external datasets for live updates, a pro move for dynamic reports. This ensures your presentations stay current, impressing with relevance.
Embrace Denmark's design legacy in your work. Get the Editable Denmark PowerPoint Maps now and map a path to standout success.
Frequently Asked Questions
Are the Denmark maps vector-based for scaling?
Yes, all elements are vectors, allowing infinite scaling without quality loss.
What types of maps are included?
Outline, filled, and color-coded options for versatile geographical representation.
Can I add my own data layers?
Definitely - PowerPoint tools support easy integration of charts and text overlays.
Is the template suitable for academic use?
Absolutely, with accurate details ideal for lectures and research visuals.
How do I handle multiple regions in one slide?
Use grouping features to manage and edit regions independently.