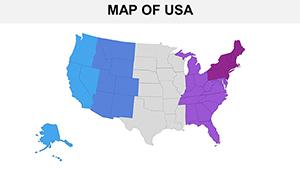
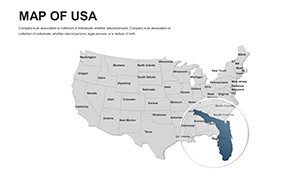
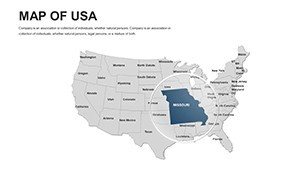
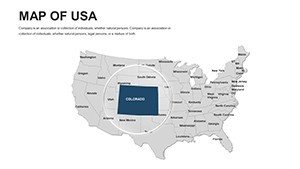
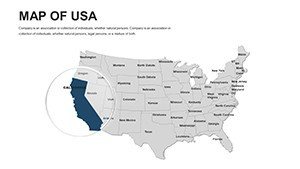
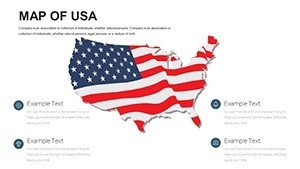
US Map PowerPoint Template - State-by-State Customization


Type: PowerPoint Maps template
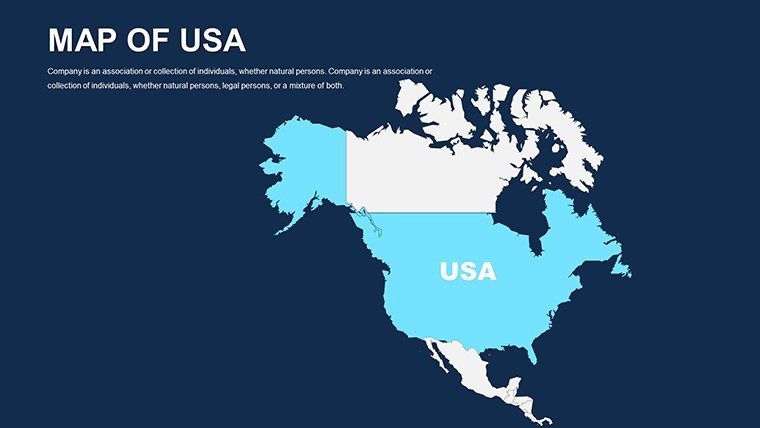
Category: North America
Sources Available: .pptx
Product ID: PM00031
Template incl.: 46 editable slides
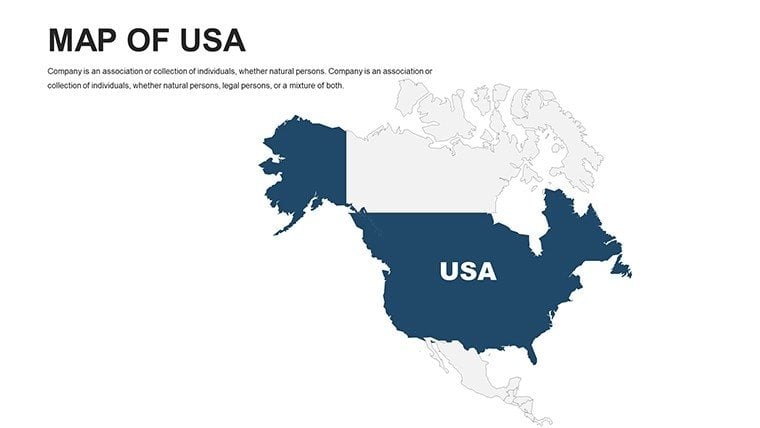
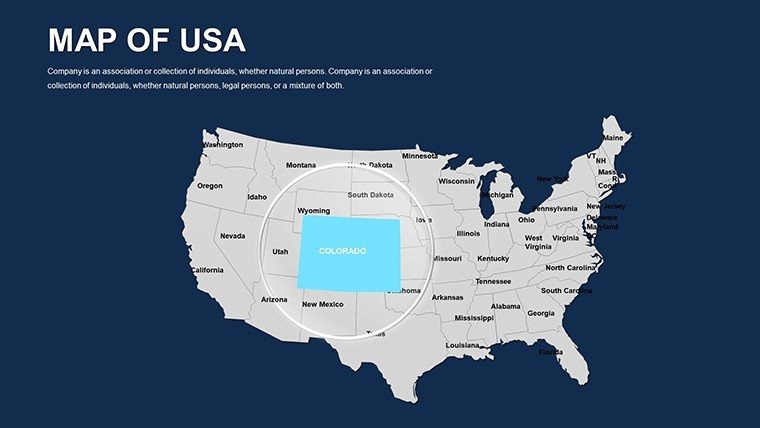
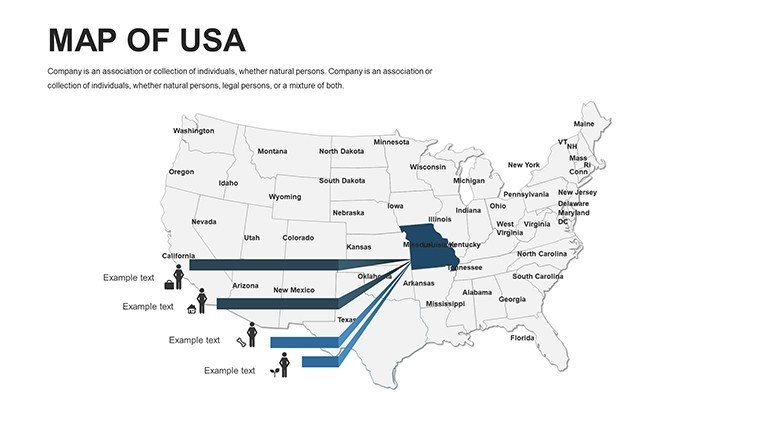
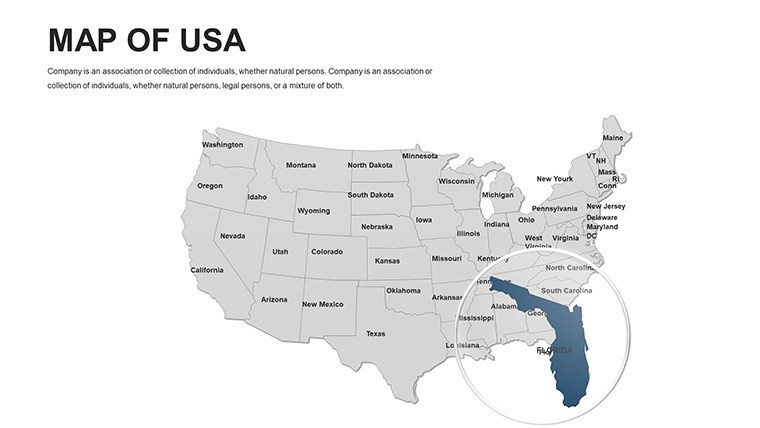
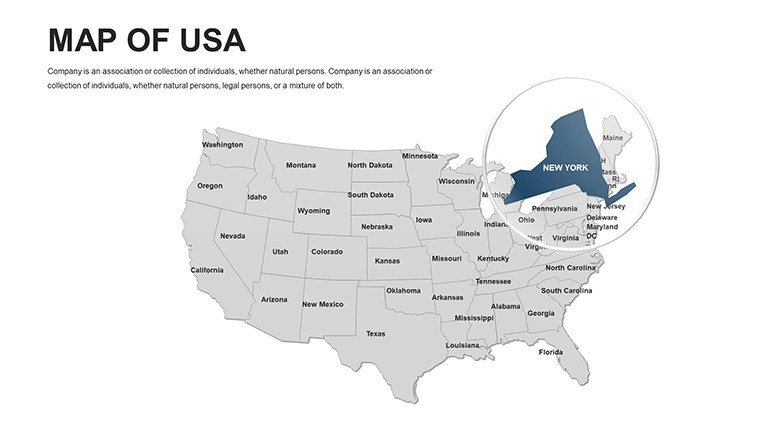
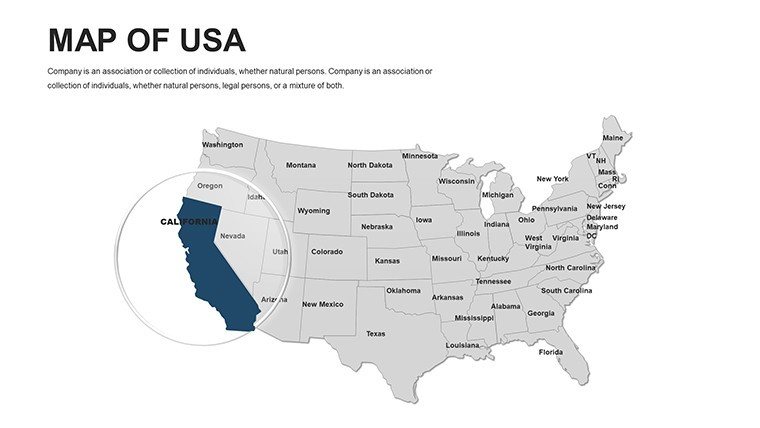
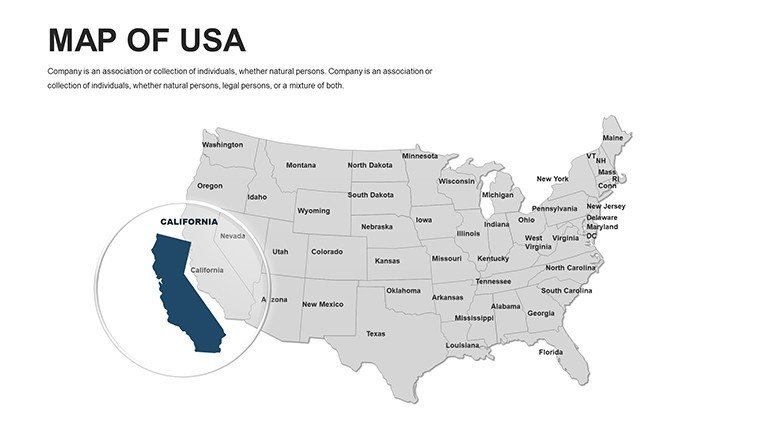
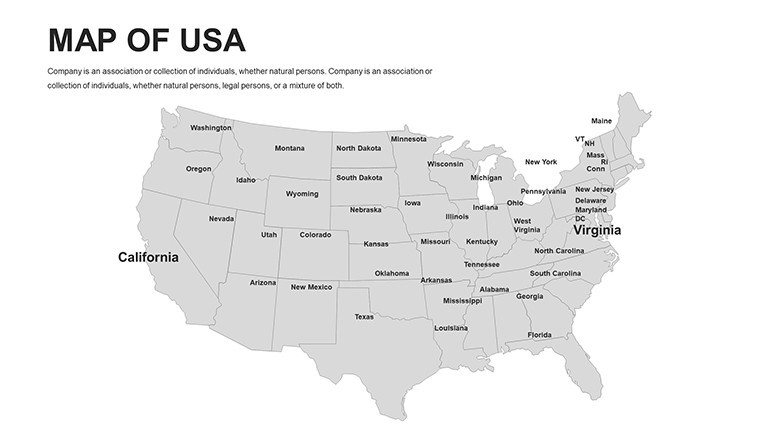
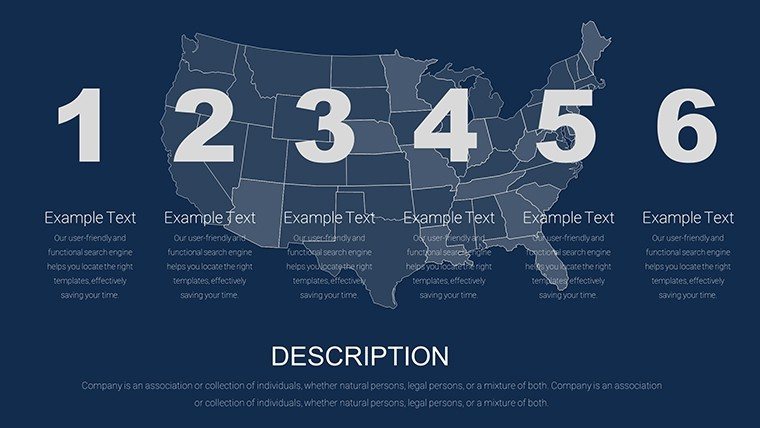
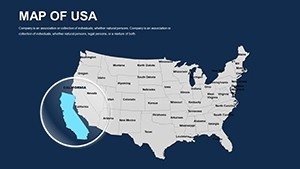
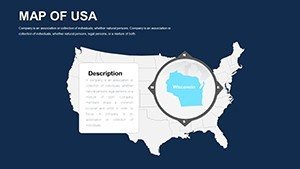
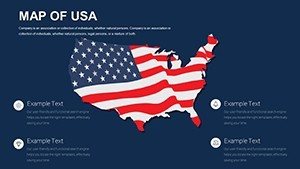
The United States' vast geography requires tools that handle state-level details with finesse. Enter our US Map PowerPoint Template, boasting 60 editable slides tailored for analysts, politicians, and educators alike. From delineating sales regions in the Midwest to analyzing population shifts in the Sun Belt, this template makes national data local and actionable. Fully compatible with PowerPoint and Google Slides, it empowers you to create presentations that resonate. Picture customizing a slide to showcase electoral college strategies or hurricane impact zones - turning raw facts into persuasive visuals that stick with your audience long after the meeting ends.
Mastering US Geography in Presentations
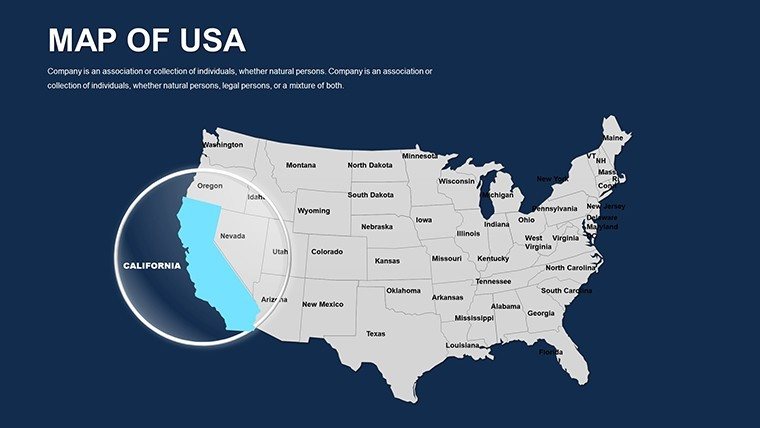
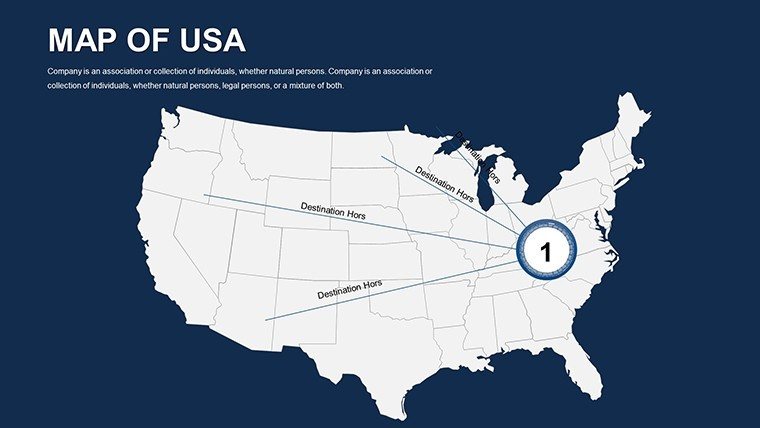
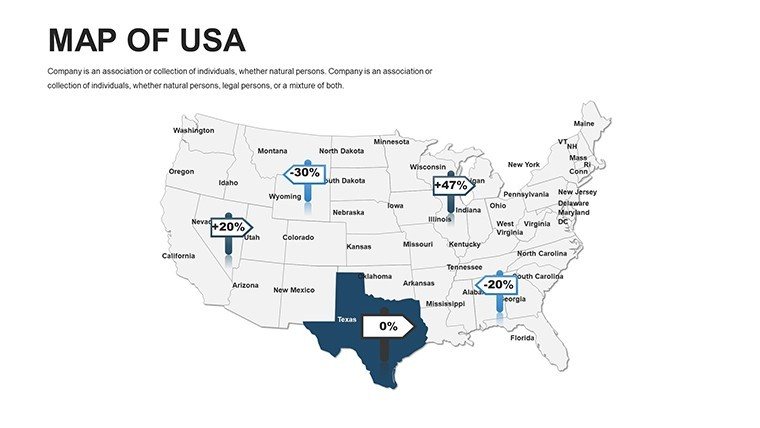
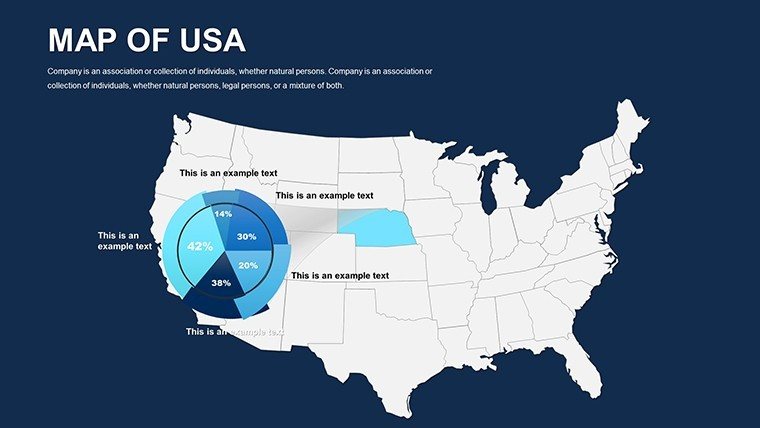
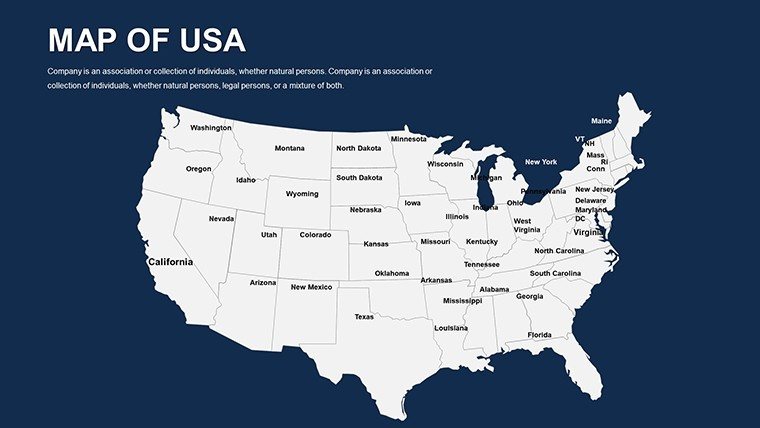
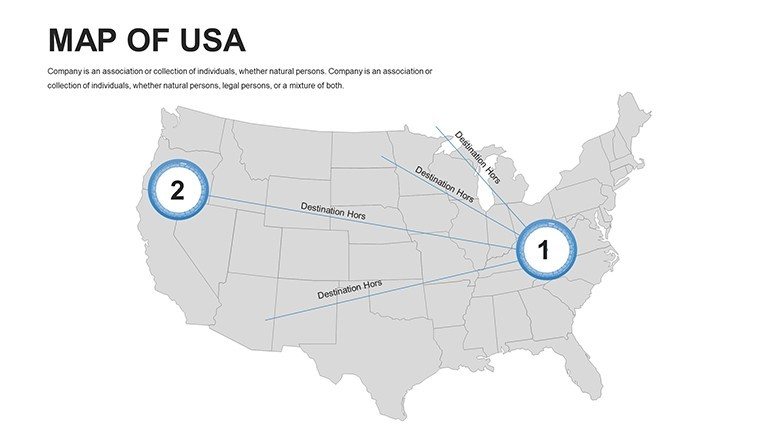
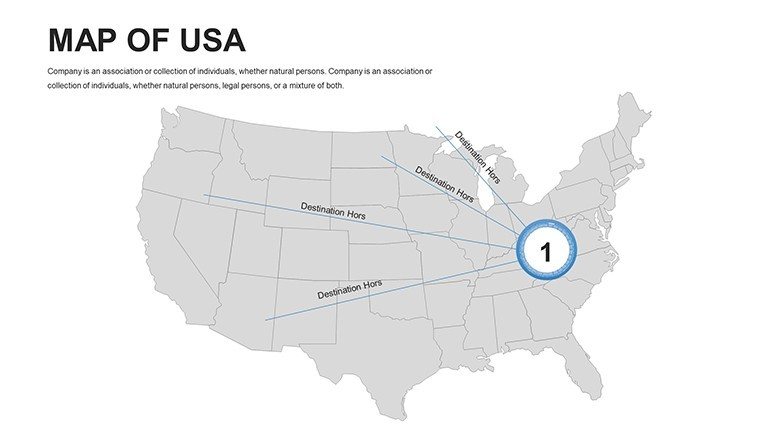
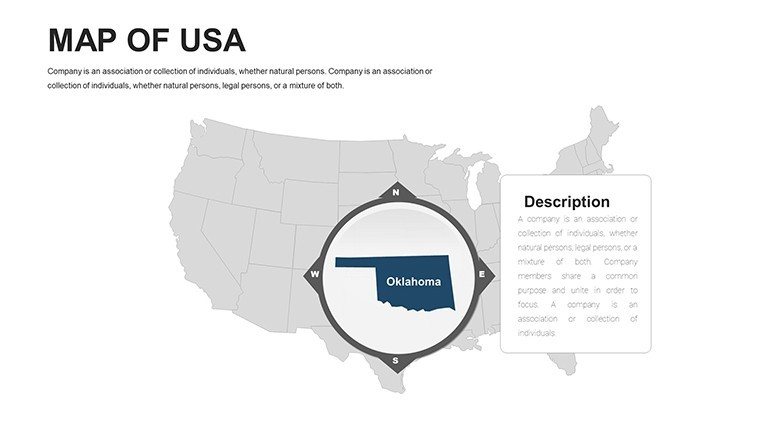
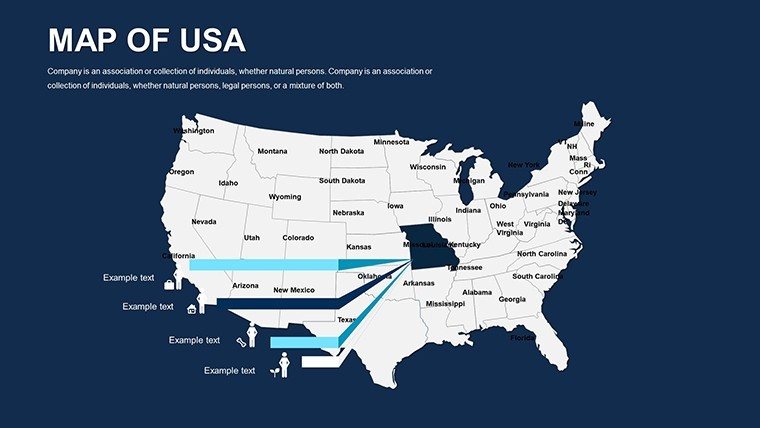
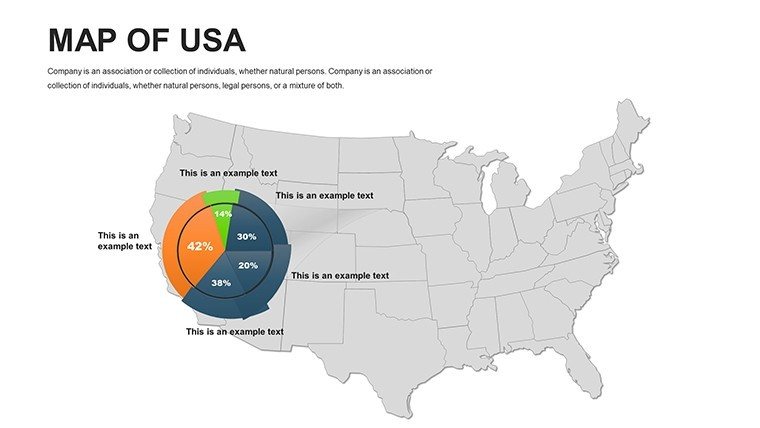
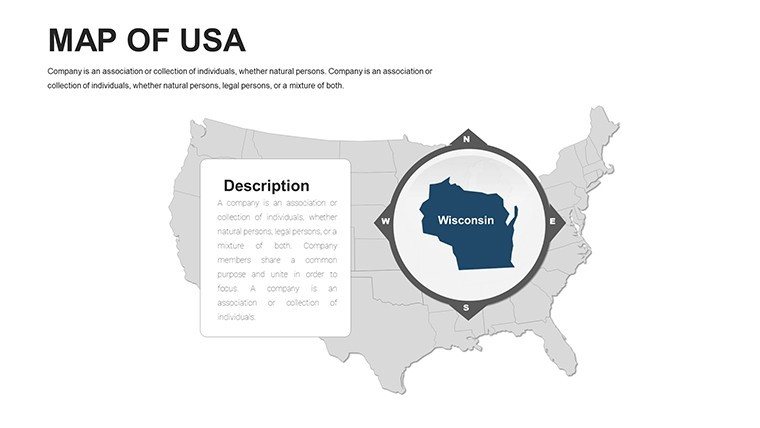
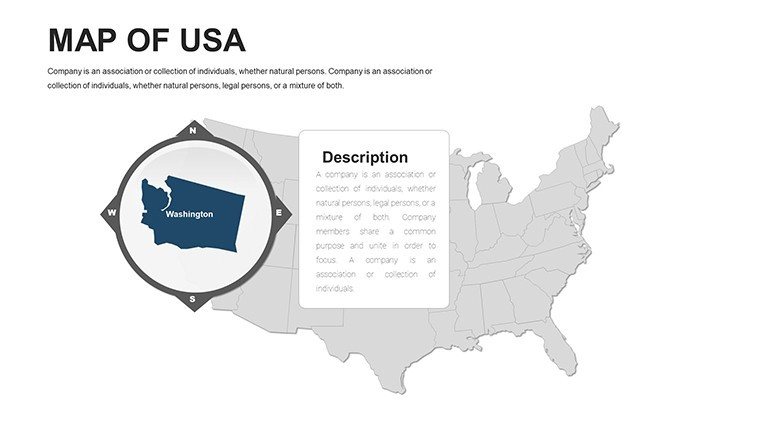
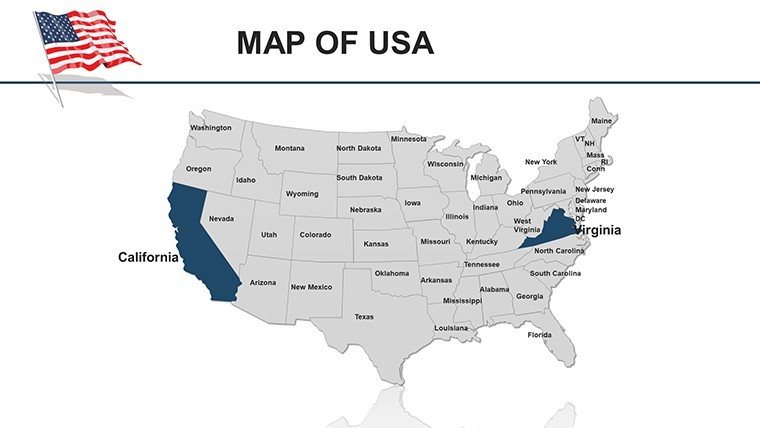
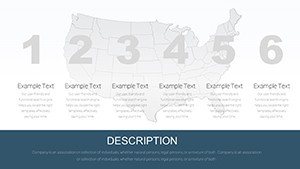
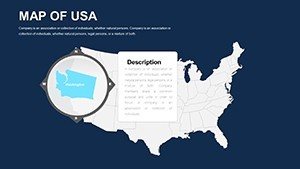
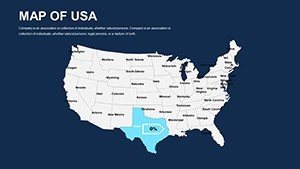
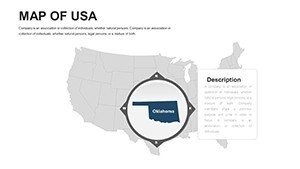
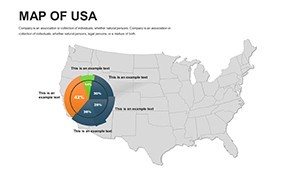
This template excels in granularity, offering maps by state, region, and even county levels where relevant. Business professionals can overlay revenue figures, using gradients to indicate growth hotspots. In education, teachers map out Civil War battles or migration patterns, fostering interactive learning. Drawing from USGS standards for accuracy, the designs ensure reliability while allowing creative freedom. Choose from outline, filled, or interactive styles to match your presentation's objectives, whether it's a quick overview or a deep dive.
Essential Features for Dynamic Maps
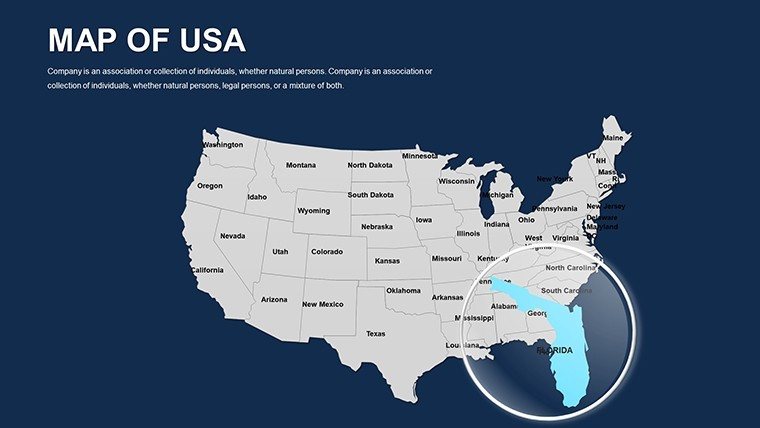
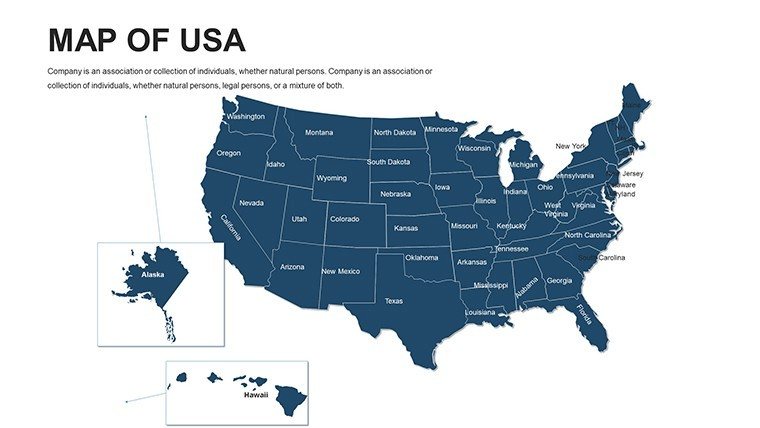
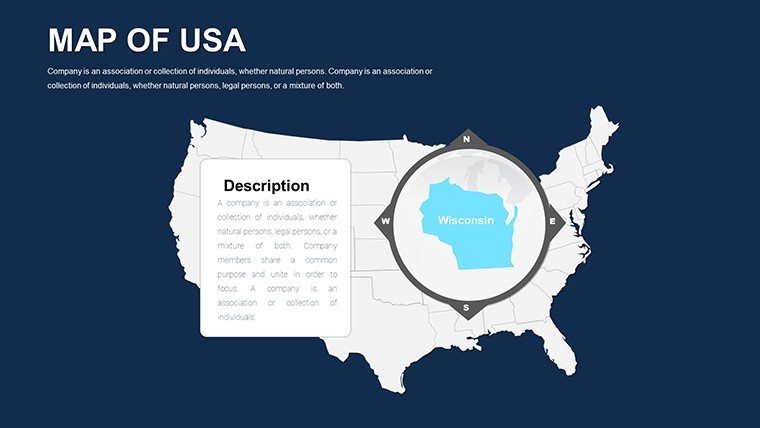
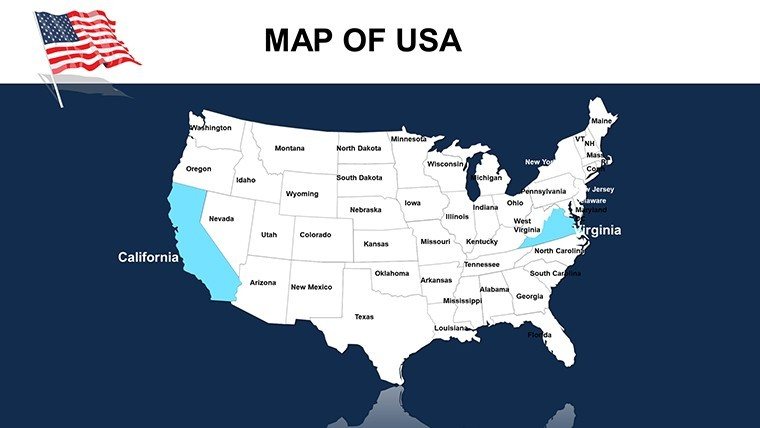
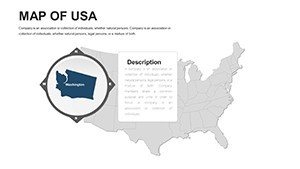
- State-Specific Edits: Isolate and modify individual states with ease.
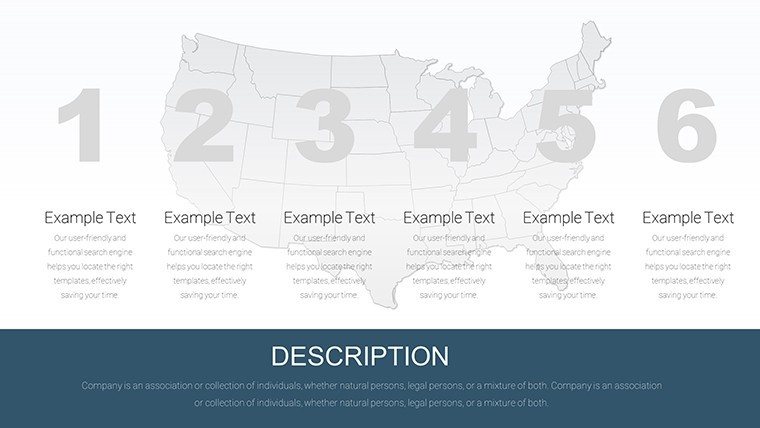
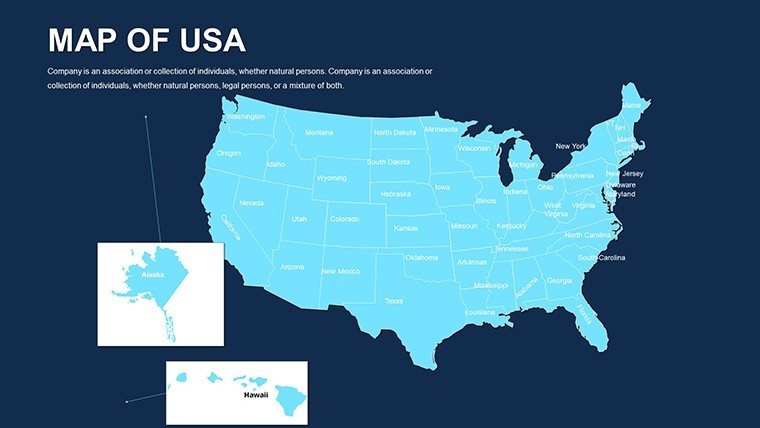
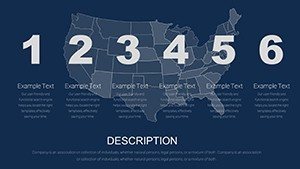
- 60 Comprehensive Slides: Including national, regional, and thematic variations.
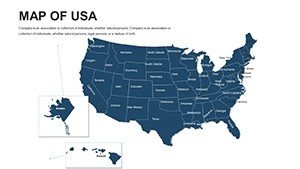
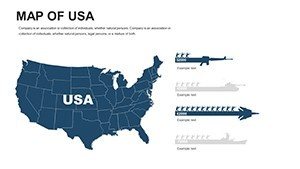
- Crisp Vectors: No blurring when zoomed or printed.
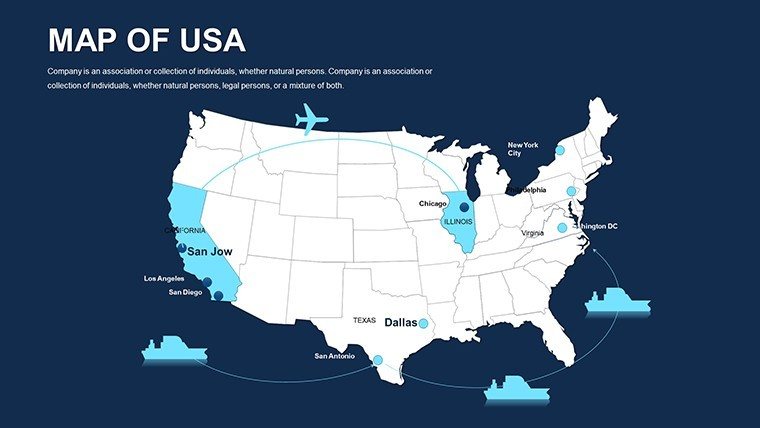
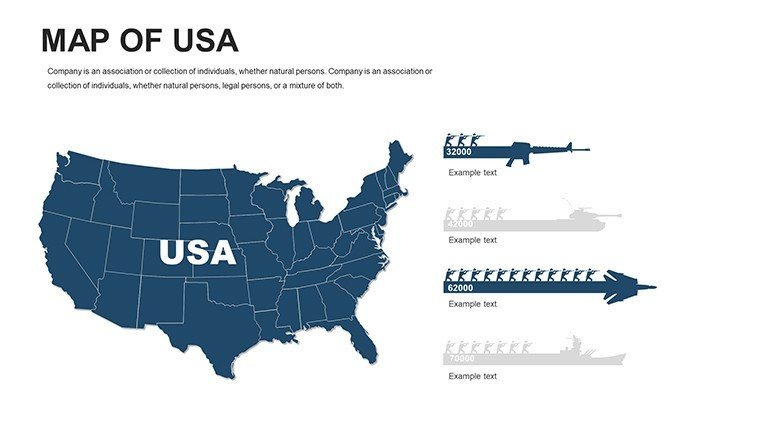
- Data Overlay Capabilities: Integrate spreadsheets for automated updates.
- Broad Compatibility: Functions flawlessly across Windows, Mac, and web-based tools.
Aligned with data visualization guidelines from the Census Bureau, it prioritizes usability and precision.
Industry-Specific Applications and Success Stories
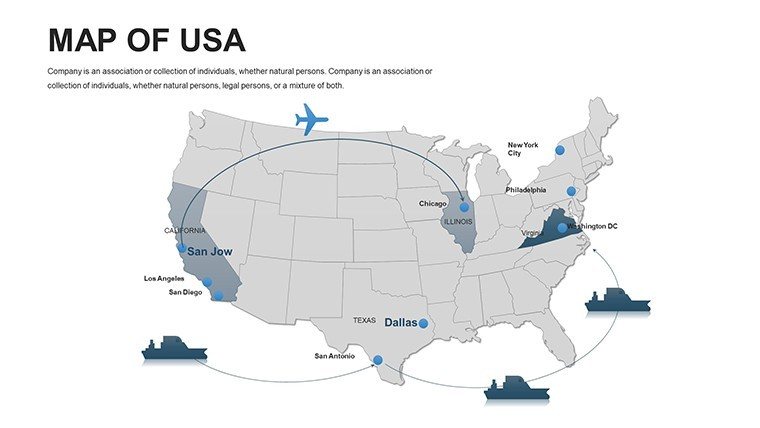
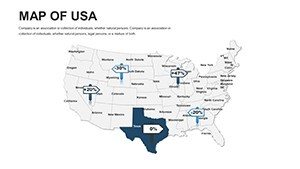
Real estate firms use it to visualize market trends, like housing booms in Texas. Political campaigns track voter turnout, as seen in recent midterms where maps highlighted swing states. Healthcare providers map epidemic spreads, aiding resource allocation. These uses demonstrate the template's role in informed decision-making, backed by case studies from organizations like the Brookings Institution.
Easy Customization Steps
- Import the template into PowerPoint.
- Select states and apply custom fills or patterns.
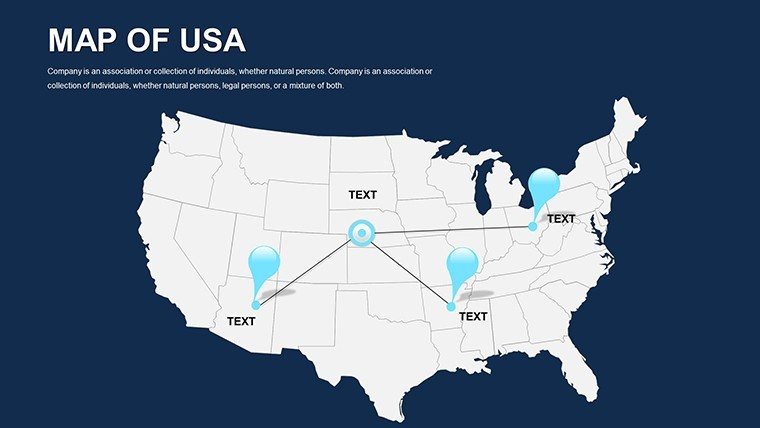
- Add legends or tooltips for clarity.
- Merge with charts for multifaceted views.
- Animate for engaging reveals.
- Share via cloud or export.
This method streamlines creation, ideal for tight deadlines.
Outshining Standard Map Tools
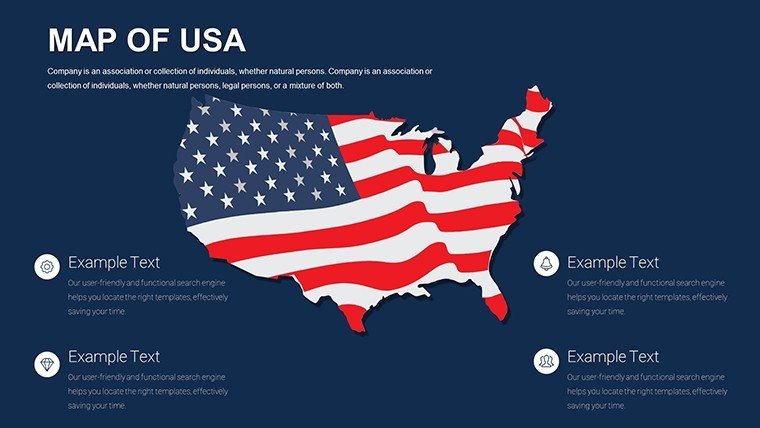
Built-in options often fall short on detail; our template fills that gap with pre-labeled states and customizable legends. Patriotic color schemes or neutral tones enhance thematic relevance, making your work professional and polished.
Expert Advice for Better Results
Leverage Census data for authenticity. Employ grouping tools to manage complex layers. Ensure mobile compatibility for on-the-go edits. Reference successful presentations, like those from TED Talks on US demographics, for inspiration.
Additional sectors benefit too: Retailers optimize store placements, environmentalists track conservation efforts in national parks.
Revolutionize Your US Data Displays
With this US map template, your presentations gain authority and appeal. Grab it now and map out your path to success.
Frequently Asked Questions
- Can I edit individual counties? Select slides offer county-level details for deeper analysis.
- Is it updated for current boundaries? Yes, reflects the latest US geography.
- Supports animations? Fully, with built-in options for state highlights.
- Commercial license included? Yes, unlimited use in business settings.
- File format? .pptx, compatible with most software.