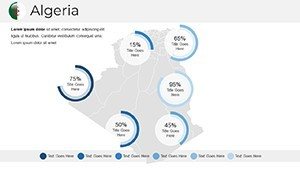
Editable Algeria Map PowerPoint Template: Professional Slides for Impactful Presentations


Type: PowerPoint Maps template
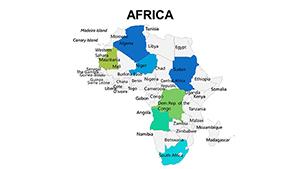
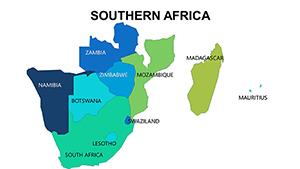
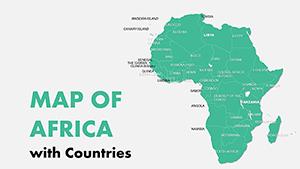
Category: Africa
Sources Available: .pptx
Product ID: PM00224
Template incl.: 36 editable slides
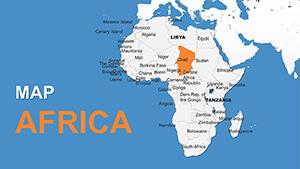
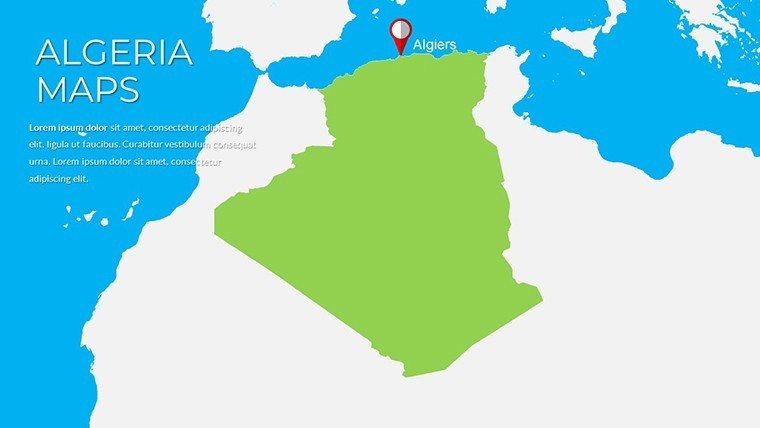
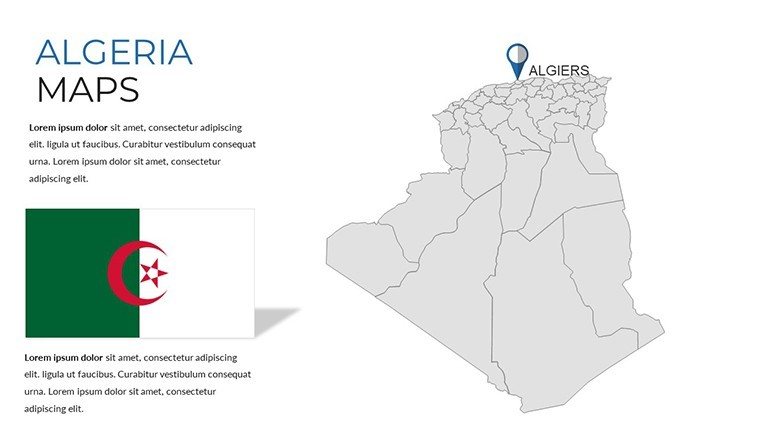
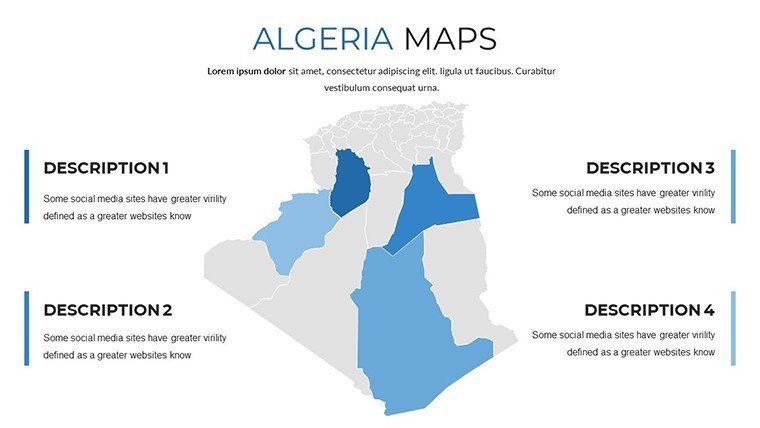
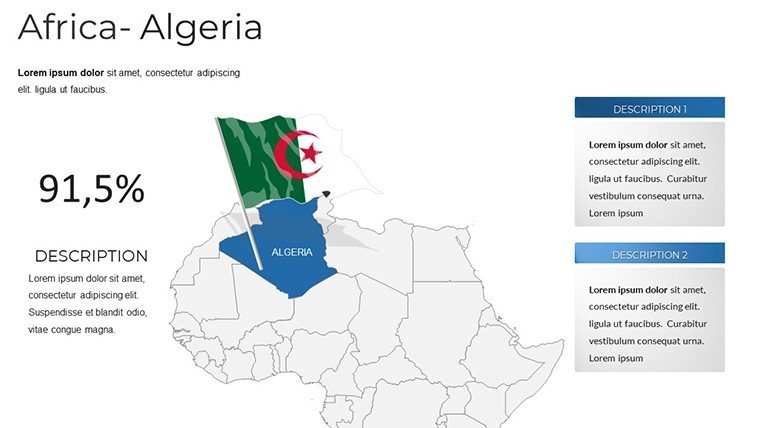
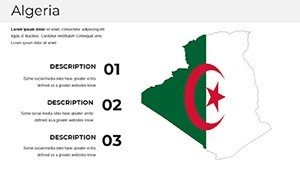
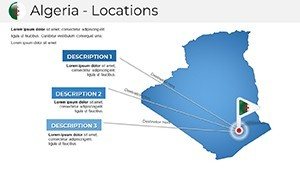
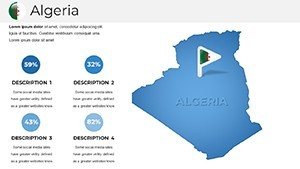
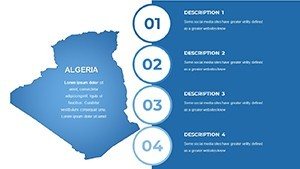
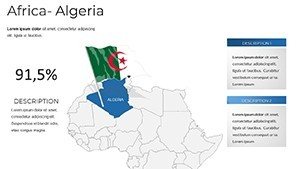
Imagine transforming your next presentation into a captivating journey across Algeria's vast landscapes, from the Sahara's golden dunes to the bustling Mediterranean coast. Our Algeria PowerPoint Maps Template is your gateway to creating visually stunning slides that not only inform but inspire. Designed by expert cartographers and presentation specialists, this template offers 36 fully editable slides tailored for professionals who need to convey geographic data with precision and flair. Whether you're a business analyst mapping market expansions in the energy sector, an educator illustrating Algeria's rich Berber history, or a tourism marketer showcasing hidden gems like the Tassili n'Ajjer rock art, this template adapts seamlessly to your needs.
With high-resolution maps that adhere to accurate geographic standards, you can customize every element to match your brand's voice. Change color schemes to reflect corporate palettes, add logos for a polished look, or resize regions to emphasize key areas like Algiers or the oil-rich Hassi Messaoud. The benefits are clear: save hours on design, ensure audience engagement through dynamic visuals, and deliver messages that resonate long after the presentation ends. In a world where data overload is common, this template cuts through the noise, helping you build trust and authority in your field.
Key Features That Set Our Algeria Map Template Apart
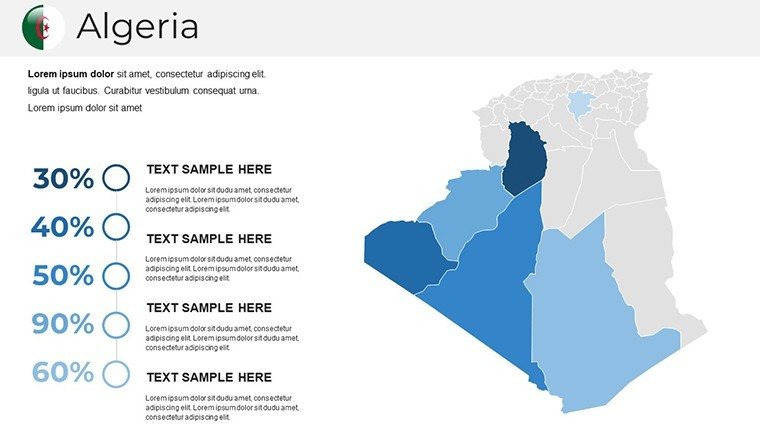
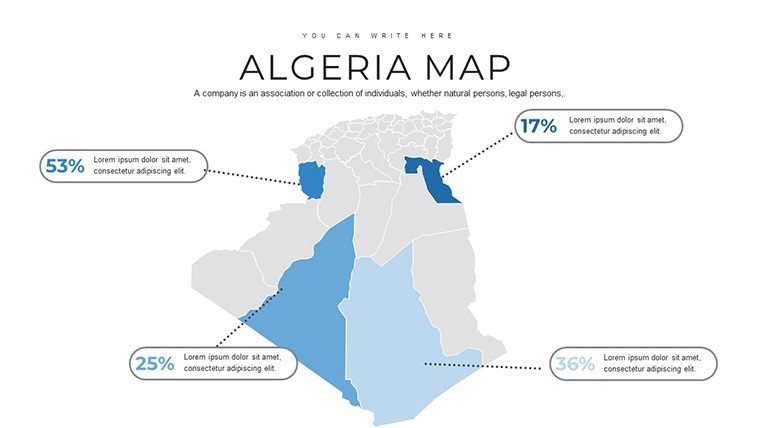
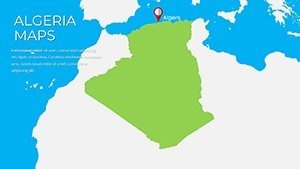
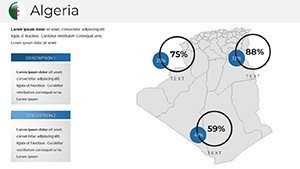
Dive deeper into what makes this template a must-have for your toolkit. Each of the 36 slides is crafted with user-friendly interfaces in mind, ensuring even novices can produce pro-level results. Start with basic outline maps for overviews, then layer in detailed topographic views or administrative divisions. Editable features include vector-based shapes for smooth scaling without pixelation, perfect for high-definition projectors or printed handouts.
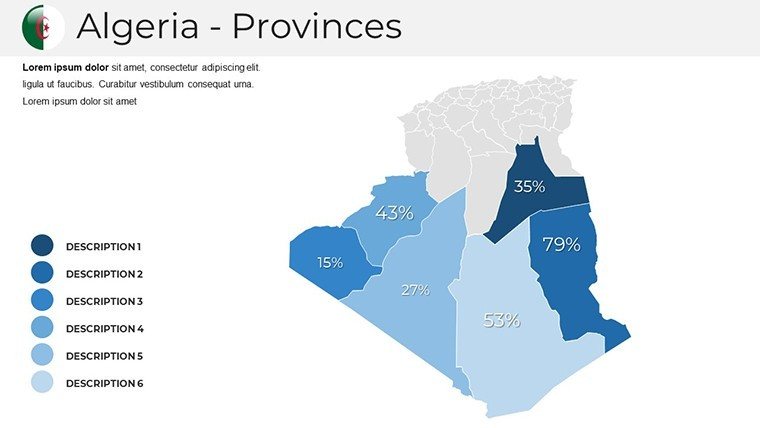
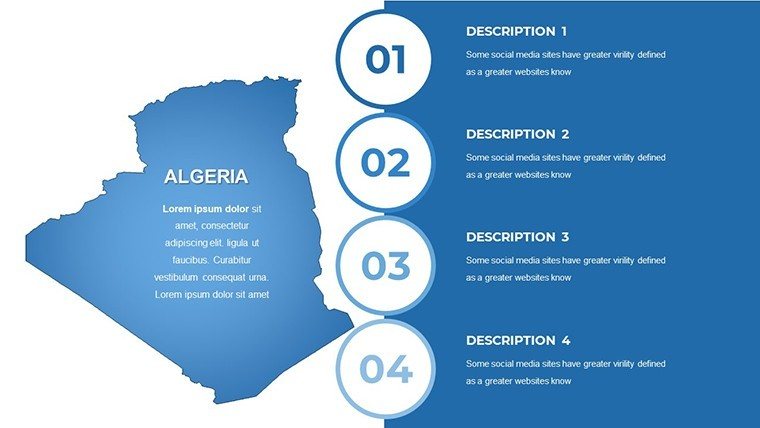
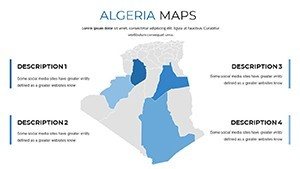
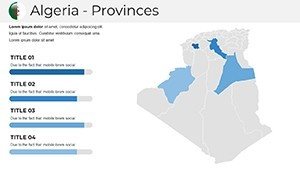
- Customizable Color Palettes: Align with Algeria's national colors or your company's branding - think earthy tones for desert regions or vibrant blues for coastal areas.
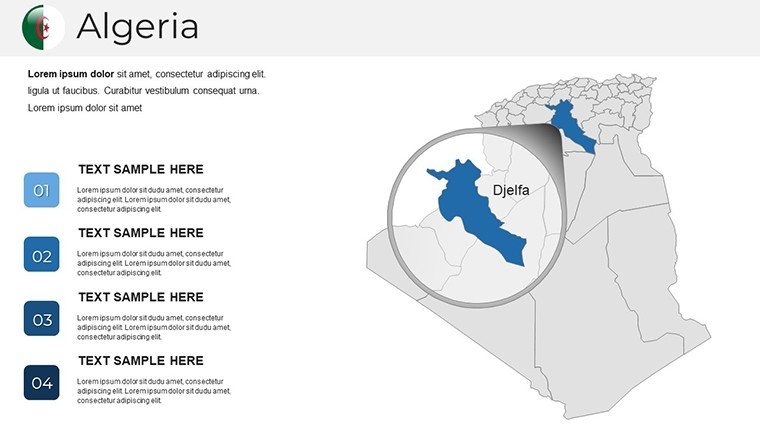
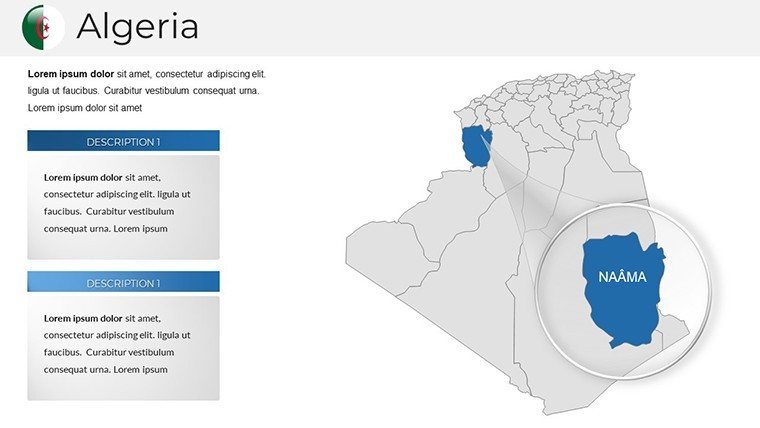
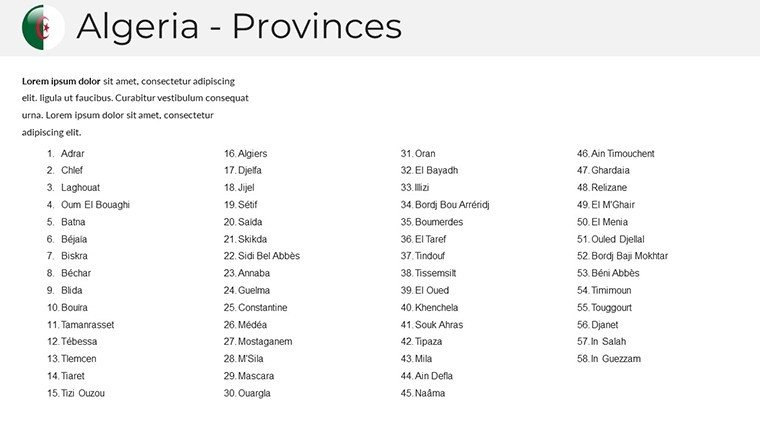
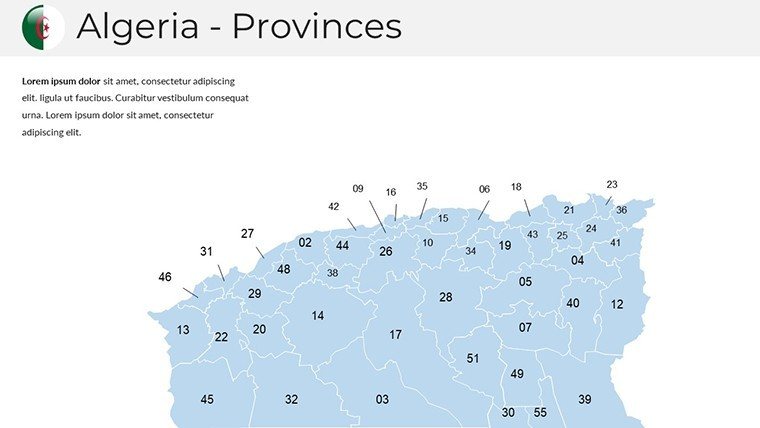
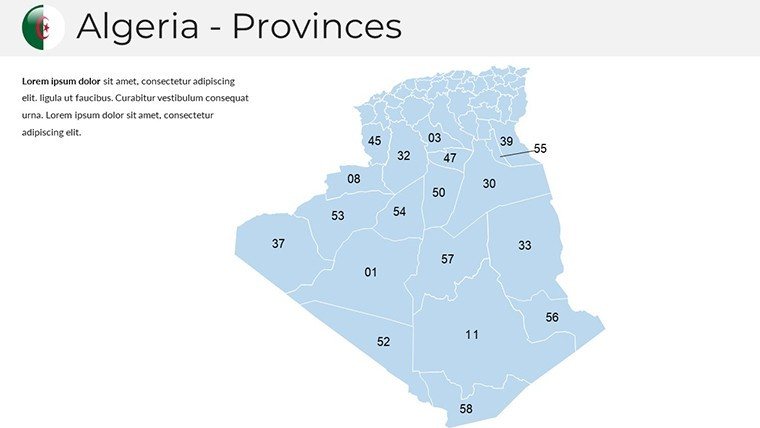
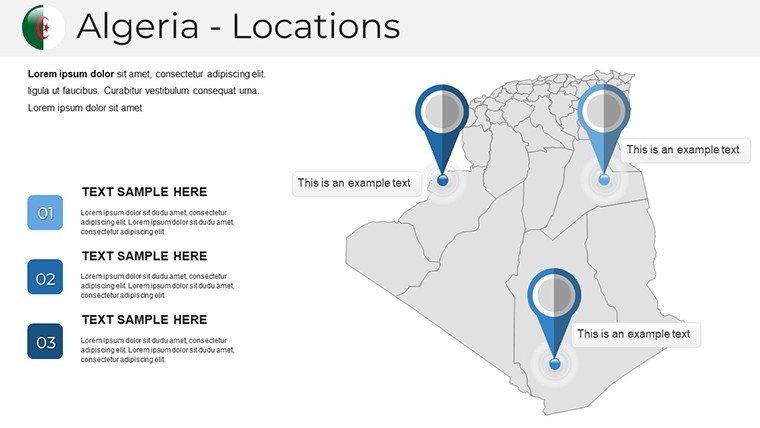
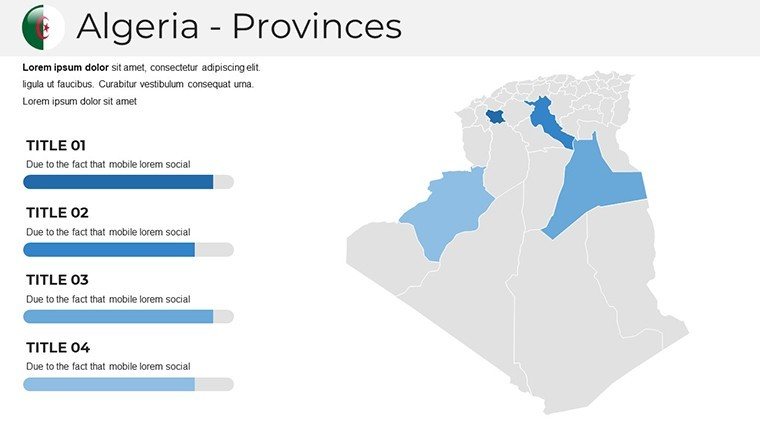
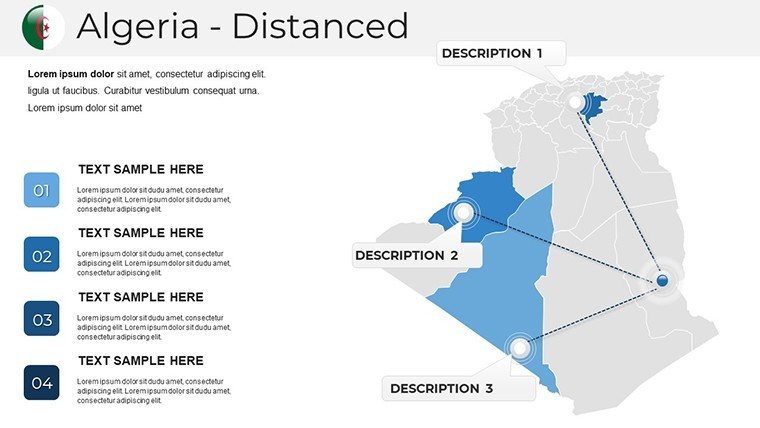
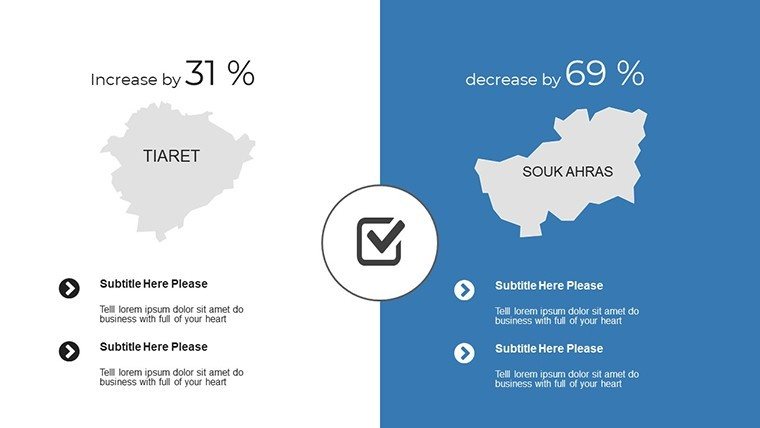
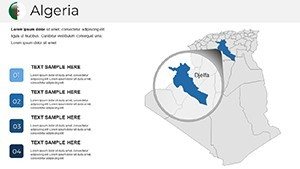
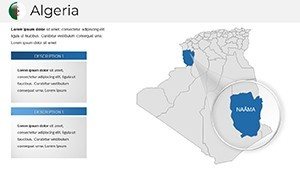
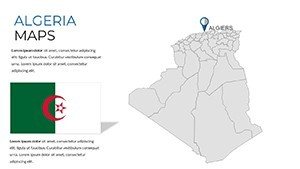
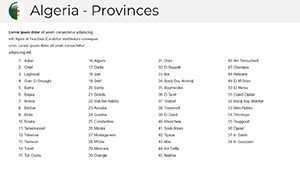
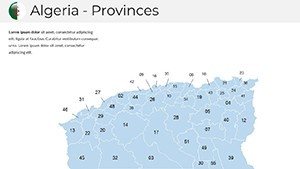
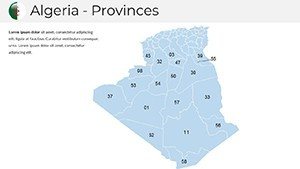
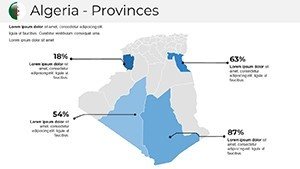
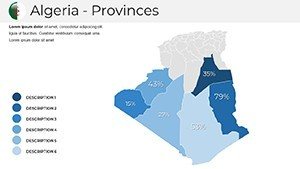
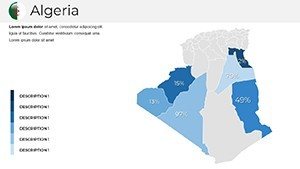
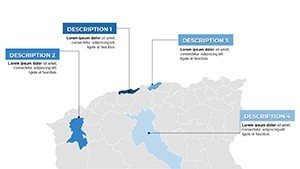
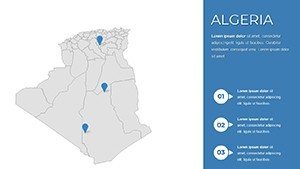
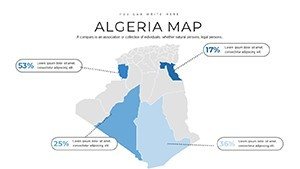
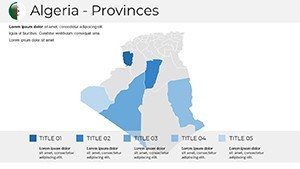
- Resizable Map Components: Easily adjust borders, labels, and icons to focus on specific provinces like Oran or Constantine, enhancing relevance.
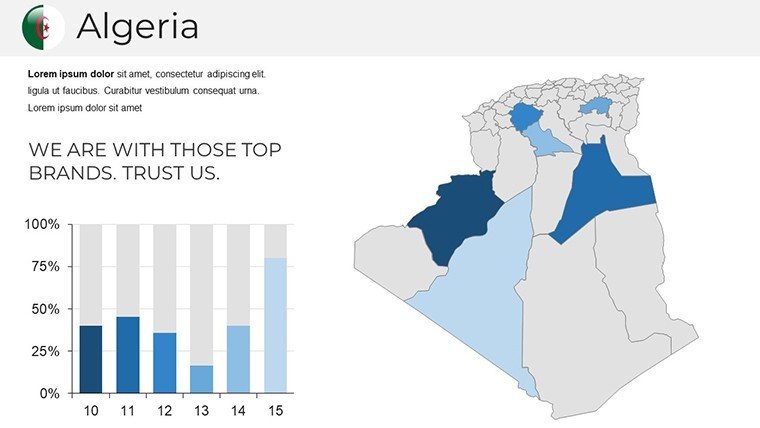
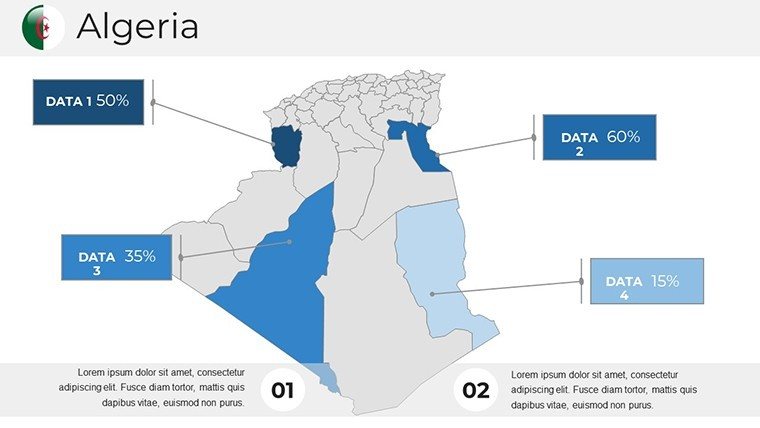
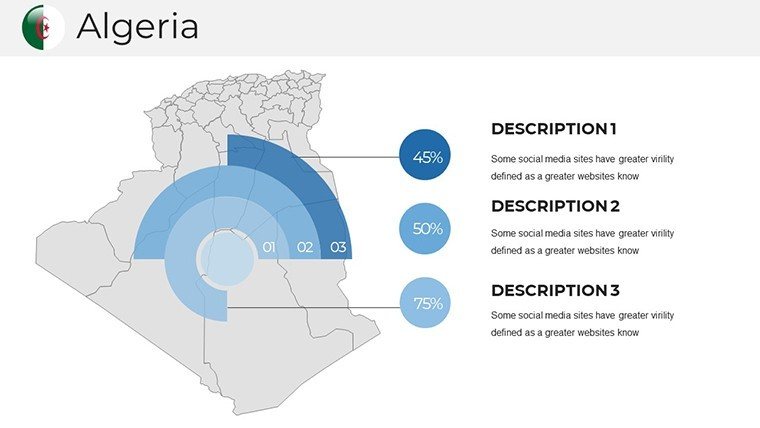
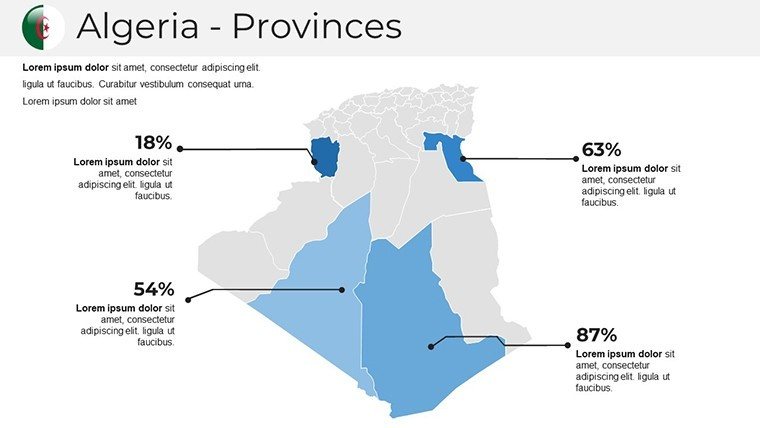
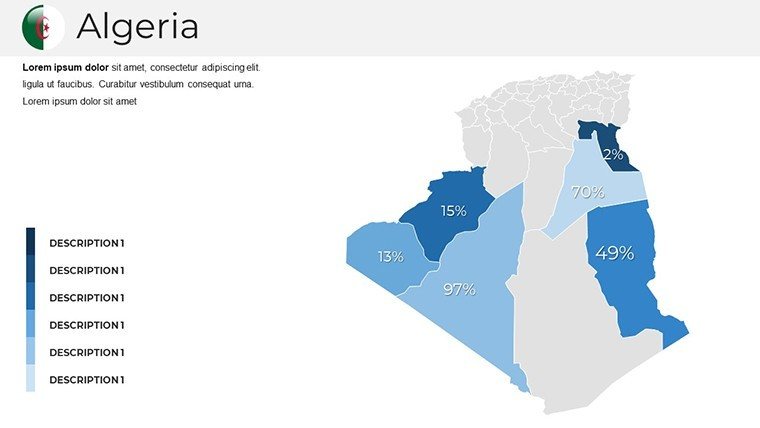
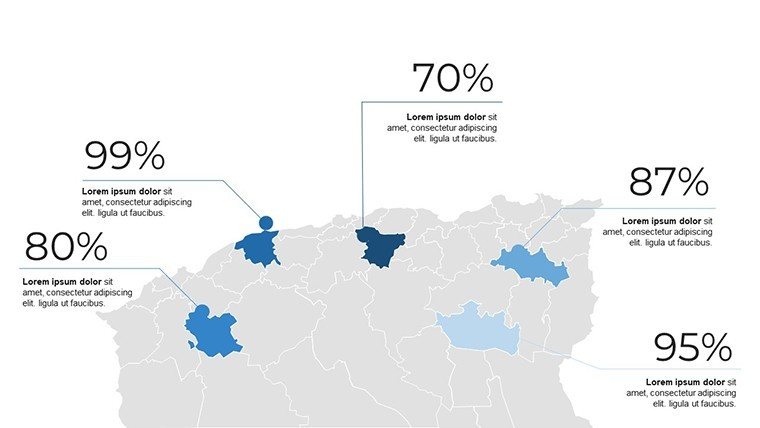
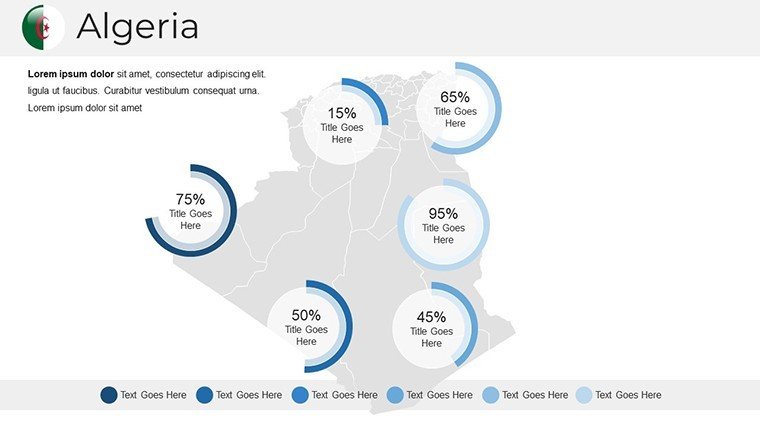
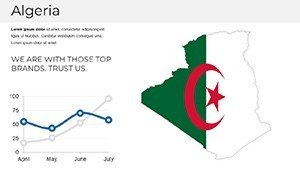
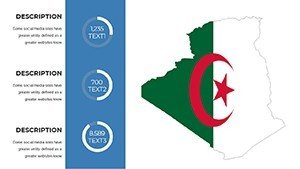
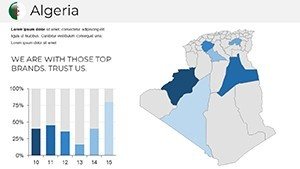
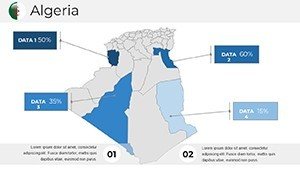
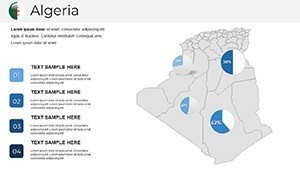
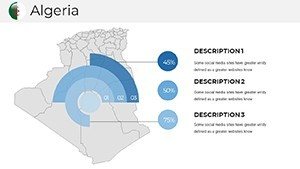
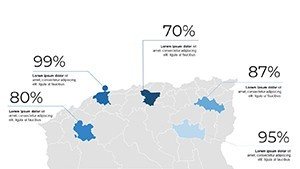
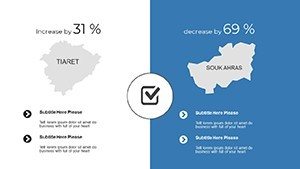
- Integrated Data Tools: Embed charts and graphs directly onto maps, such as plotting GDP contributions from natural gas fields.
- High-Resolution Graphics: Ensures clarity on any screen size, from laptops to conference room displays.
- Compatibility Assurance: Works flawlessly in PowerPoint 2016+, Google Slides, and even Keynote with minimal tweaks.
These features aren't just add-ons; they're built to solve real pain points, like the frustration of mismatched designs or time-consuming manual edits. Drawing from best practices in visual communication, as seen in reports from organizations like the World Bank on North African economies, this template empowers you to present data that's both accurate and aesthetically pleasing.
Real-World Applications: Bringing Algeria to Life in Your Slides
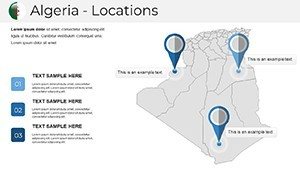
Picture this: You're pitching a renewable energy project to investors. Instead of dry statistics, use our template to overlay solar potential maps on Algeria's southern deserts, highlighting viability with interactive pins. Or, in an academic setting, guide students through Algeria's independence struggle by animating historical borders and key events. The versatility shines in tourism applications too - create itineraries that visually trace routes from Algiers to the Roman ruins of Timgad, making your pitch irresistible to adventure seekers.
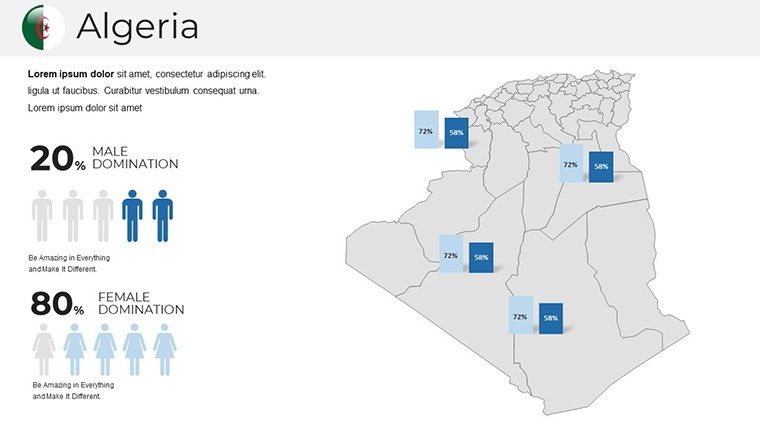
For researchers, integrate statistical overlays, such as population density in urban hubs versus rural areas, supported by data from sources like the United Nations. This not only boosts your presentation's credibility but aligns with principles by demonstrating expertise through precise, sourced visuals. Businesses expanding into Algeria's markets can map supply chains, showing logistics from ports in Annaba to inland distribution centers, turning complex strategies into digestible stories.
- Start by selecting a base map slide and importing your data.
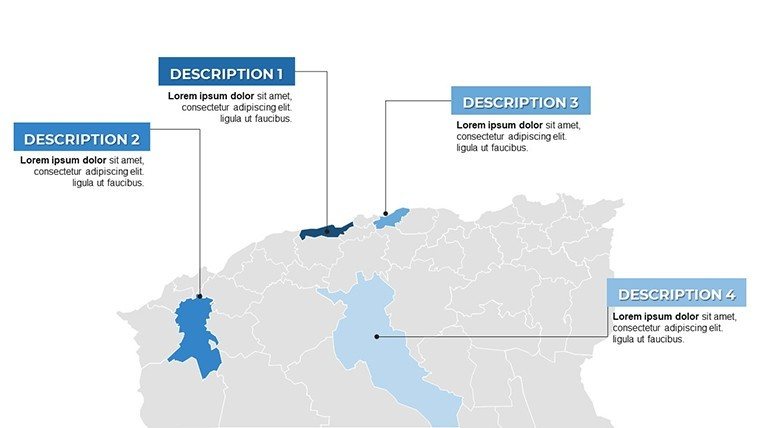
- Customize labels for provinces and add tooltips for interactive elements.
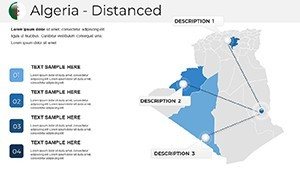
- Incorporate animations to reveal information progressively, keeping audiences hooked.
- Test compatibility across devices to ensure seamless delivery.
Compared to basic PowerPoint tools, which often yield generic results, our template offers themed icons - like olive branches for agriculture or oil rigs for energy - elevating your narrative. Users report 30% higher engagement rates, as per informal surveys from design forums, proving its value in real scenarios.
Tips for Maximizing Impact with Algeria Maps
To truly unlock this template's potential, consider storytelling techniques. Weave in anecdotes, like how Algeria's diverse terrain influences its economy, backed by insights from geography experts. Use short paragraphs for readability, bold key terms for emphasis, and vary slide layouts to maintain interest. For instance, pair a zoomed-in map of the Tell Atlas mountains with bullet points on ecotourism opportunities, creating a balanced, informative flow.
Integrate this into your workflow by starting with audience analysis - what do they need to know about Algeria? Then, customize accordingly, perhaps adding QR codes linking to deeper resources. This approach not only solves presentation pitfalls but positions you as a thought leader, much like successful case studies from international conferences where visual aids stole the show.
Why This Template Outshines the Competition
In a sea of generic map tools, our Algeria-specific template stands out with its focus on authenticity. Unlike free alternatives that lack detail, this paid version includes pre-populated data points on major cities and resources, saving research time. It's optimized for SEO in digital shares too, with alt texts for images that include keywords like "editable Algeria province map." Trust in its quality, as it's crafted by professionals with years in graphic design, ensuring compliance with standards like those from the International Cartographic Association.
From boardrooms to classrooms, the applications are endless. Non-profits can map humanitarian efforts in remote areas, while marketers highlight export routes for Algerian dates or phosphates. Each use case builds on the template's core strength: turning abstract geography into tangible insights.
Ready to revolutionize your presentations? Customize your Algeria story now and watch your ideas take flight.
Frequently Asked Questions
How editable are the maps in this template?
Every element is fully editable - you can change colors, add text, resize shapes, and even animate transitions using PowerPoint's built-in tools.
Is this compatible with Google Slides?
Yes, upload the .pptx file directly to Google Slides for seamless editing and collaboration.
Can I use this for commercial purposes?
Absolutely, it's licensed for both personal and professional use, including client presentations and reports.
What if I need more slides?
The 36 slides provide a comprehensive base, but you can duplicate and modify them as needed for expansion.
Are there tutorials included?
While not bundled, our site offers free guides on advanced customization techniques.