Dynamic Kuwait Maps PPT: Business-Ready


Type: PowerPoint Maps template
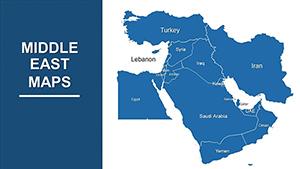
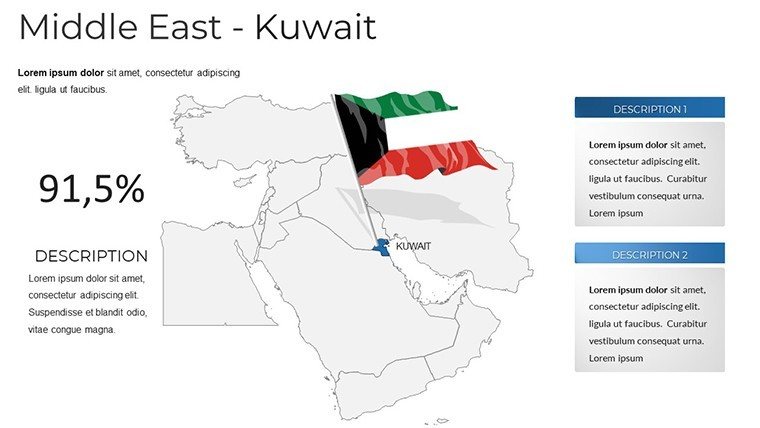
Category: Middle East
Sources Available: .pptx
Product ID: PM00210
Template incl.: 37 editable slides
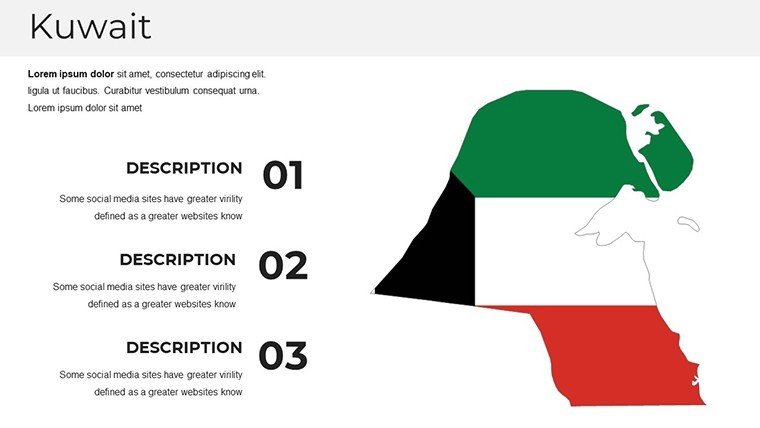
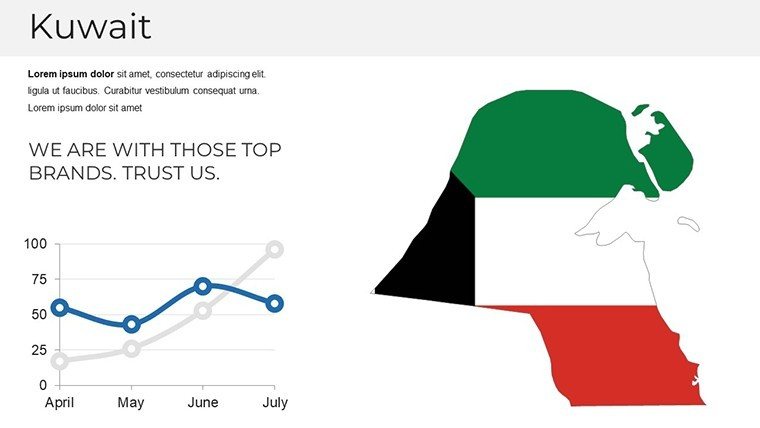
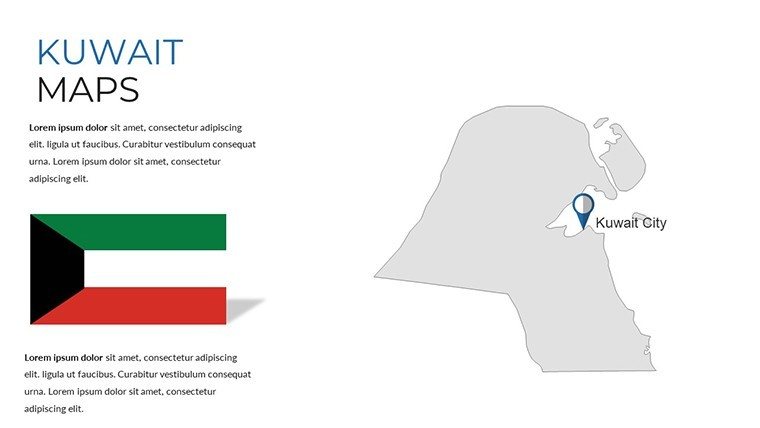
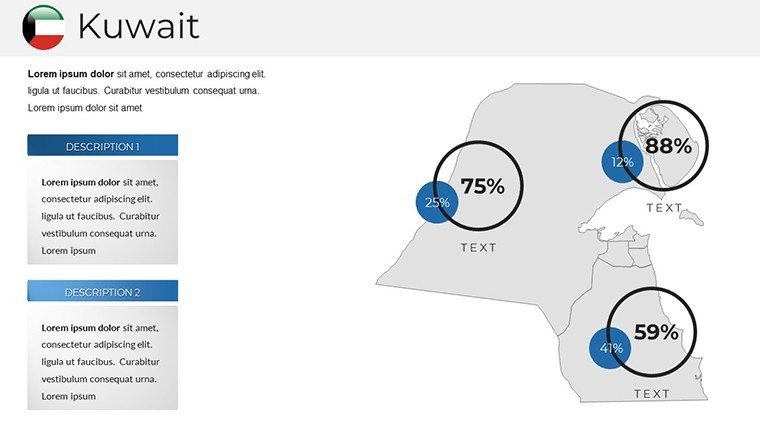
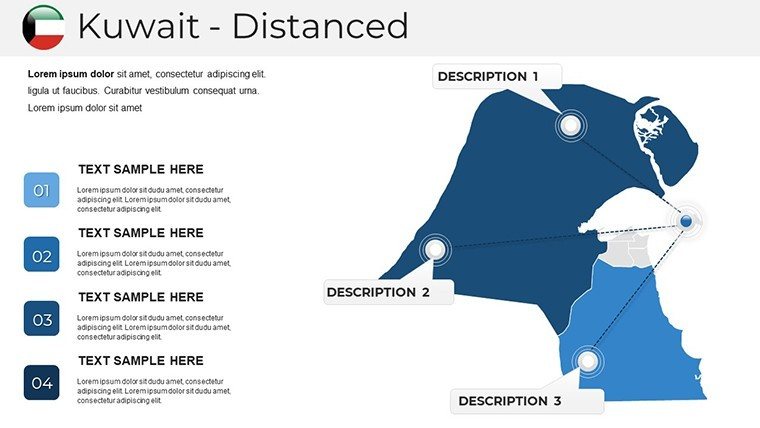
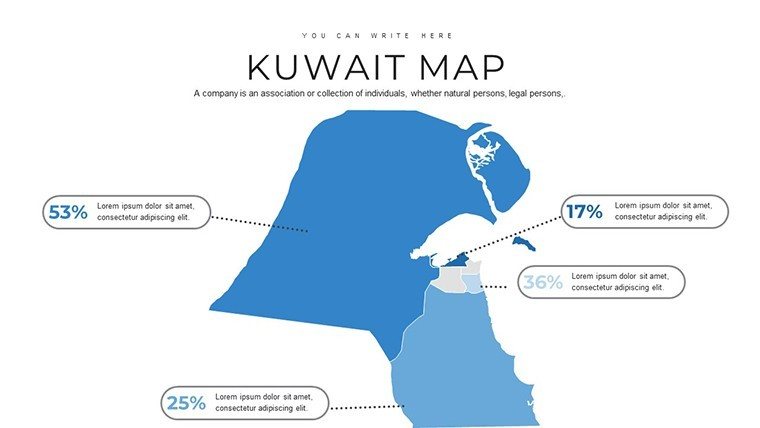
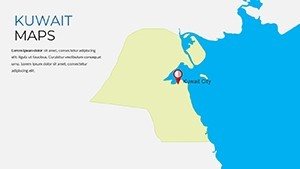
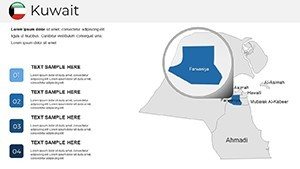
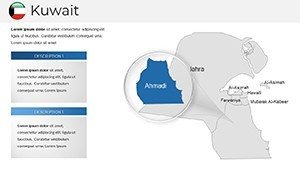
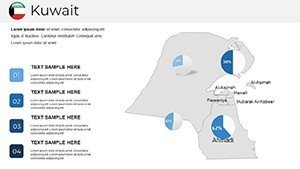
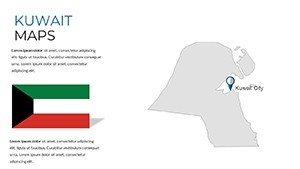
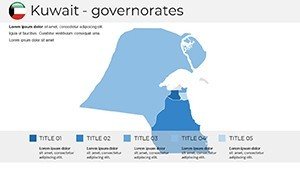
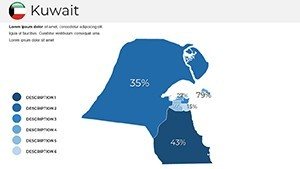
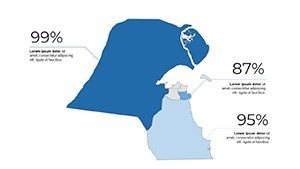
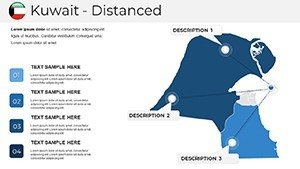
Step into the world of strategic visualization with our Kuwait PowerPoint maps template, equipped with 37 editable slides that cater to the demands of fast-paced business environments. Ideal for executives mapping oil sector expansions, educators teaching Gulf economics, or marketers targeting urban hubs like Kuwait City, this template combines accuracy with aesthetic prowess. Drawing from authoritative sources such as the Kuwait Petroleum Corporation's guidelines, you'll create presentations that not only inform but persuade, saving valuable time while amplifying your message's reach. Experience the shift from mundane slides to dynamic tools that highlight Kuwait's economic hubs, from the bustling Souk Al-Mubarakiya to offshore oil fields, fostering deeper audience connections.
Harnessing Kuwait's Economic Landscape in Visual Form
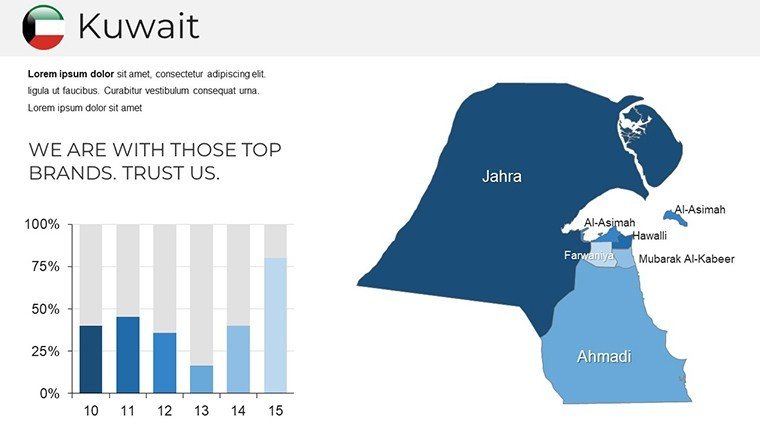
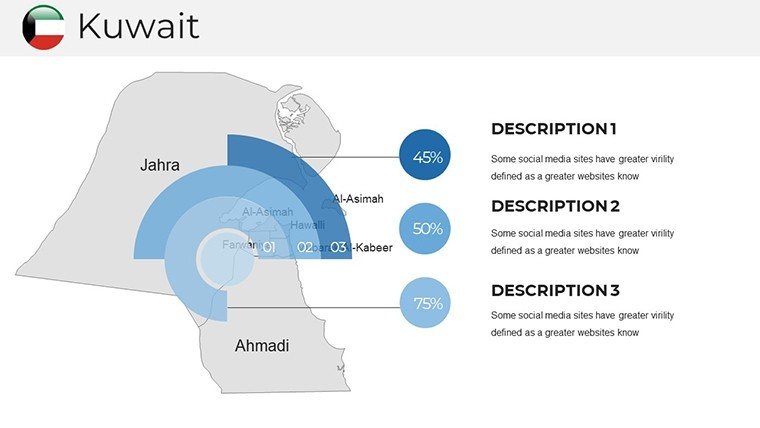
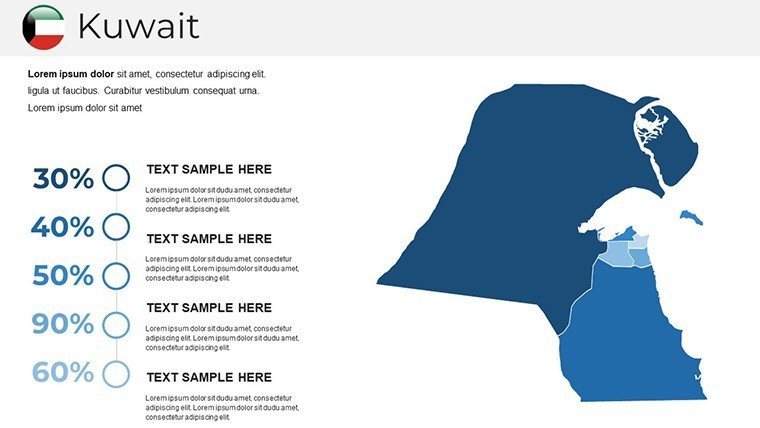
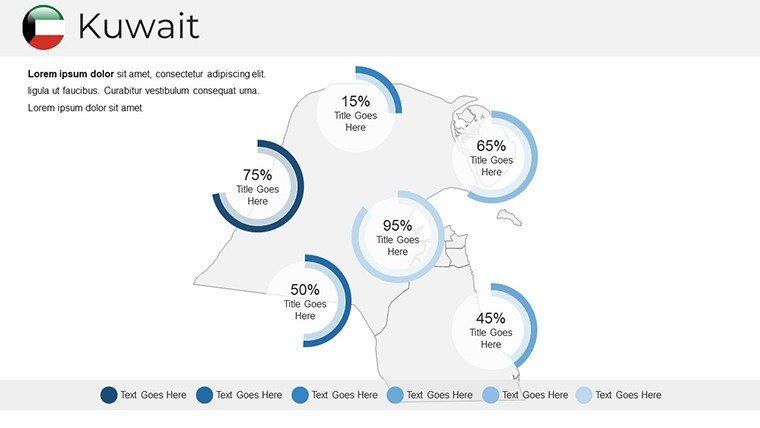
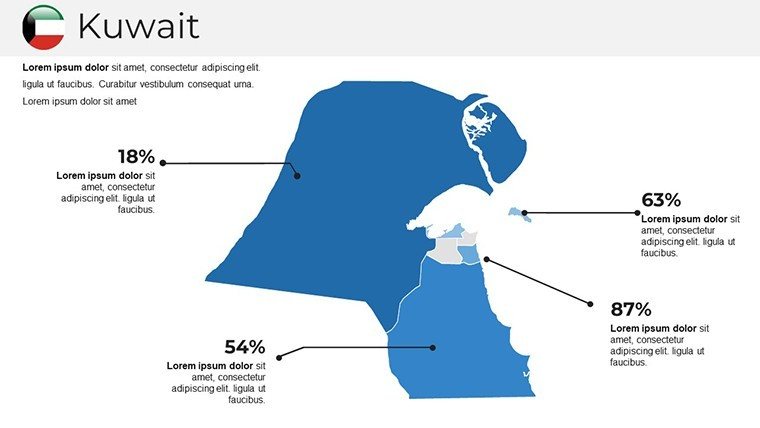
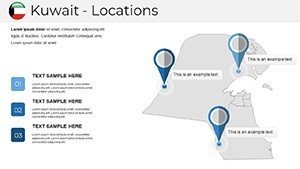
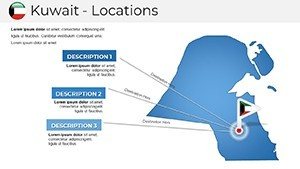
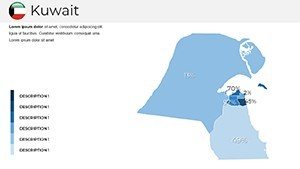
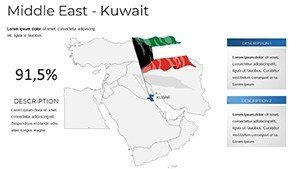
Kuwait's role as an OPEC powerhouse demands presentations that reflect its energy-driven economy and urban sophistication. Our template provides maps with layers for thematic analysis, such as plotting investment zones in the Silk City project or visualizing trade flows through Shuwaikh Port. Corporate users can customize for quarterly reports, aligning with international standards from the World Bank, while academics might overlay historical data on pre-oil era transformations. This approach turns geographical data into actionable insights, enhancing decision-making in high-stakes settings.
Essential Features for Professional Excellence
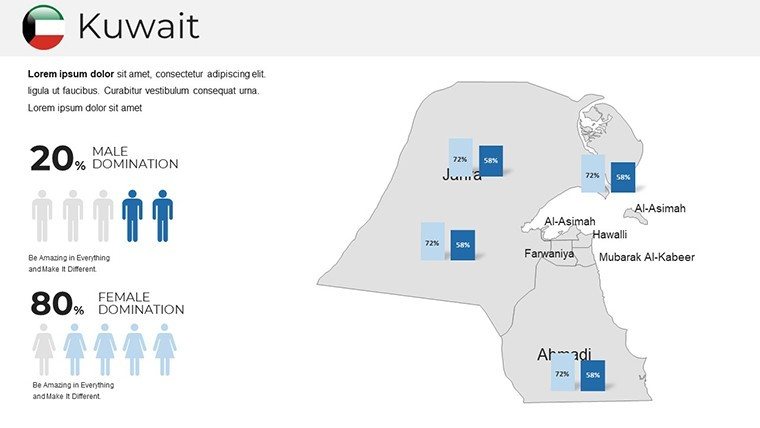
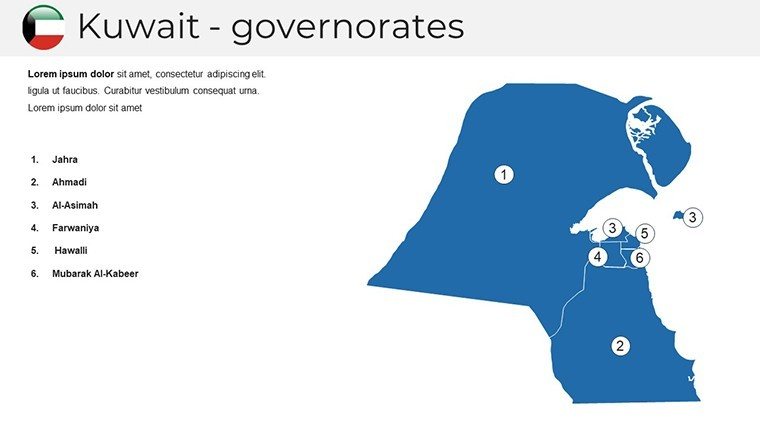
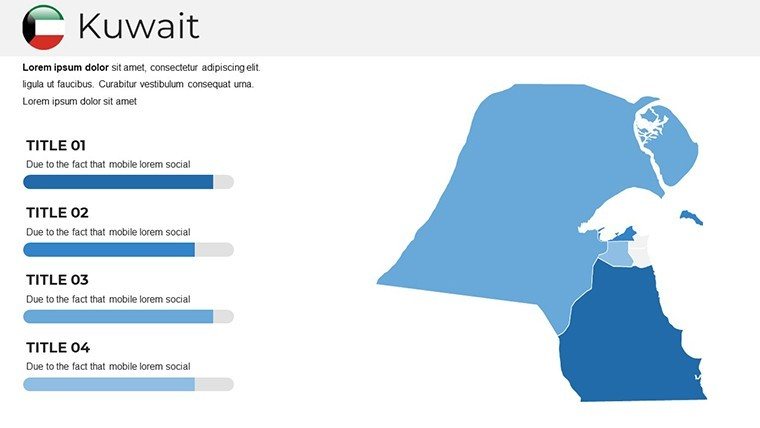
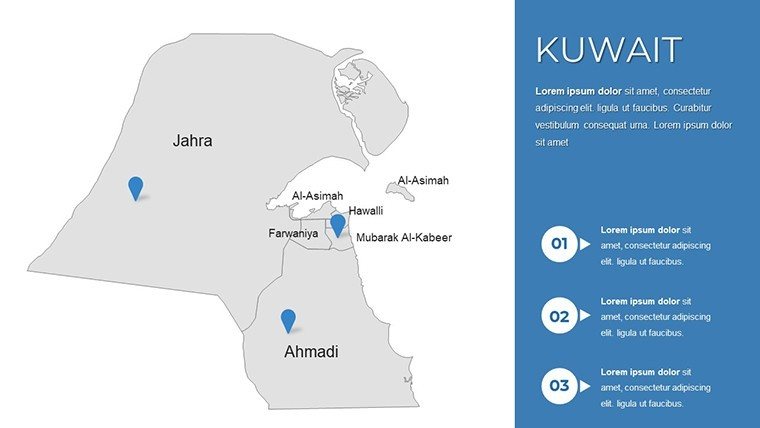
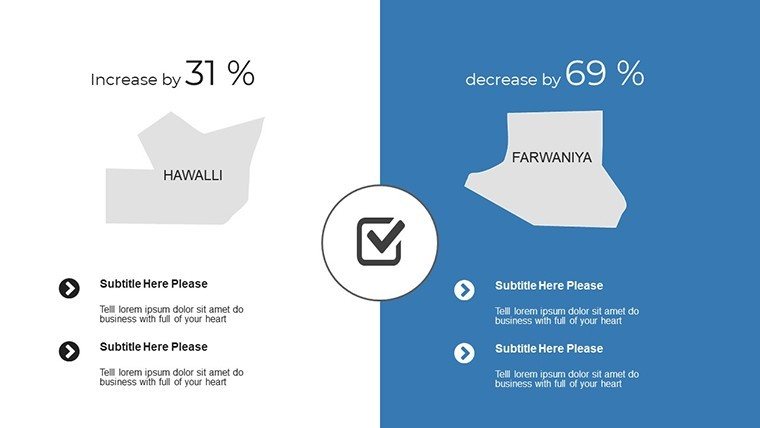
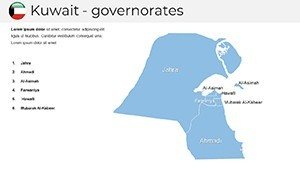
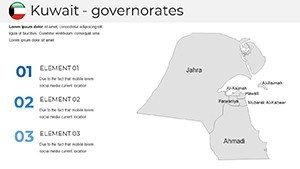
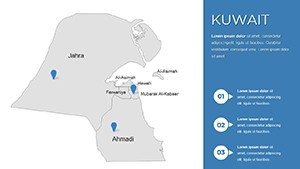
- Advanced Customization: Alter hues to denote economic sectors, label key areas like Jahra's agriculture, and integrate icons for infrastructure like the Sheikh Jaber Al-Ahmad Causeway.
- Superior Resolution: Scalable vectors ensure crisp displays, vital for detailing offshore platforms in energy sector briefings.
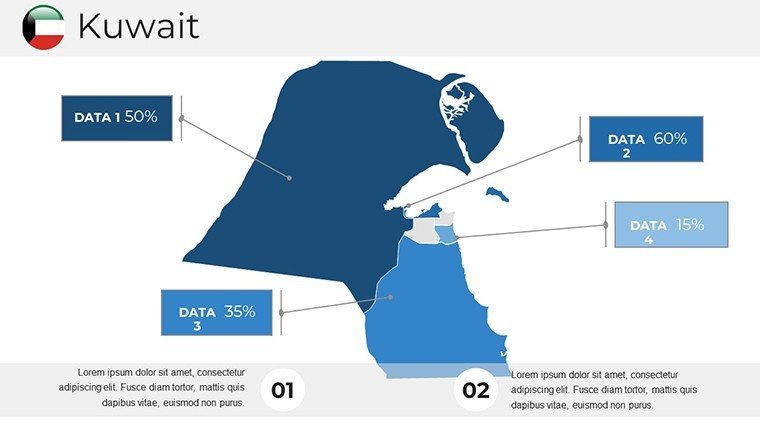
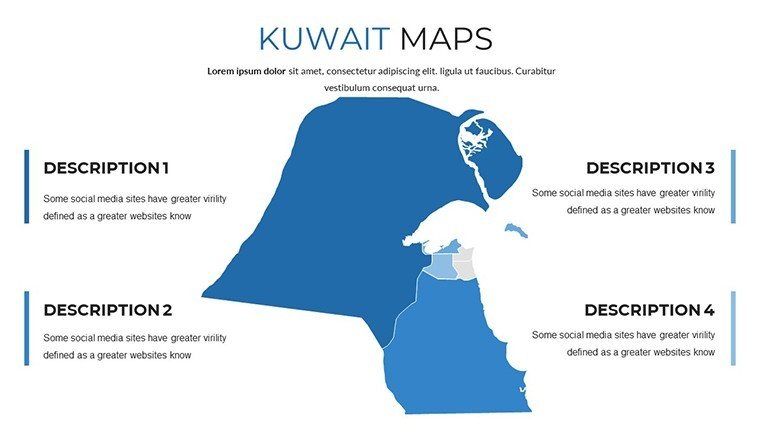
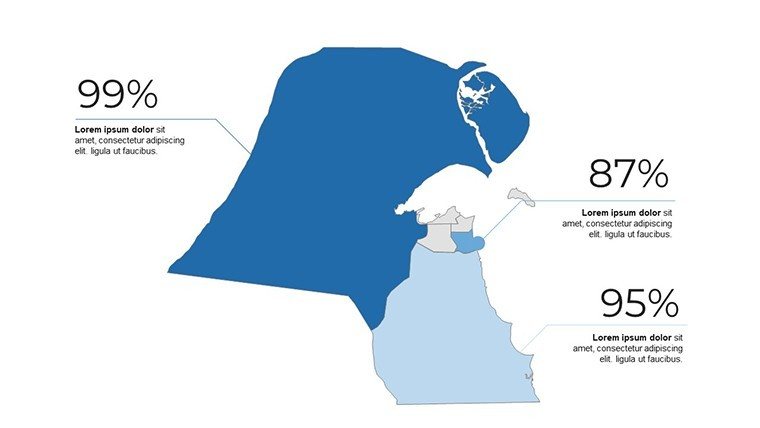
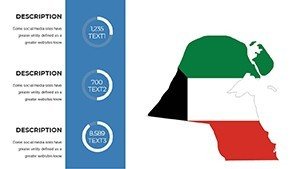
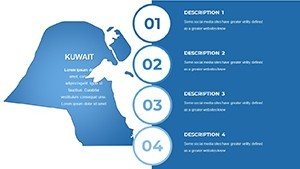
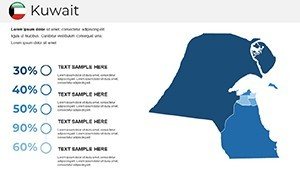
- Multiple Layout Variants: From minimalist economic overviews to vibrant market trend maps, including political and resource-focused types.
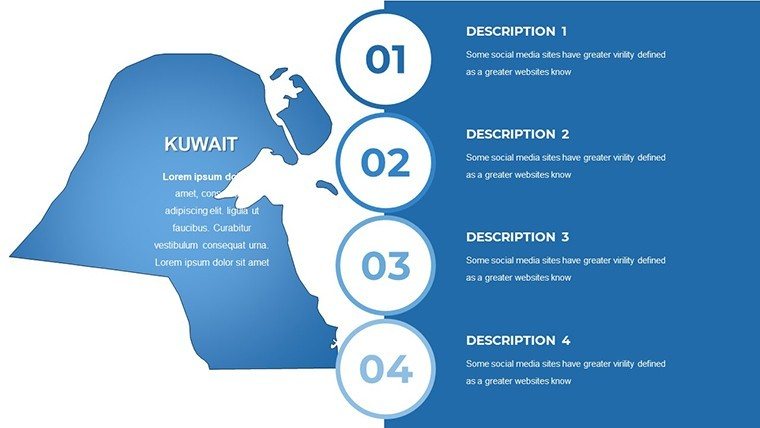
- Ease of Use: Simplified interface for quick edits, empowering teams to collaborate without design bottlenecks.
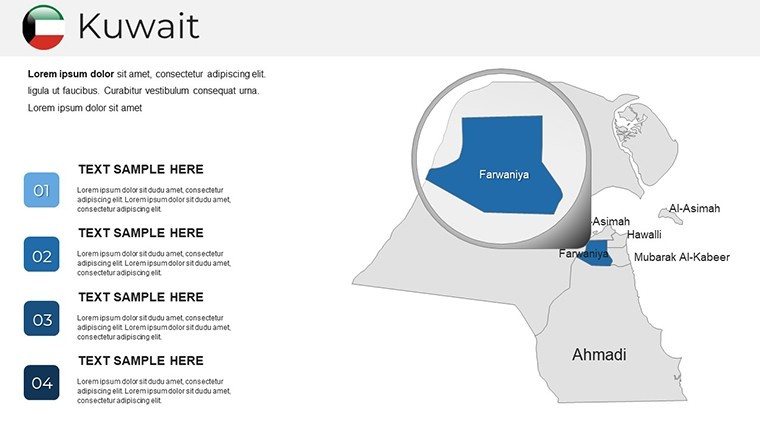
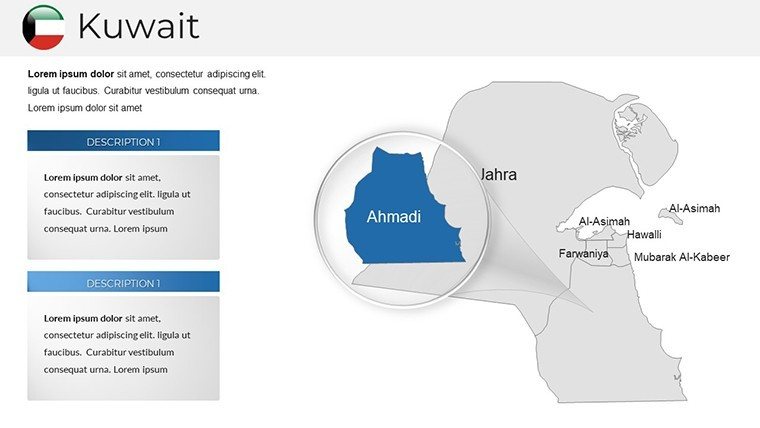
- Extensive Mapping: Encompasses urban districts to rural expanses, ideal for urban development plans under Kuwait's National Development Plan.
Such capabilities shine in scenarios like a consulting firm's use of these maps to secure funding by illustrating growth projections, as per case studies from similar tools in the region.
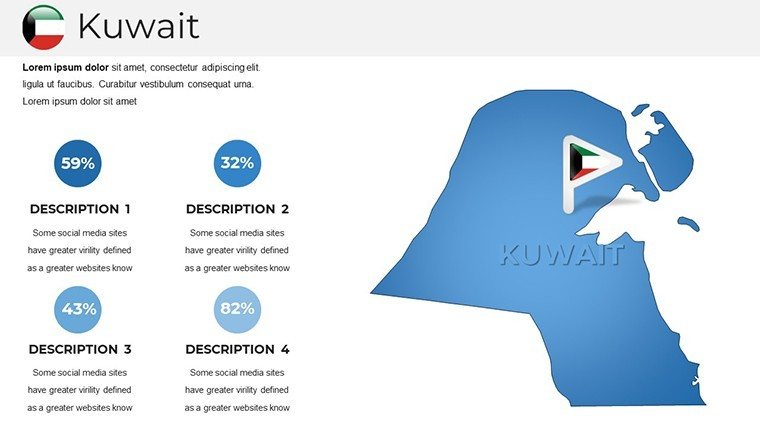
Tailored Applications: Empowering Kuwait-Centric Narratives
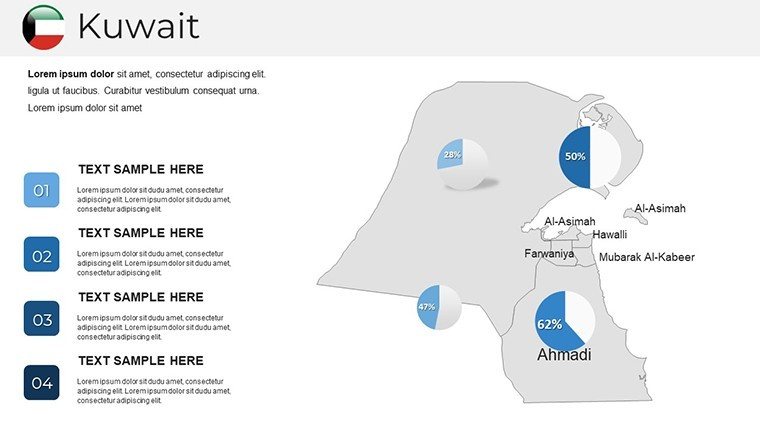
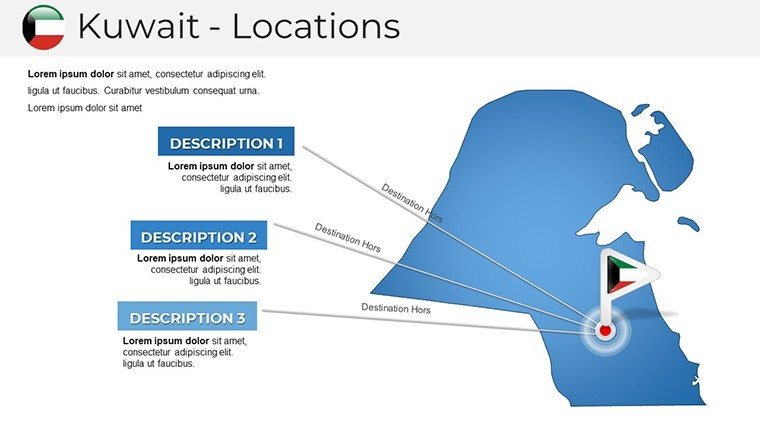
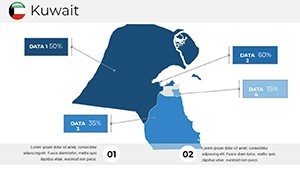
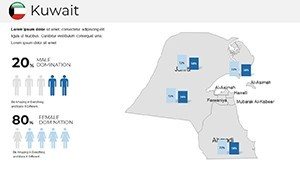
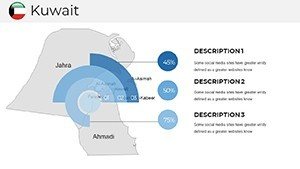
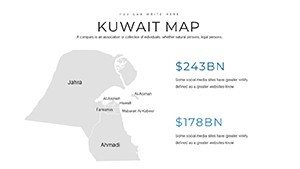
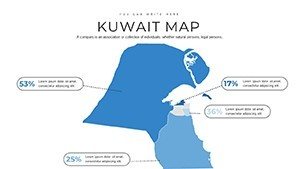
Apply the template across scenarios to address specific challenges. Begin with an overview slide, then drill down into data-rich visuals for investor meetings, showcasing FDI trends with color gradients.
Workflow Optimization Guide
- Initialize and Adapt: Import the file, choose a layout, and modify for seasonal oil price fluctuations in presentations.
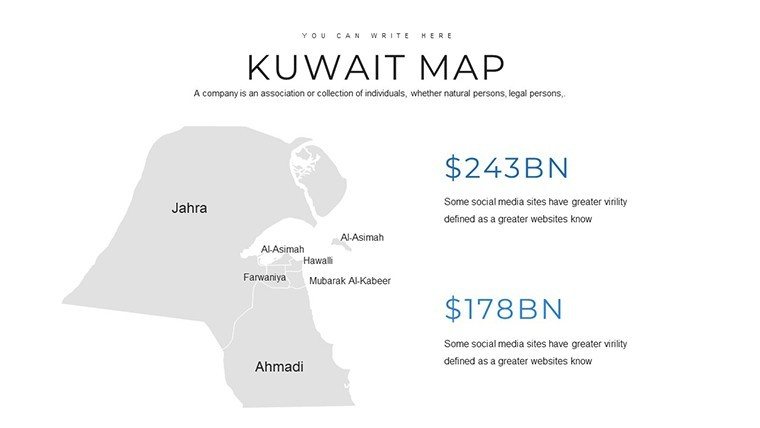
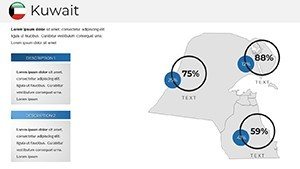
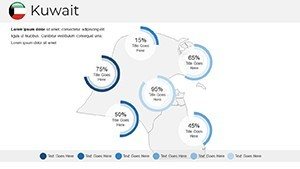
- Incorporate Analytics: Embed charts for metrics like GDP per capita, sourced from Kuwait Central Statistical Bureau.
- Dynamic Enhancements: Add transitions to simulate market shifts, engaging viewers in economic forecasts.
- Polish and Execute: Test for device compatibility, then present with assurance in boardrooms or webinars.
Outperforming default PowerPoint options, this template's interactive features help in contrasting Kuwait's diversification efforts, resolving clarity issues in complex data sets.
Pro Tips for Kuwait Map Mastery
Leverage insights from visualization experts like those at the Gulf Research Center: employ consistent scales for comparative maps, use bold contrasts for highlighting reforms post-Arab Spring. For business pitches, integrate QR codes linking to live data, adding interactivity. Refresh content with updates on mega-projects like Boubyan Island development to maintain relevance.
This template redefines how you present Kuwait's story, blending precision with persuasion. Whether analyzing real estate booms or educational curricula, it's your key to standout deliveries. Elevate your next session - download and customize without delay.
Frequently Asked Questions
What level of customization do the Kuwait maps offer?
Complete flexibility: edit colors, add annotations, and reshape elements to suit precise business or educational needs.
Can I use this in collaborative settings?
Yes, fully compatible with shared editing in Google Slides or PowerPoint Online for team inputs.
Are economic data overlays supported?
Absolutely, integrate charts and graphs seamlessly for comprehensive economic visualizations.
Is it suitable for high-resolution prints?
Vector-based design ensures quality for both digital and printed materials.
How do I handle large-scale projections?
Built-in scalability maintains detail, perfect for conference settings.