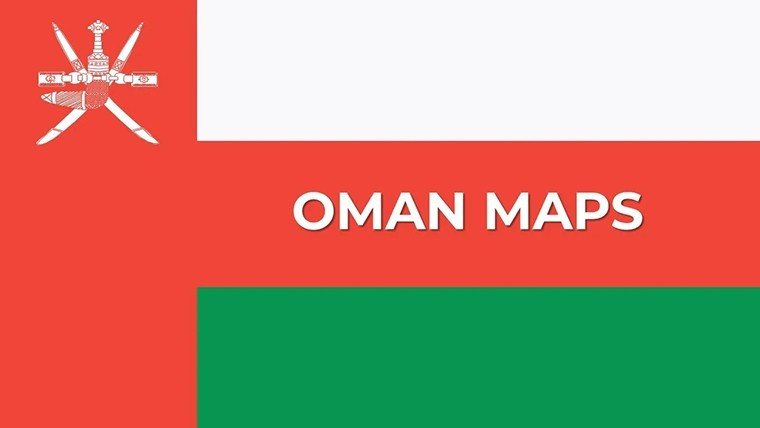
Fully Editable Oman Maps PowerPoint Template | Instant Download


Type: PowerPoint Maps template
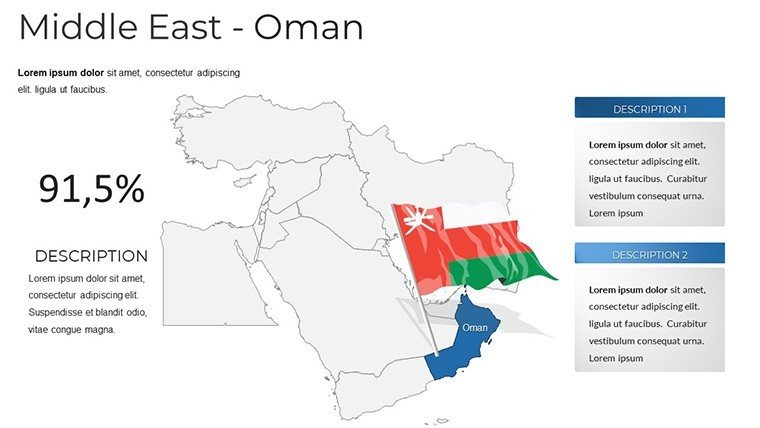
Category: Middle East
Sources Available: .potx
Product ID: PM00208
Template incl.: 37 editable slides
Elevate your presentations with accurate, professional maps of Oman using this fully editable PowerPoint template. With 37 slides designed for clear geographical visualization, this template helps you present complex data with precision and visual impact.
Ideal for business analysts, educators, tourism professionals, and consultants who need customizable, high-quality map slides to engage their audience effectively.
Key Features
- 37 Fully Editable Slides: Complete flexibility to adapt every element to your needs.
- Vector-Based High-Resolution Maps: Scalable graphics that remain sharp at any size.
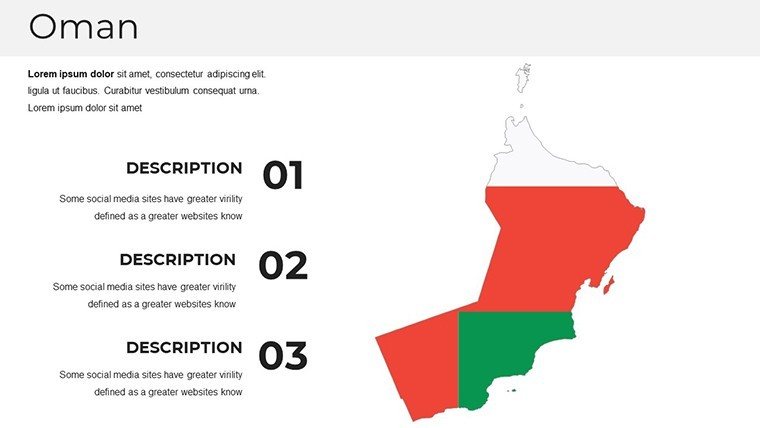
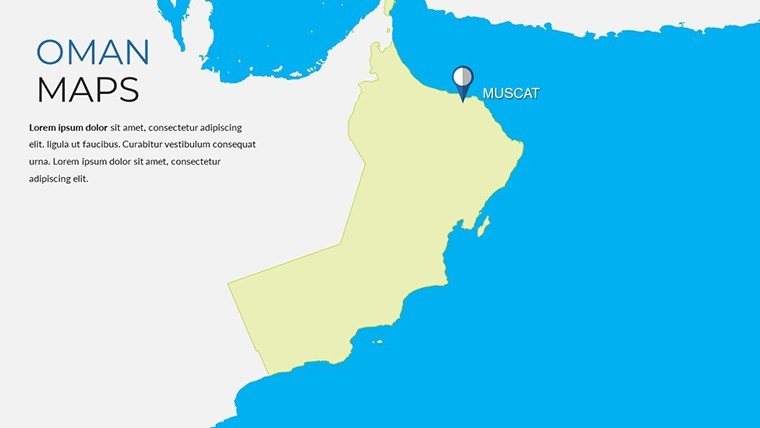
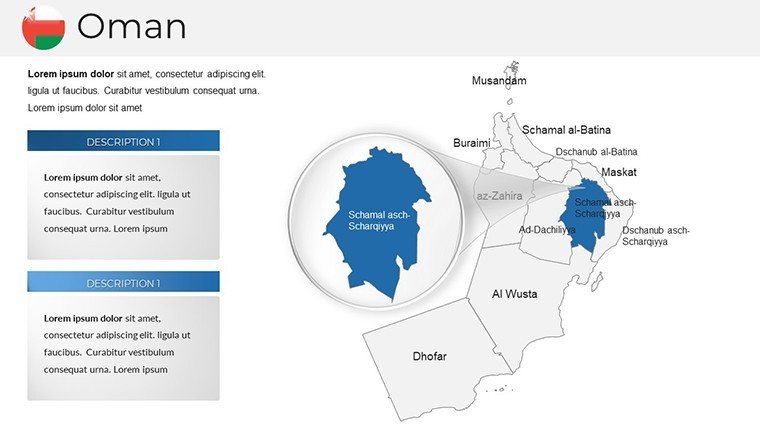
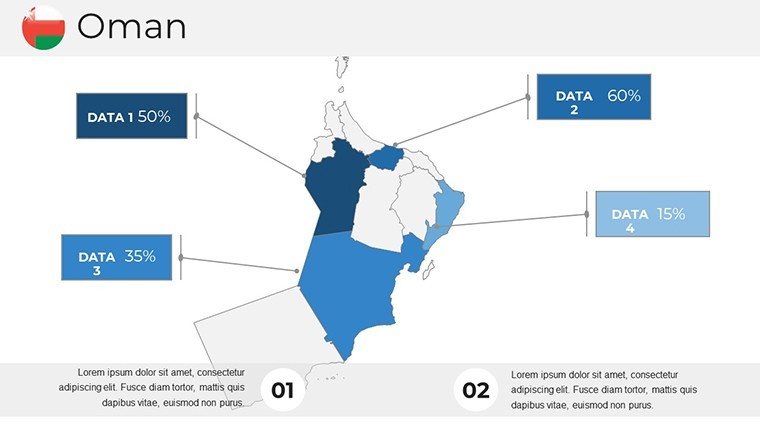
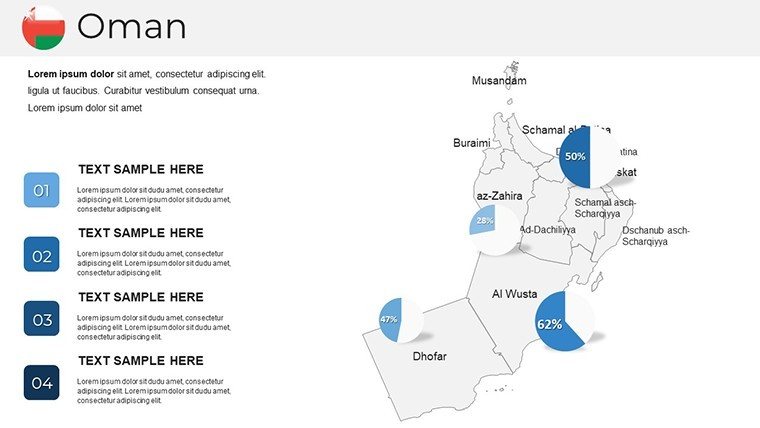
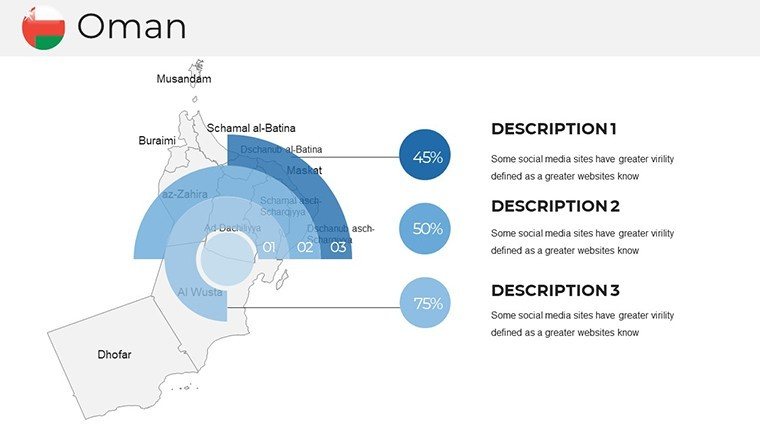
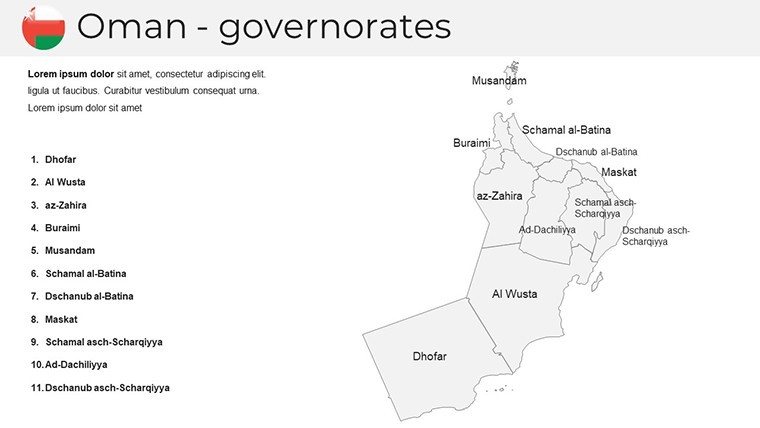
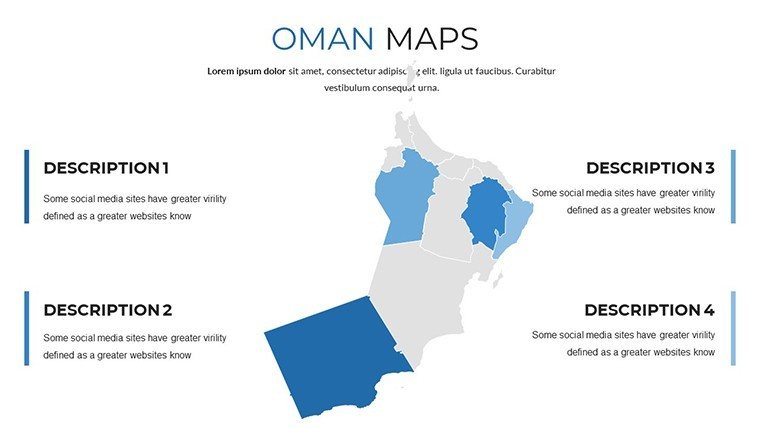
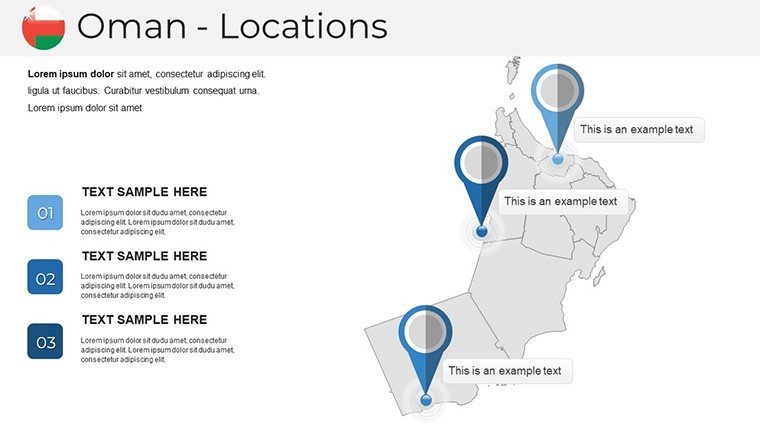
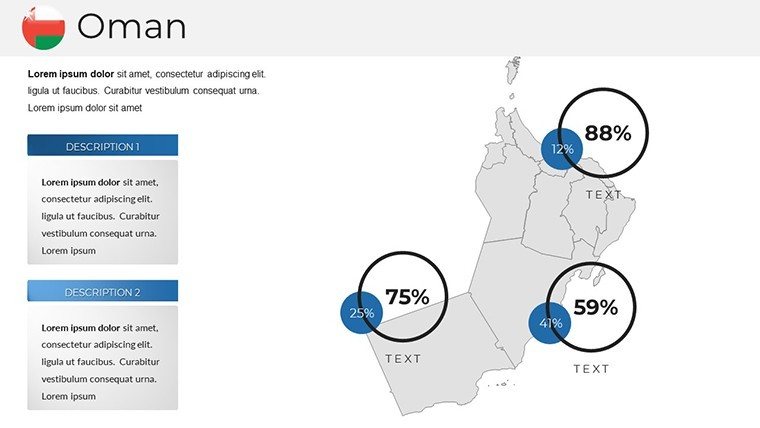
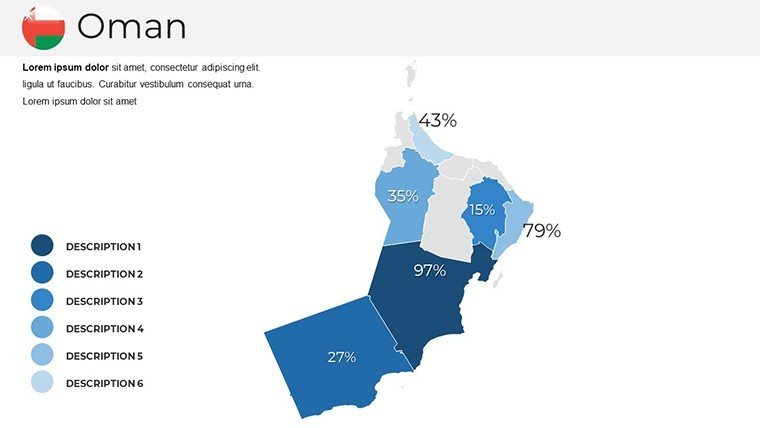
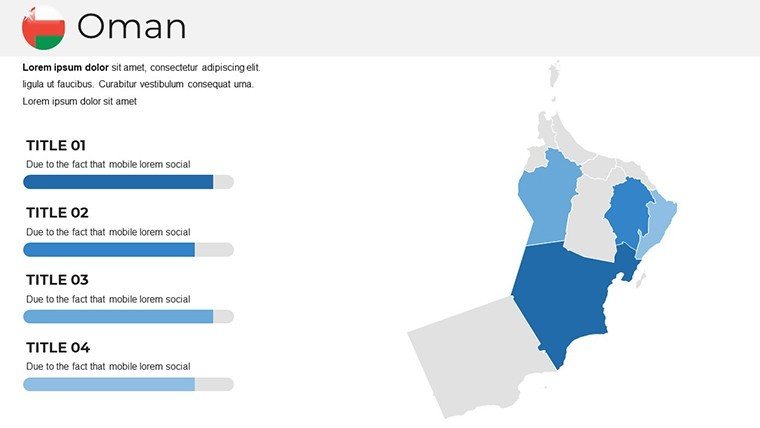
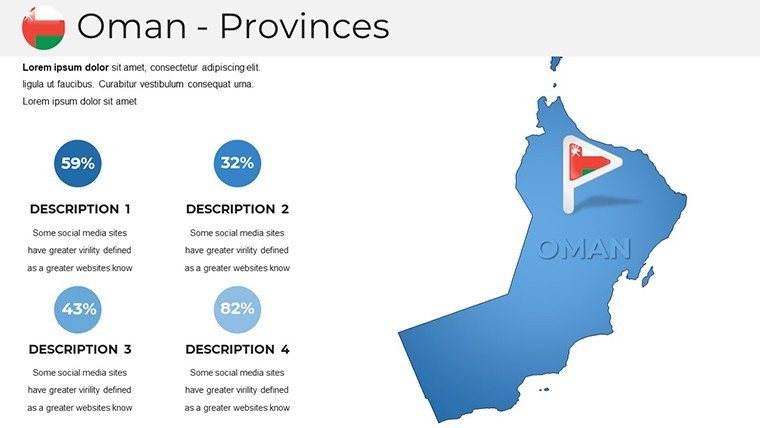
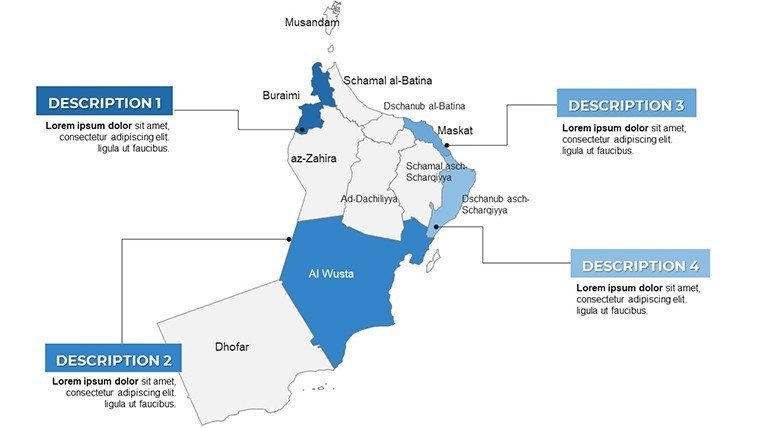
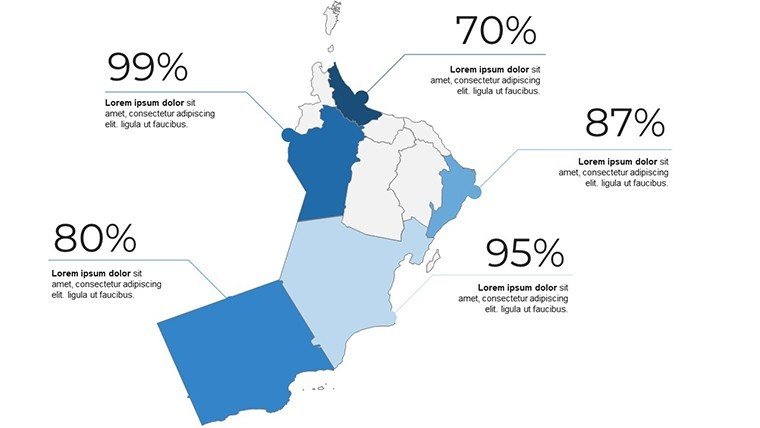
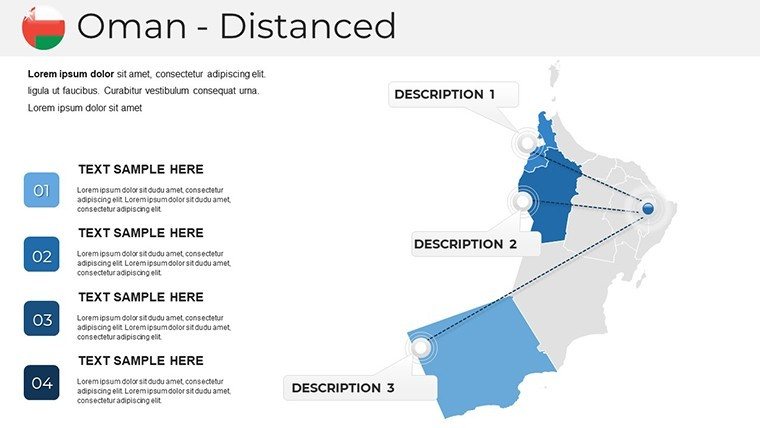
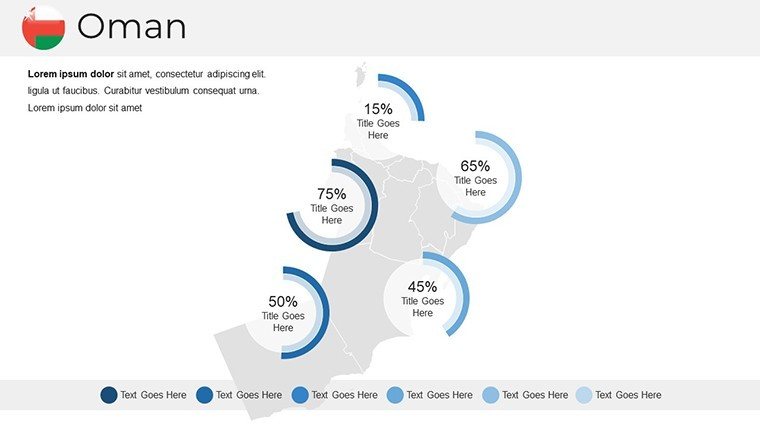
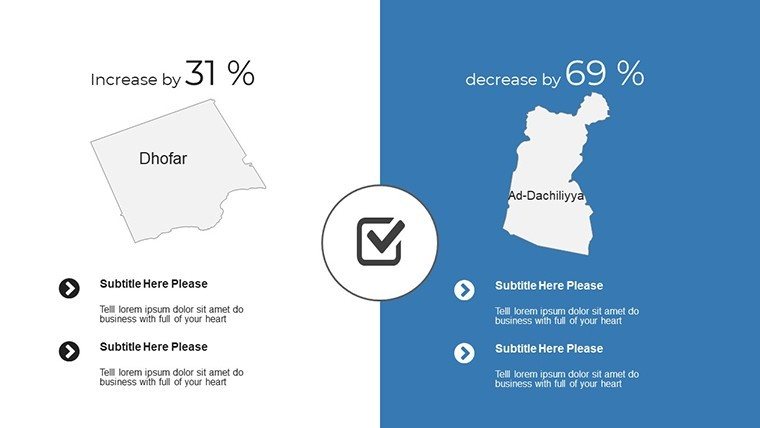
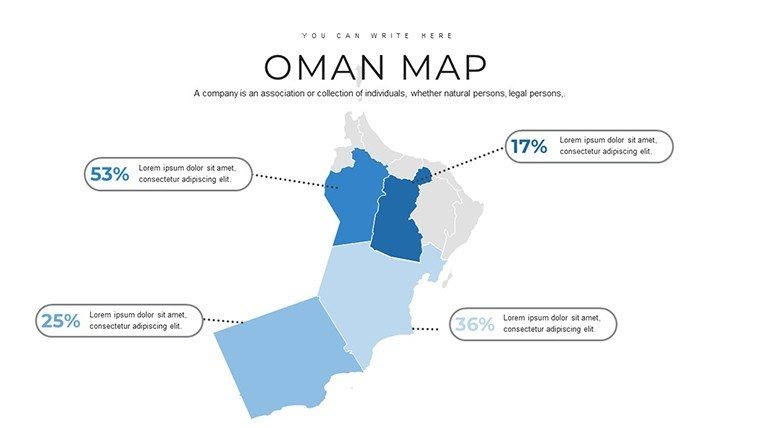
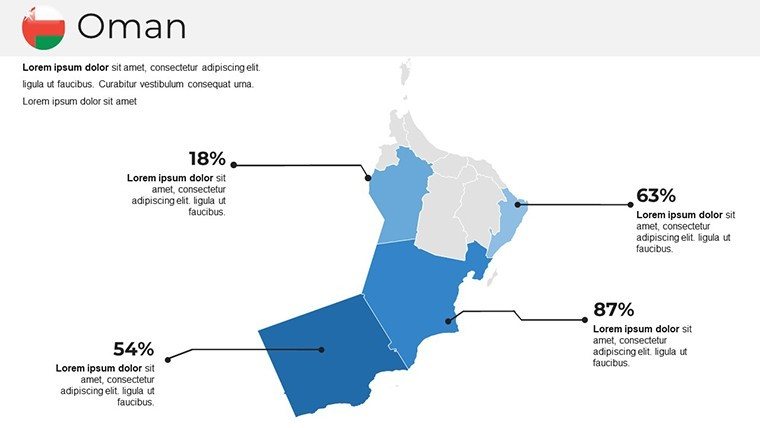
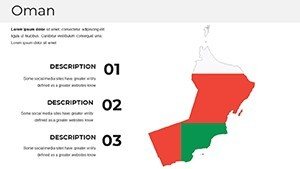
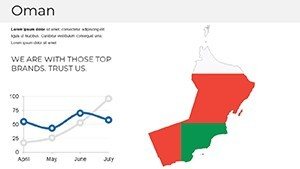
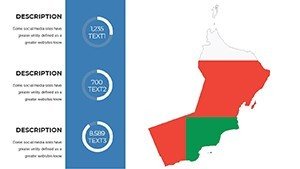
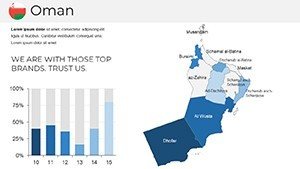
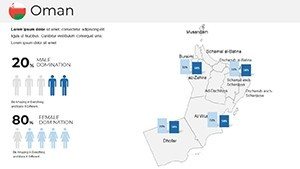
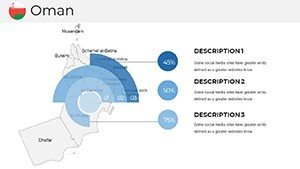
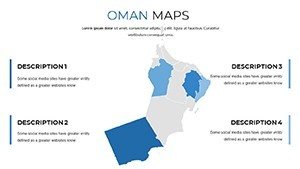
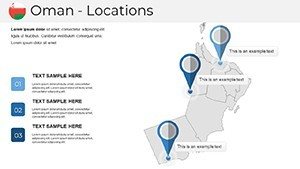
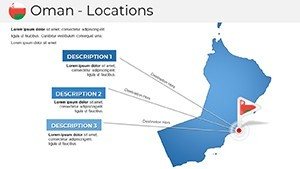
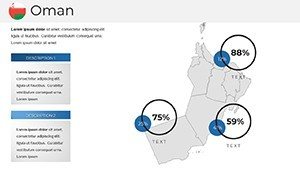
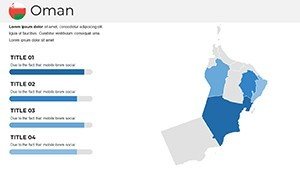
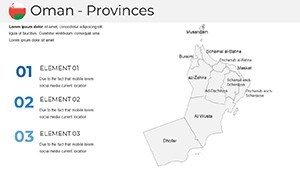
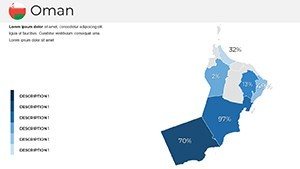
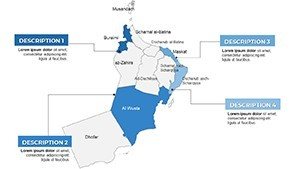
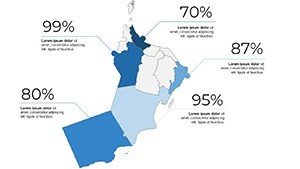
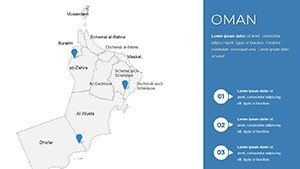
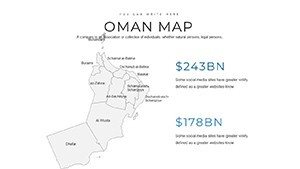
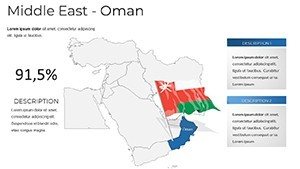
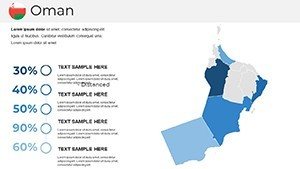
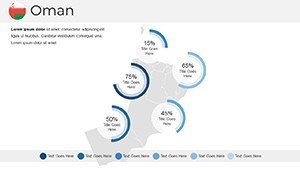
- Diverse Map Types: Political boundaries, physical terrain, and thematic overlays for data visualization.
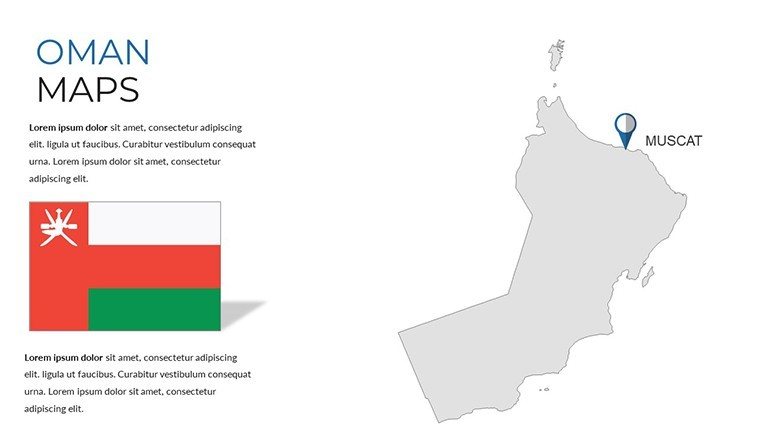
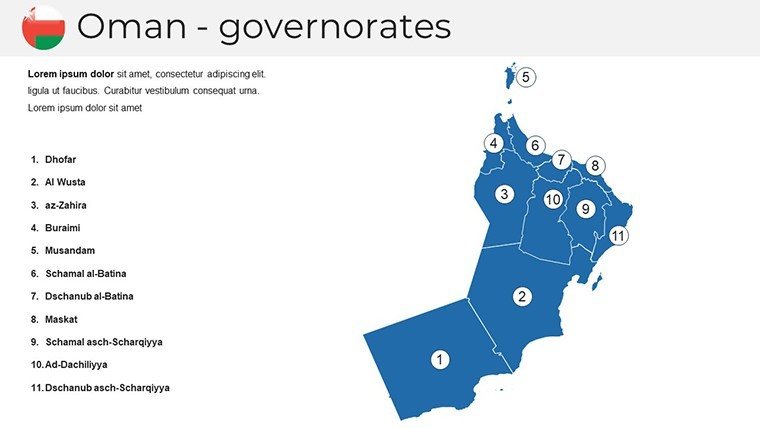
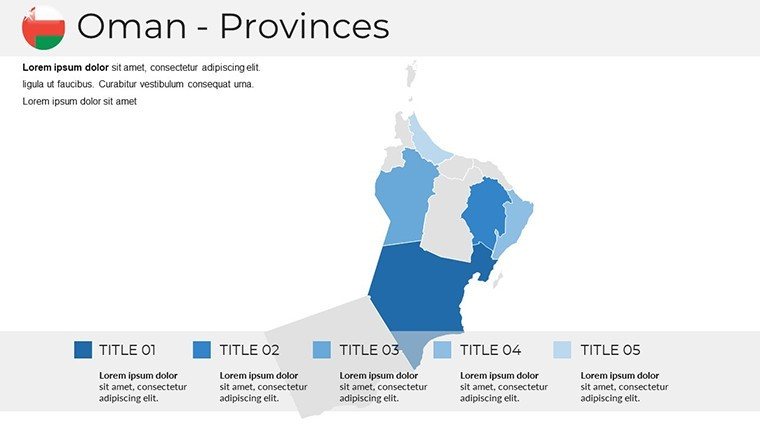
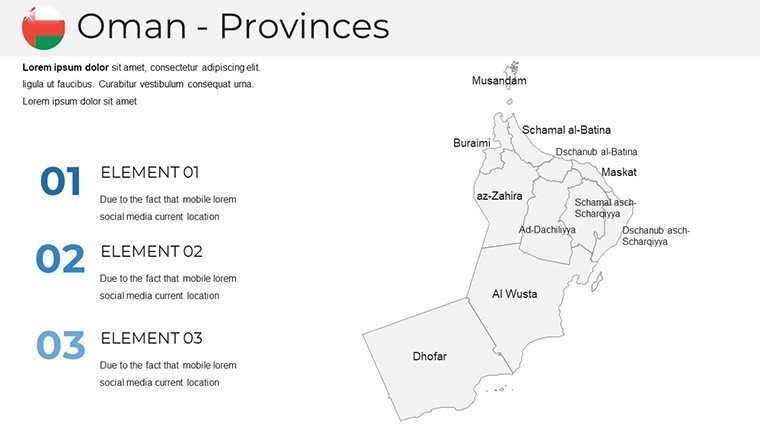
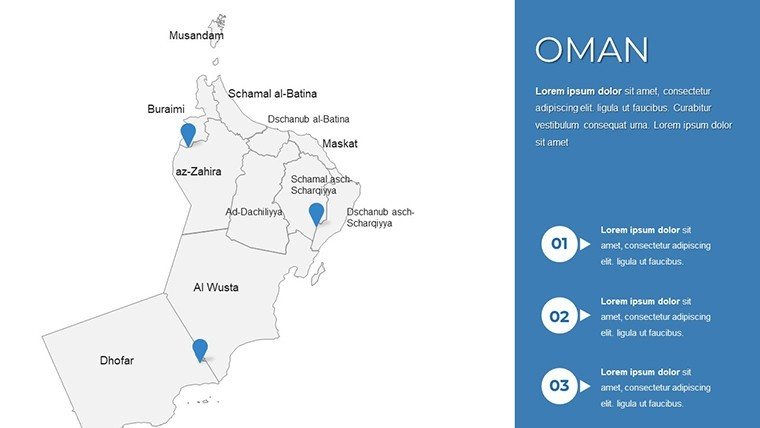
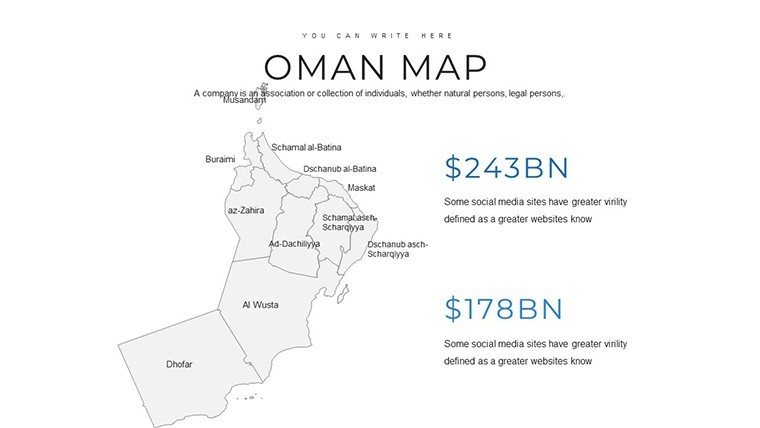
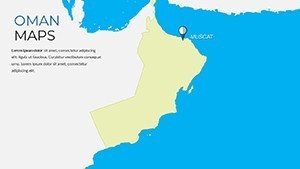
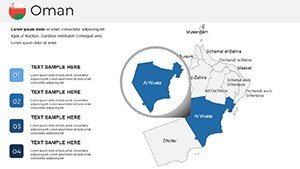
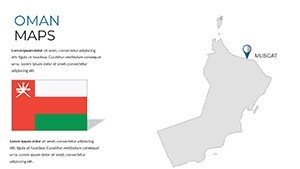
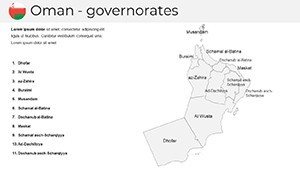
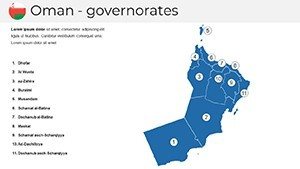
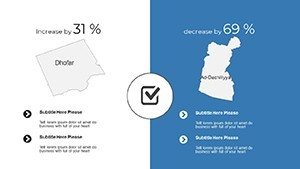
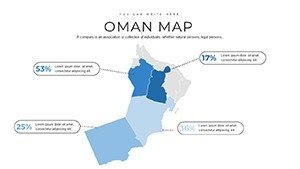
- Comprehensive Regional Coverage: National overviews and detailed governorate maps, including key areas like Muscat and Dhofar.
- Compatible with PowerPoint and Google Slides: Seamless editing in your preferred platform.
Professional Use Cases
This Oman maps template supports a wide range of real-world applications:
- Business & Consulting: Highlight economic zones, trade routes, or infrastructure projects in reports or client pitches aligned with Oman Vision 2040.
- Education: Enrich geography, history, or cultural lessons with accurate and engaging visual aids.
- Tourism Promotion: Showcase regions, attractions, and itineraries to market Oman's diverse landscapes and heritage.
- Government & Planning: Support policy discussions or urban development presentations with clear territorial visuals.
- Internal Operations: Map resource allocation or regional performance metrics in corporate reviews.
Transform geographical data into compelling narratives that drive understanding and decisions.
How to Customize
No advanced skills required - edit quickly and easily:
- Open the downloaded file in PowerPoint or Google Slides.
- Select map elements to change colors, add labels, or overlay data points.
- Insert your own text, icons, or branding elements.
- Resize or rearrange freely without quality loss.
Create polished, tailored presentations in minutes - download this versatile Oman maps template today.
Frequently Asked Questions
Is this template compatible with Google Slides?
Yes, the template is fully compatible with both Microsoft PowerPoint and Google Slides for seamless editing.
How many slides are included?
The template contains 37 fully editable slides with various Oman map layouts.
Can I customize colors, labels, and other elements?
Yes, all elements are fully editable vector graphics. Adjust colors to match your brand, add custom labels, resize, and modify as needed without quality loss.
What types of maps are included?
The template includes political maps, physical terrain maps, thematic maps for data overlays, and detailed regional/governorate views.
Is the download instant after purchase?
Yes, you receive immediate access to download the .PPTX file right after completing your purchase.