Peru PowerPoint Map Template - Professional & Fully Editable

Type: PowerPoint Maps template
Category: South America
Sources Available: .pptx
Product ID: PM00200
Template incl.: 36 editable slides
Scalable Peru Geographic Templates for Professional Reporting
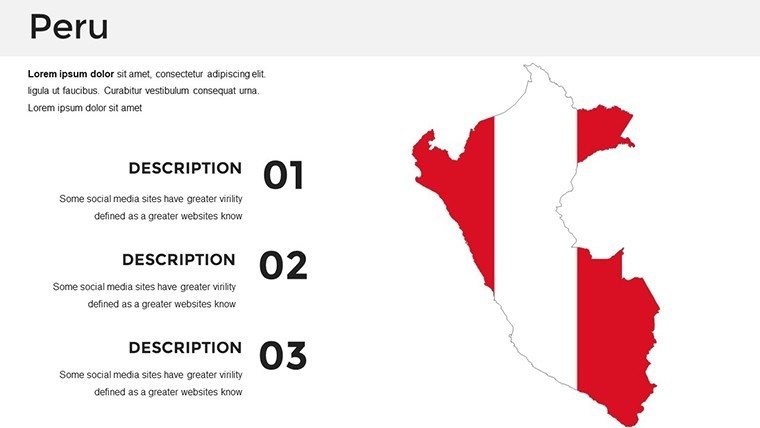
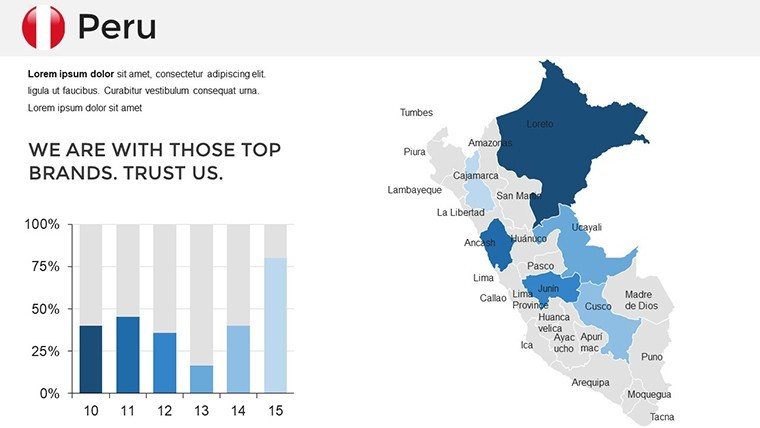
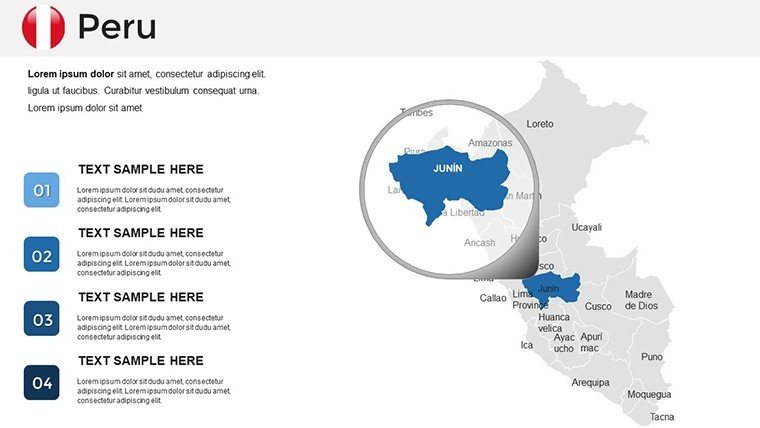
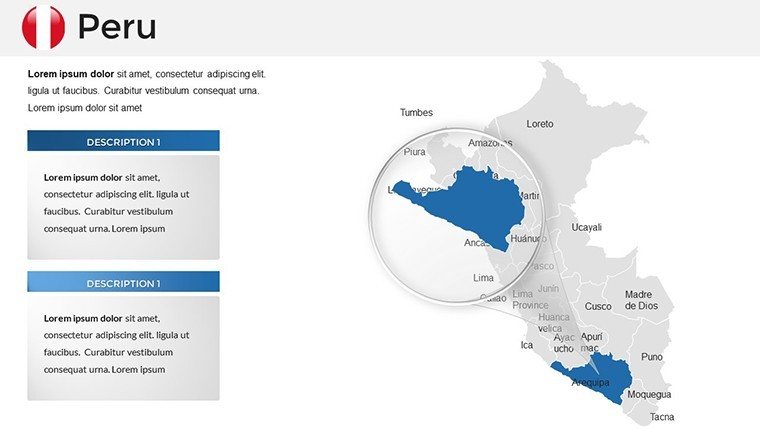
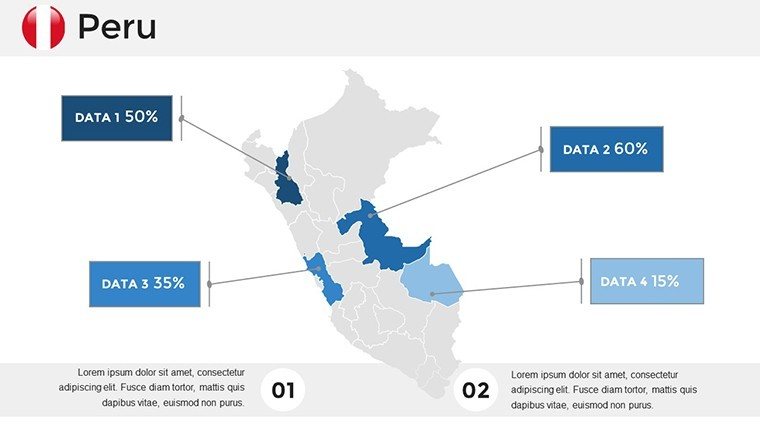
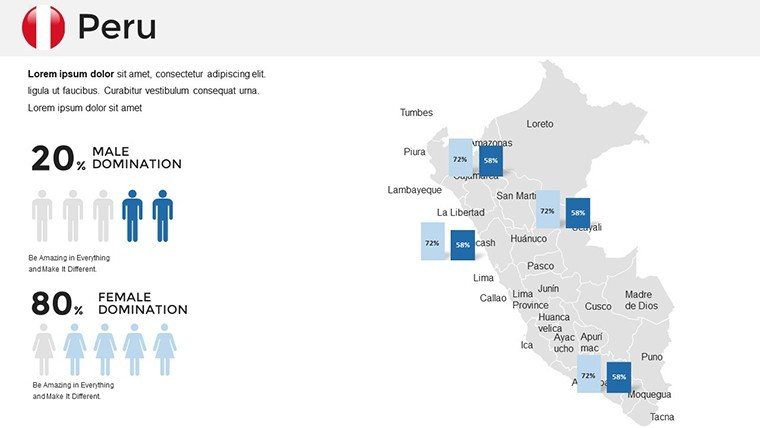
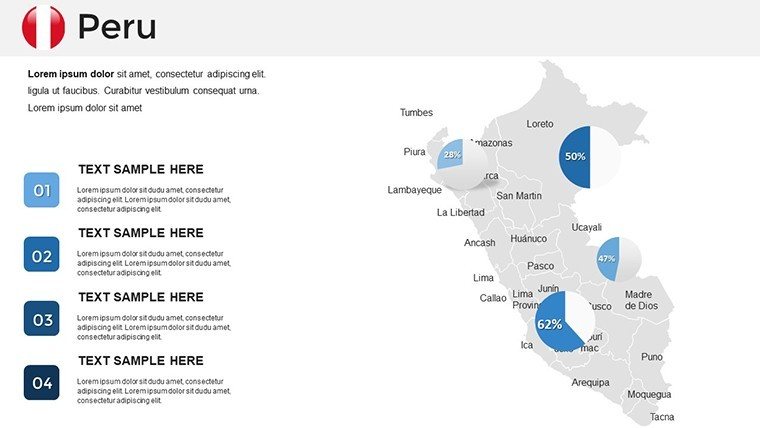
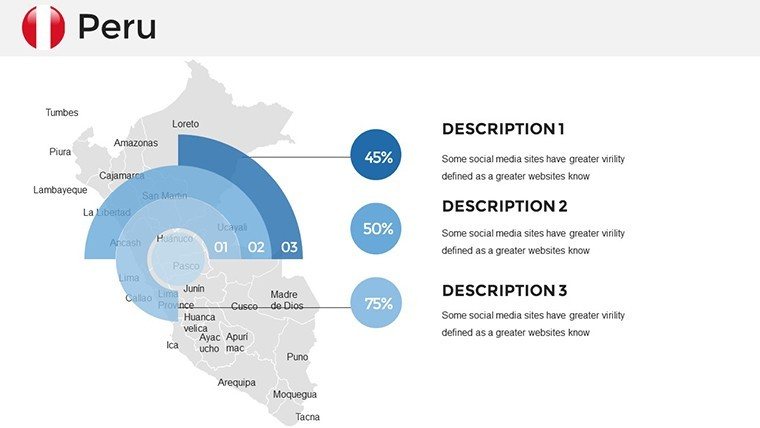
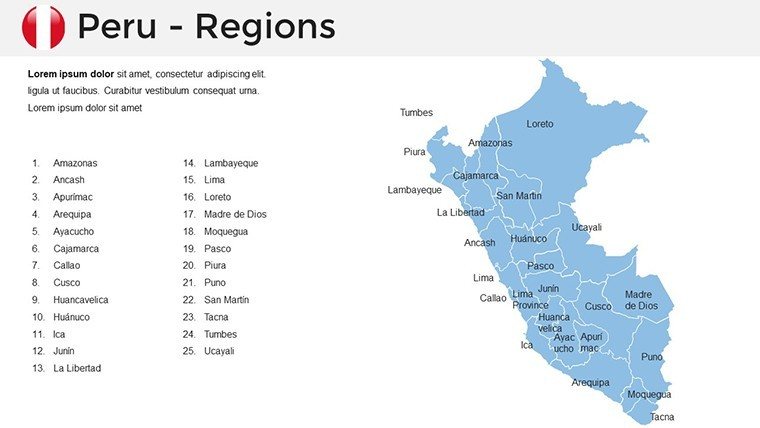
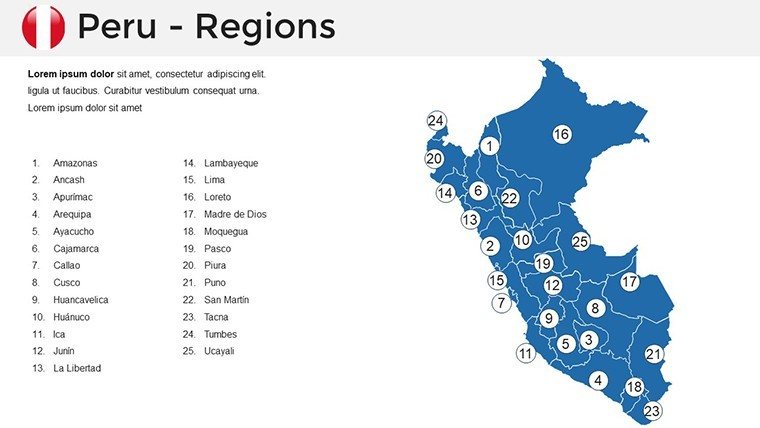
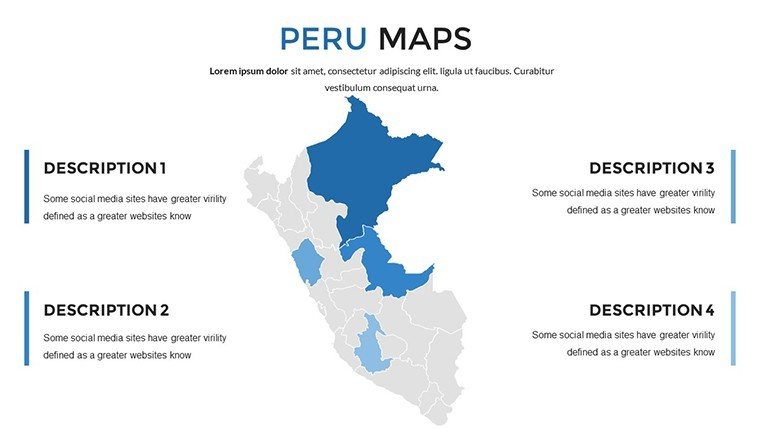
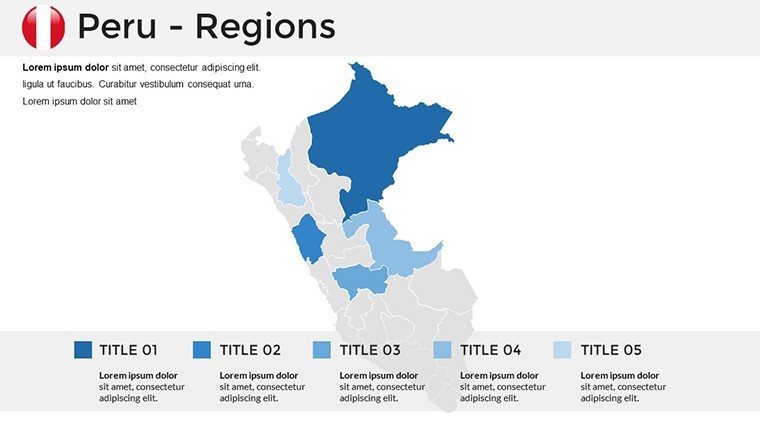
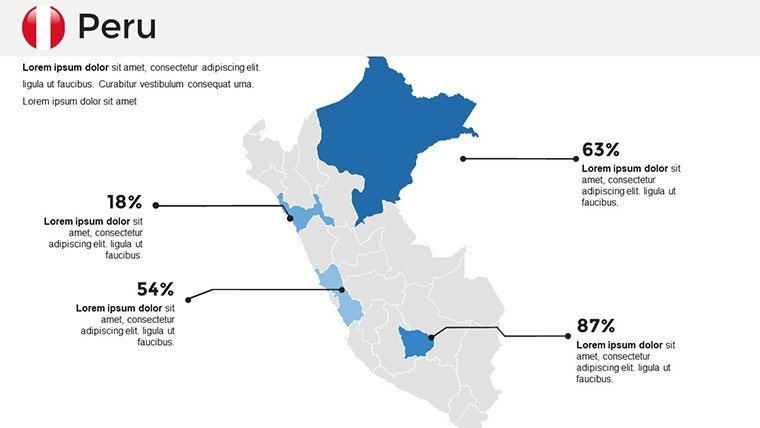
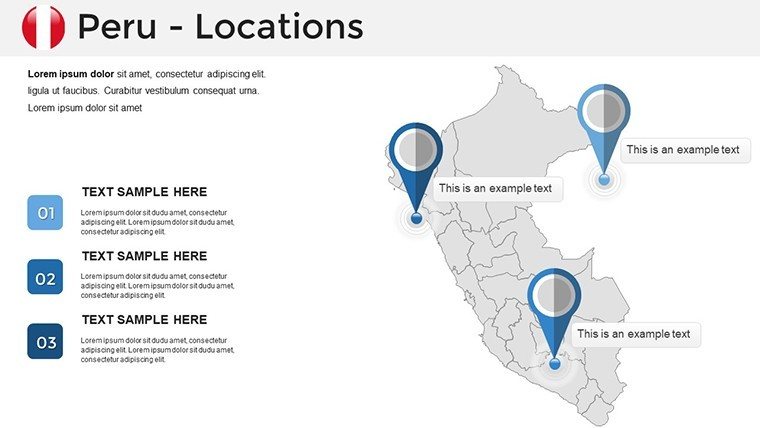
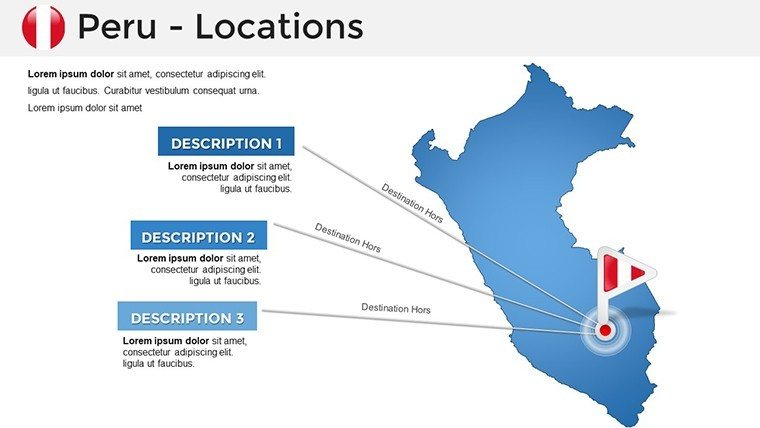
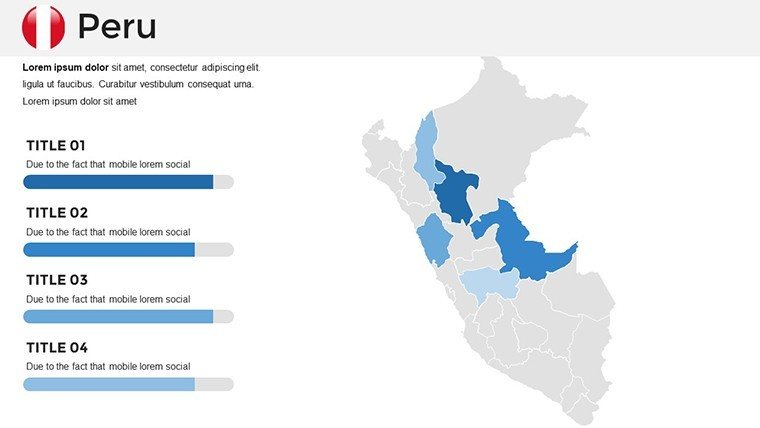
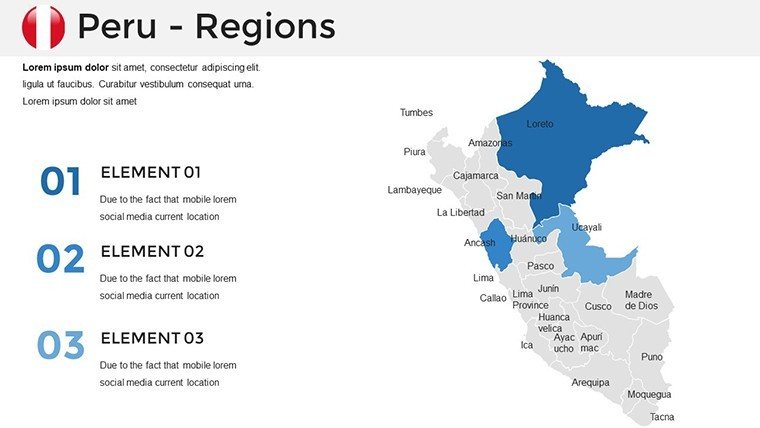
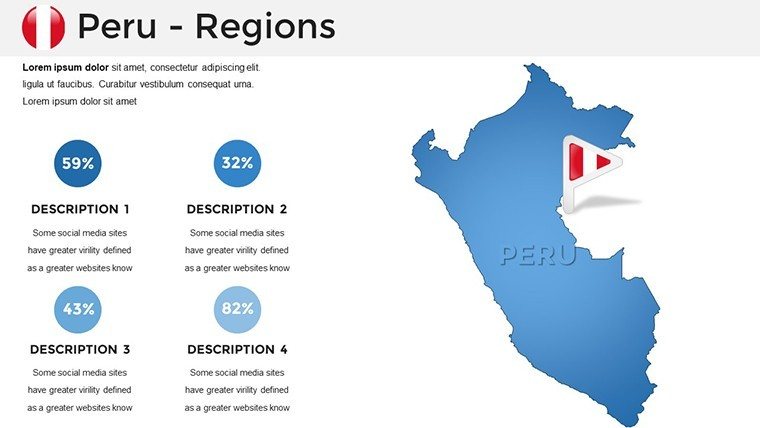
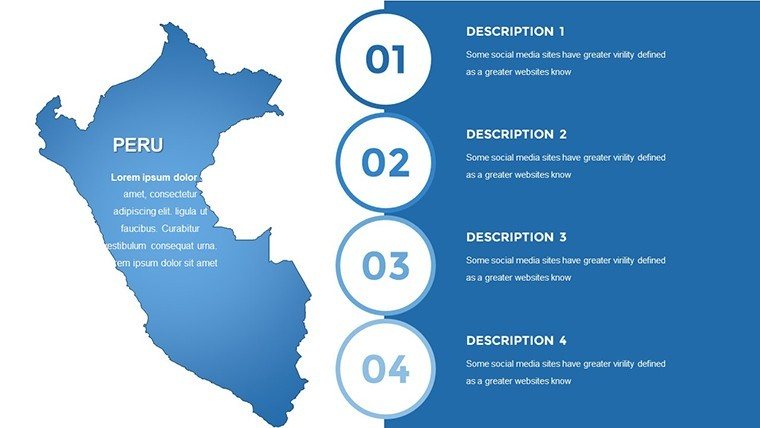
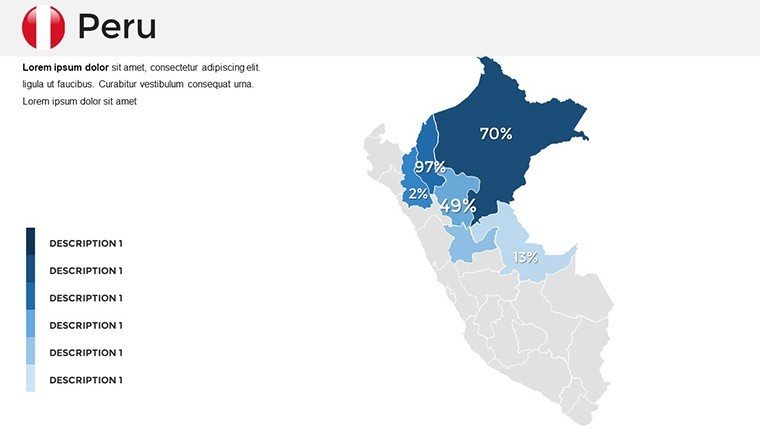
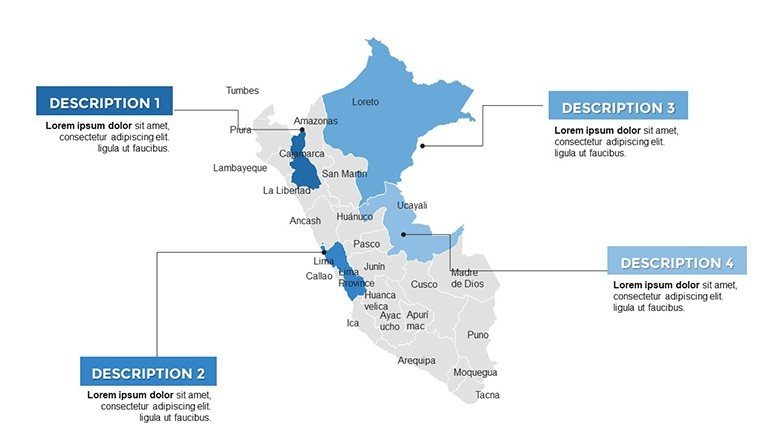
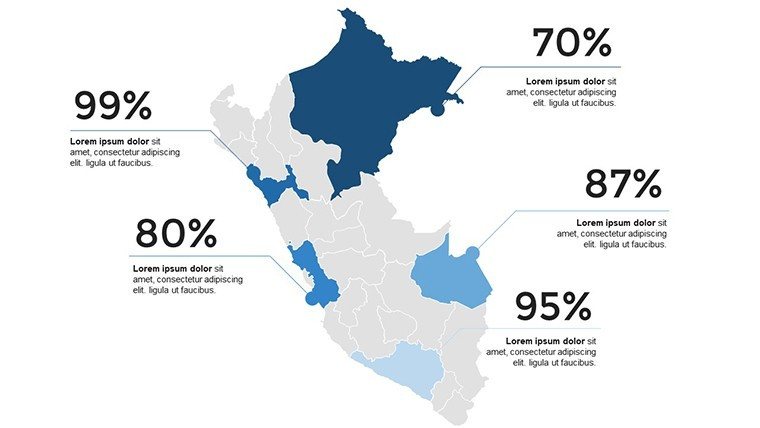
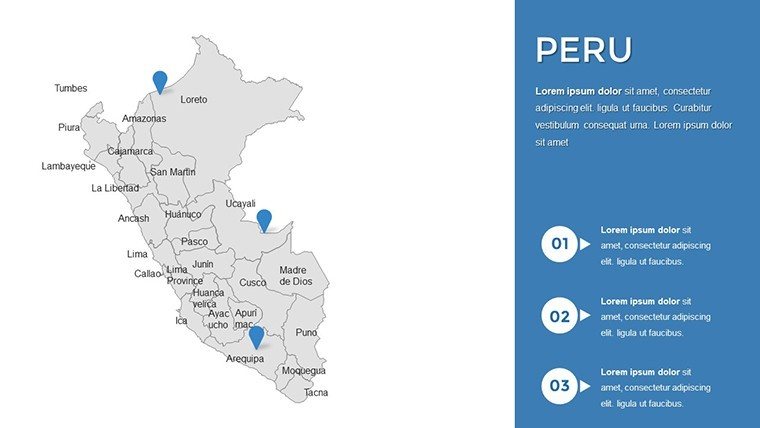
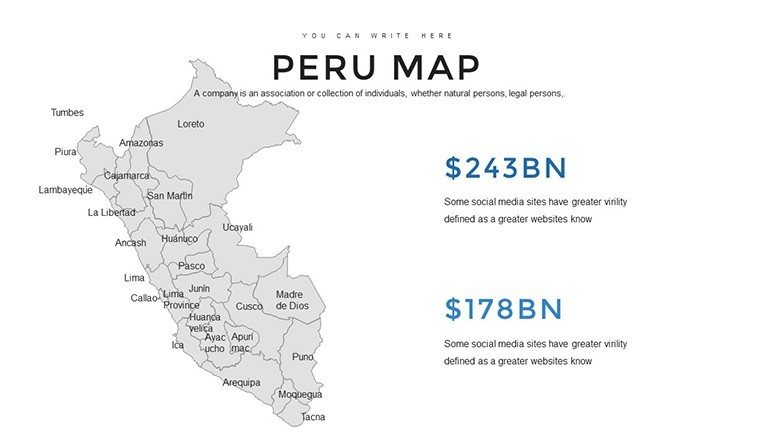
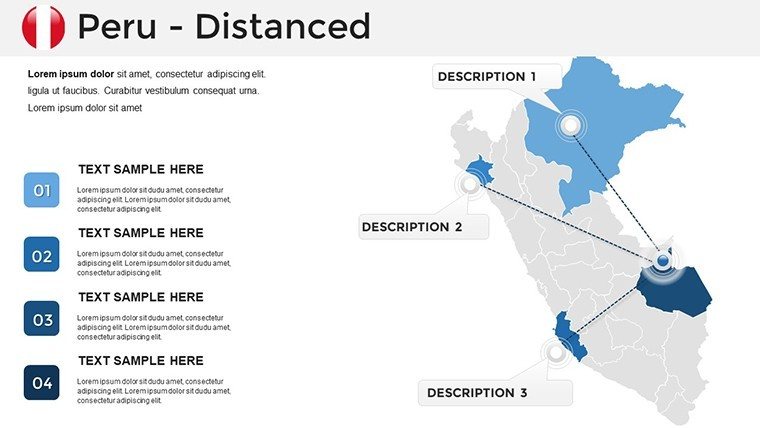
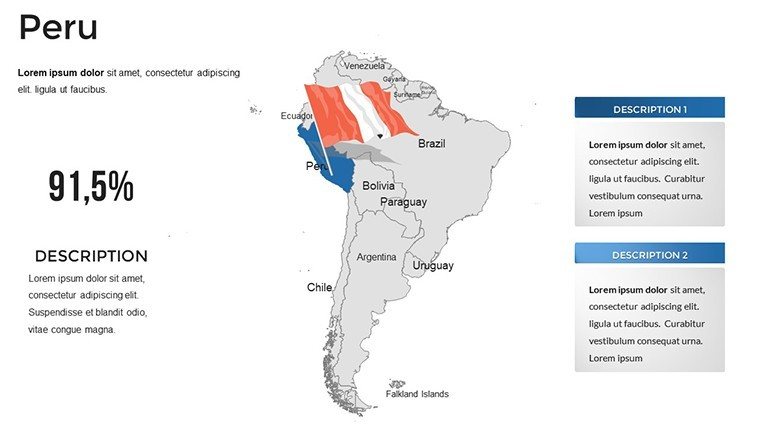
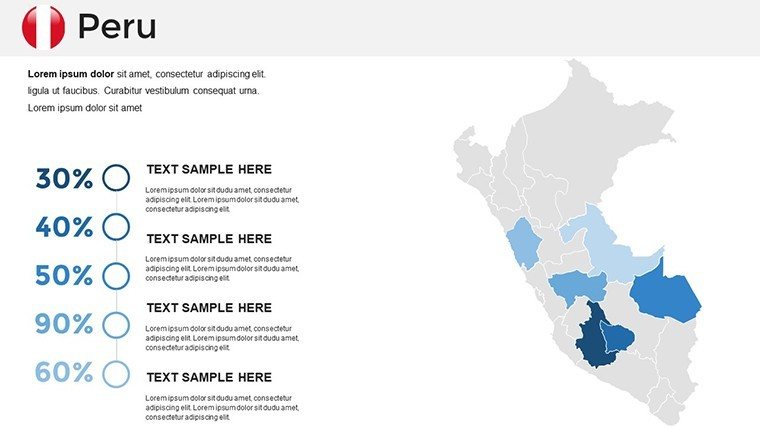
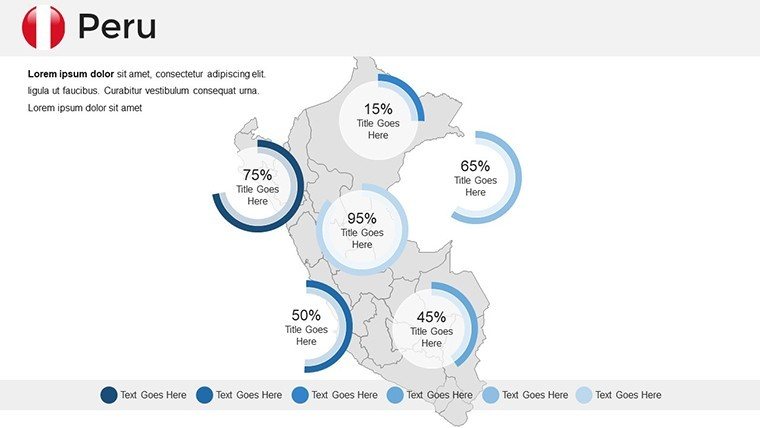
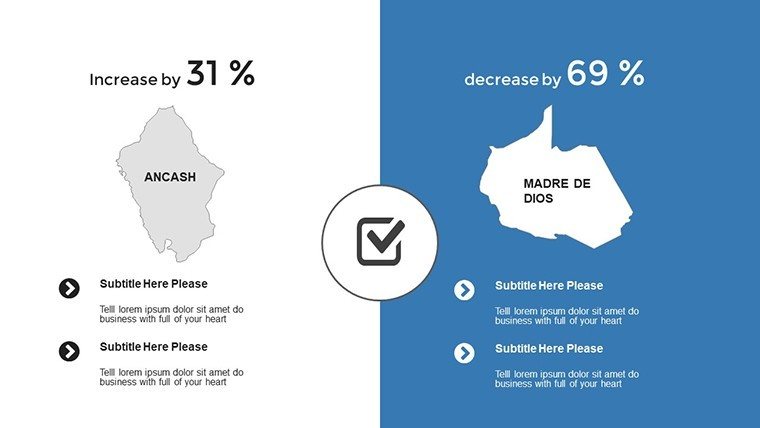
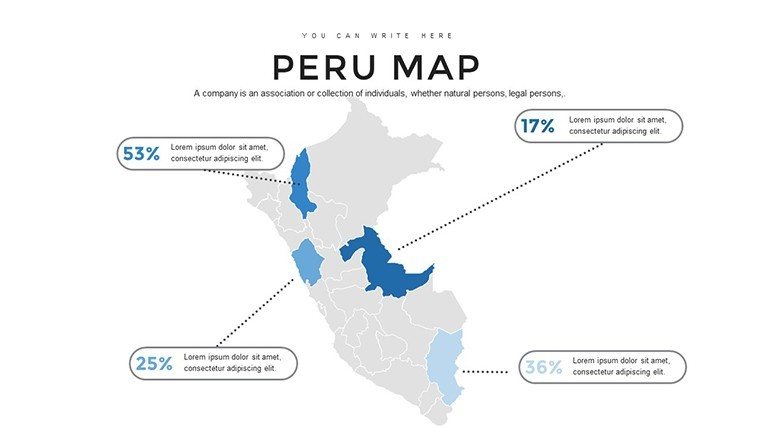
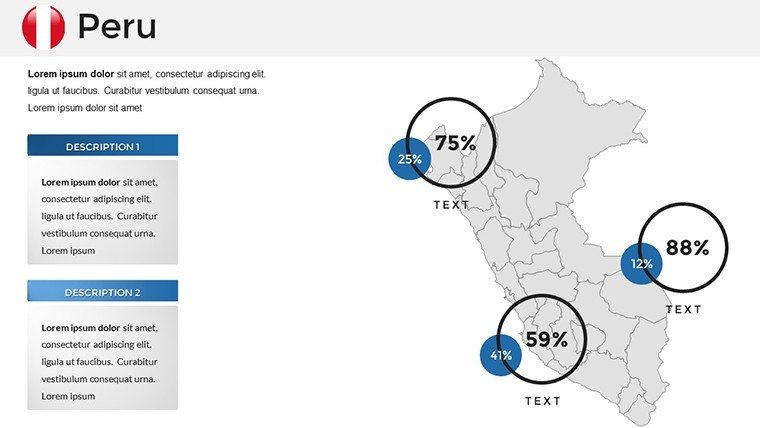
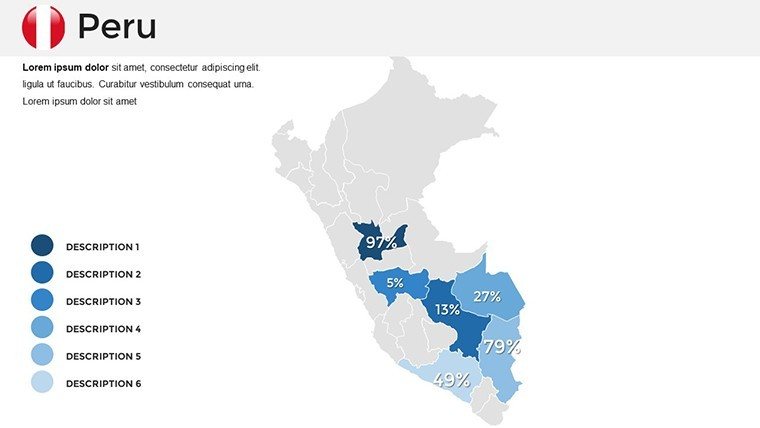
Elevate your South American business presentations with our Peru PowerPoint map template. Featuring 36 meticulously crafted slides based on IGN Peru data, this deck allows you to visualize the 25 administrative regions with pinpoint accuracy. It is the ideal tool for mining executives presenting environmental compliance in the highlands, or marketing agencies mapping consumer demographics in Lima and Arequipa. Every region is a separate vector element, making it easy to color-code data sets for regional performance reviews.
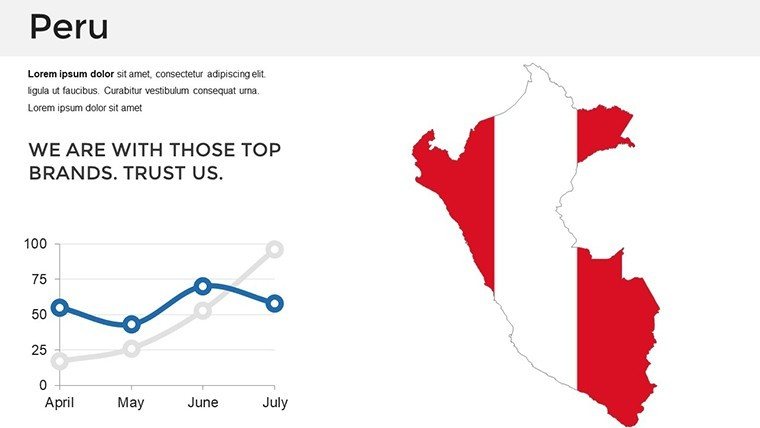
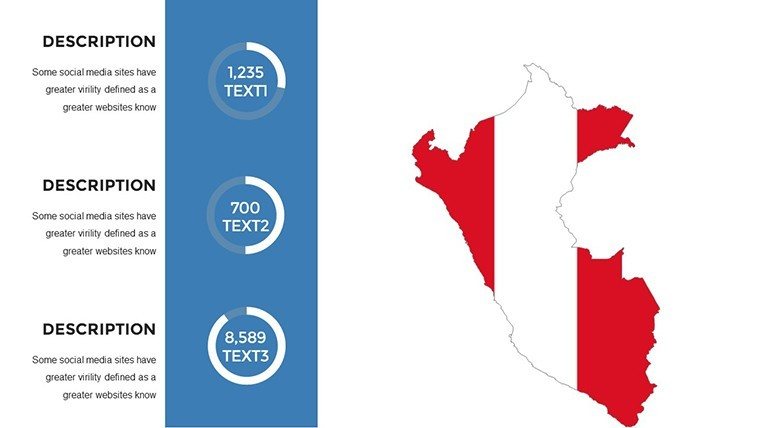
- Economic Data Mapping: Use the built-in infographics to show export statistics from coastal trade zones versus Amazonian resources.
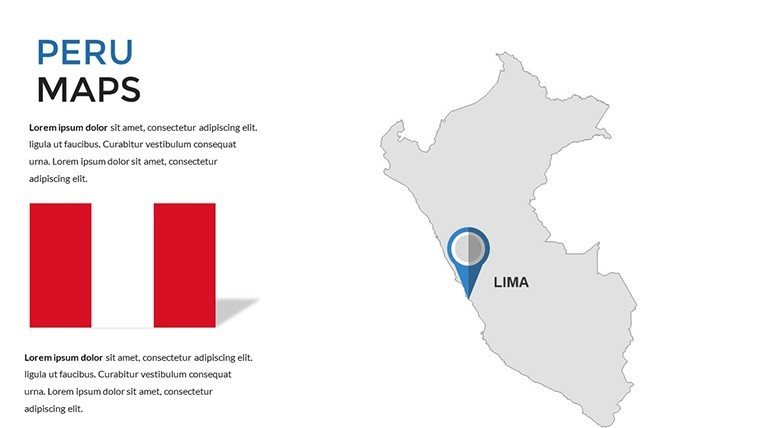
- Infrastructure Planning: Overlay pins and routes to illustrate new project developments or logistics networks.
- Educational Authority: Perfect for academic presentations on Peru`s biodiversity and historical Inca territories.
Designed for immediate professional use, the template eliminates the need for complex GIS software. Simply drag, drop, and recolor to match your corporate branding. This versatility ensures your message resonates in both the boardroom and the classroom.
Are the 25 regions of Peru individually editable?
Yes, each of the 25 administrative regions is a separate selectable object, allowing you to highlight, color, or pull them apart for detailed analysis.
Can I integrate my own Excel data into these maps?
The template includes editable charts and placeholders that can be linked or updated with your external data for dynamic visualization.
Will the map quality degrade if I resize it?
No. The maps are high-resolution vector graphics, meaning they will remain perfectly sharp even when scaled up for large projection screens.